ABSTRACT: Changes, apparent after investigation, in the physical and chemical properties in soil, as a result of organic and inorganic enrichments under flooded conditions, influence the growth of denitrifiers. The aim of this study was to determine the effect of the addition of manure (8 kg m−2) (M), clay (50 kg m−2) (CL) and lime (1.12 kg m−2) (Ca) on the N
2O-reducing activity (N2O-RA) of sandy loam soil (clay content - 24 % in 0-20 cm), during NO3 reduction under flooding. The soil samples were taken from field plots after 3 years of enrichment with grass cultivation. The enrichments had a distinct effect on the N2O-RA and N2O-released, due to the change in pH, the porosity, and the sorptive properties of the soil. The pH had the greatest impact on the N2O-RA of the soil and ranged from 4.9 to 7.6. For actual denitrification to N2O-realized (aD-N2O), the maximum N2O-releasing (mcN2O-releasing) followed the order: 1.36 for the M-treatment, 6.39 for the M+CL+Ca-treatment, 7.79 for the c-soil and 8.69 N2O-N mg kg
−1 for the M+CL-treatment. For actual denitrification (aD), the mcN2O-releasing was followed the order: 10.37 for the M-treatment, 10.49 for the control soil, 14.60 for the M+CL+Ca-treatment and 20.00 N2O-N mg kg−1 for the M+CL-treatment. The N
2O-RA of the soil samples increased as pH increased. The average N2O/N2+N2O ratio and the N2O-RA of the soil samples increased in the following order: M+CL, control soil, M+CL+Ca, M-enrichments. The addition of enrichments did not pose a threat to the environment due to increased N2O emissions, but as regards conserving NO3
¯ in the soil, the addition of clay distinctly increased the complete denitrification process.
Keywords: N2O/N2+N2O ratio, clay and Ca-enrichments, manure, actual denitrification
N
2O-reducing activity of soil amended with organic and inorganic enrichments under
Alicja Księżopolska1*, Teresa Włodarczyk2, Małgorzata Brzezińska2, Paweł Szarlip2, Marek Pazur2
1The John Paul II Catholic University of Lublin/Off-Campus Faculty of Social Sciences, ul. Ofiar Katynia 6a − 37-450 − Stalowa Wola − Poland.
2Institute of Agrophysics, Polish Academy of Sciences – Dept. of Natural Environment Biogeochemistry, ul. Doświadczalna 4 − 20-290 − Lublin − Poland. *Corresponding author <[email protected]>
Edited by: Fernando Dini Andreote
Received December 01, 2015 Accepted August 02, 2016
Introduction
The rate of denitrification and the relative pro-portions for NO, N2O, and N2 produced depend on the complex interactions between soil properties, soil mi-croorganisms, climatic factors and management prac-tices (Bieganowski et al., 2013; Franklin et al., 2015; Liu et al., 2010; Stępniewski and Stępniewska, 2009; Włodarczyk et al., 2014). From an environmental per-spective, a very important result is the N2O/N2+N2O ratio, which shows the N2O-reducing activity of soil (Yanai et al., 2008). The NO3 concentration is one of the key factors that influence the N2O/N2 ratio of denitri-fication (Saggar et al., 2013; Weier et al., 1993; Zaman et al., 2007). Increasing the availability of C is consid-ered to decrease the ratio of N2O/N2 (Dendooven et al., 1998; Saggar et al., 2013; Smith and Tiedje, 1979). In anaerobic zones of fertilized soil, the NO3 concentra-tion controls the denitrificaconcentra-tion product ratio (N2O/N2). Vallejo et al. (2006) noticed a decrease in N2O/N2, with increasing concentrations of dissolved organic carbon (DOC), in various sources of effluents. The denitrifi-cation can also alter the way in which N2O is shared among the two gaseous products, N2O and N2 product ratio (Senbayram et al., 2012). The next environmental factor that has an impact on the ratio of denitrification products (N2O and N2) is the pH. Šimek and Cooper (2002) found that, in soil samples with higher pH val-ues, the activity and synthesis of N2O reductase is sup-ported − more N2 is produced and the N2O/N2+N2O
ratio decreases. Cavigelli and Robertson (2000) showed that denitrification reductases and consequently the N2O-reducing activity of two soil samples differed in their sensitivity to pH and that the communities re-sponded differently to changes in pH. The destructive function of N2O and the positive influence of manure (M), clay (CL) and lime (Ca) on soil mechanical proper-ties of light textured soils, has led us to study the rela-tionships between the N2O-reducing activity (N2O-RA) of soil and the added treatments. In terms of periodic flooding of cultivated fields, little is known about the relationship between N2O-RA and soil in the presence of M, CL and Ca treatments. We hypothesized that, M, CL and Ca change the physical and chemical properties of soil and affect the N2O-RA in flooded soils. The main aim was to determine the effect of M, CL and Ca on the ability of soil to reduce N2O to N2, during NO3 reduc-tion under flooding. The specific aim was to determine both the complete actual denitrification and the incom-plete actual denitrification.
Abbreviations
mcN2O-releasing: maximum cumulative N2O released. aD-N2O: incomplete actual denitrification, leading to N2O formation.
aD: complete actual denitrification. N2O-RA: N2O-reducing activity of soil. c: control soil.
M+CL-treatment: soil with manure and clay addition. M+CL+Ca-treatment: soil with manure, clay and lime addition.
Corg: organic carbon.
Materials and Methods
Field experiment with manure, clay and Ca enrich-ments
The field plots were located in Boniewo (18°54’ E; 52°28’ N; 211 m asl) near Lublin (Poland). They were established on sandy loam texture (Haplic Luvisol), with a 47 % sand content, and a pH in 1 mol L−1 KCl 4.46 and
4.7 g kg−1 of organic C (C
org) (Table 1). Haplic Luvisols
(according to the FAO, 1998) make up the majority of field cultures in Poland. Enrichments and their doses on 2 m2 field plots were as follows: (i) No treatments
(un-treated soil as control). (ii) Soil + manure (8 kg m−2). (iii)
Soil + manure (8 kg m−2) + clay (50 kg m−2). (iv) Soil +
manure (8 kg m−2) + clay (50 kg m−2) + post flotation
lime (1.12 kg m−2).
The enrichments were mixed with soil to a depth of 20 cm. All field plots were covered with the grass,
Dactylis glomerata (L.).
Cattle manure (M) was taken from an agricultural farm and added to three field plots, except the control. In dry mass, the M contained: 0.2-0.25 g kg−1 N, 0.06 g kg−1
P, 0.28 g kg−1 K and 0.08 g kg−1 Mg. The clay (CL) came
from the “Jeziórko” sulfur mine near Tarnobrzeg (21°41’ E; 50°35’ N), where it was being used for improving the soil around the area of the mine. The final clay content increased from 24 to about 30 % after the enrichment.
Post flotation lime contained 2.6 to 3 g kg−1 Ca,
and was a waste product of the processing of sulfur. All of the enrichments were applied at the beginning of the experiment.
The soil samples were taken 3 years after adding enrichments to the soil. From the upper horizons (0-20 cm) of the four field plots (control, M, M+CL and M+CL+Ca) the soil was taken from five sites to the ex-periment’s laboratory and thoroughly mixed.
Determination of the chemical and physical attri-butes of the soil
The particle size distribution was determined by the sedimentation method and the distribution of par-ticle sizes was expressed as a percentage (Öhlinger, 1995). The determination of the rest of the soil prop-erties included Corg (Tiurin’s method) and the pH was determined in an aqueous suspension of soil (v:v = 1:1) using a pH-meter. The initial NO3¯and NH
4
+ content in
the soil solution were determined in 5 g of air-dried soil, suspended in 105 mL of 0.0125 mol L−1 CaCl
2. The
sus-pension was shaken for 2 h and the filtered solution of NO3 and NH4+ ions were determined using a flow
spec-trophotometer (Table 2). After analyzing the gases, the final NO3¯and NH
4
+ content were measured in the soil
suspensions. The soil suspensions were quantitatively transferred from glass bottles into plastic flasks, shaken for 2 h with 105 mL of 0.0125 mol L−1 CaCl
2 and then
filtered through filter paper. After this, the extracts were analyzed for NO3¯-N and NH
4
+-N content using the same
analyzer (Włodarczyk et al., 2011). The sorption capacity of soil (T) was determined by Kappen’s method. Sorption capacity of soils was calculated as follows: T = S + Hh mmolc+ kg−1 of soil, where S - the sum of metal cations
of an alkaline; Hh - hydrogen ions contained in the sorp-tion complex (hydrolytic acidity) (Turski, 2008).
Denitrification measurements
The 5 g of each soil portion (in three replications) was placed into (60 mL) glass bottles with deionized wa-ter. Taking into account the starting soil moisture, the soil/water ratio was 1:1 (w:w) with 0.5 cm of stagnant water on top of the soil surface. The vessels containing the soil and water were tightly sealed with rubber stop-pers and incubated. The incubation was performed with 10 % v:v C2H2 block and without C2H2 block. C2H2 can inhibit the reduction of N2O to N2. When C2H2 is not added, the N2O gas is free to transform into N2, allowing for the determination of the net N2O production rate (Xu et al., 2008). Paraffin films were used on the stoppers to ensure hermetic seals. The headspace gas was sampled
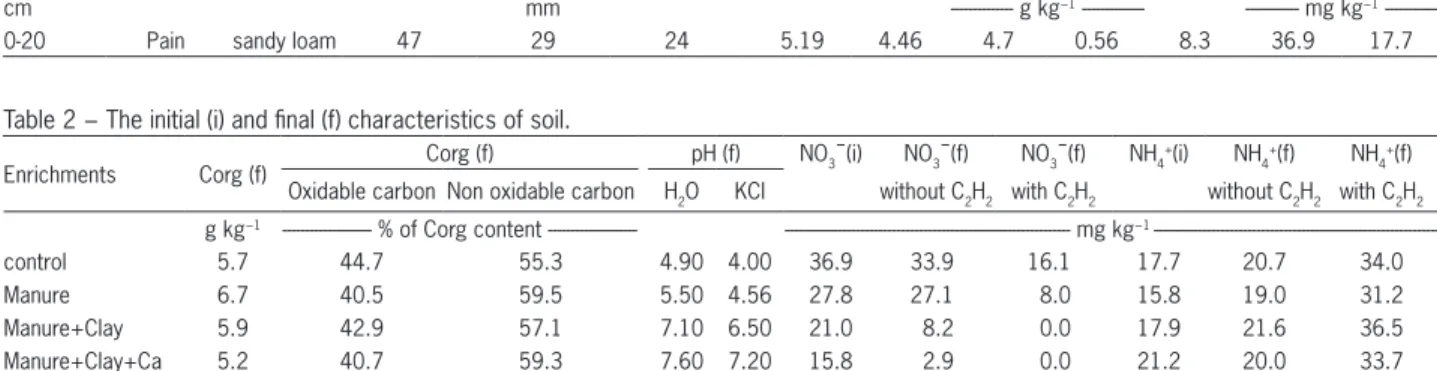
Table 1 − The initial characteristic of soil.
Soil depth Topography Soli type (texture)
Particle size distribution (%) pH
Corg N C/N NO3
¯ NH
4 + > 0.05 0.05-0.002 < 0.002 H2O KCl
cm mm --- g kg−1 --- --- mg kg−1
---0-20 Pain sandy loam 47 29 24 5.19 4.46 4.7 0.56 8.3 36.9 17.7
Table 2 − The initial (i) and final (f) characteristics of soil.
Enrichments Corg (f) Corg (f) pH (f) NO3¯(i) NO3¯(f) NO3¯(f) NH4 +(i) NH
4
+(f) NH 4
+(f)
Oxidable carbon Non oxidable carbon H2O KCl without C2H2 with C2H2 without C2H2 with C2H2
g kg−1 --- % of Corg content --- --- mg kg−1
---control 5.7 44.7 55.3 4.90 4.00 36.9 33.9 16.1 17.7 20.7 34.0
Manure 6.7 40.5 59.5 5.50 4.56 27.8 27.1 8.0 15.8 19.0 31.2
Manure+Clay 5.9 42.9 57.1 7.10 6.50 21.0 8.2 0.0 17.9 21.6 36.5
through the stopper with a gas tight syringe and the soil samples in three replications were incubated at 20 °C for 7 days (Włodarczyk et al., 2005).
After one, two, three and seven days of incuba-tion, the concentration of N2O in the headspace gas was determined using a gas chromatograph. This was fitted with an electron capture detector (ECD) at 300 °C. The gas components were separated on a 2 m long column, which was packed with porous polymer composed of ethylvynilbenzene and divynilbenzene (Porapak Q) at 80 °C. The carrier gas was He, at a flow rate of 40 mL min−1. The temperature of the injector was 120 °C. The
concentration of N2O-N was corrected for the gas dis-solved in water, values taken from the literature for the Bunsen absorption coefficients (Gliński and Stępniewski, 1985). The results were calculated in terms of kg of dry soil. The amount of N2O released (incomplete denitrifi-cation - aD-N2O) and the sum of N2O and N2 (complete denitrification - aD) was determined during the seven days of incubation, using a cumulative N2O release curve. In principle, the processes of N2O production and consumption occur simultaneously, with a prevalence of production before the maximum N2O value and a preva-lence of consumption after the maximum of production. In our study, the predominant process of N2O produc-tion was expressed as the maximum cumulative amount of N2O-N mg kg−1 soil over the seven days of incubation
(mcN2O-releasing) or as the amount on the day before the consumption of N2O. The average mcN2O-releasing was calculated from the maximum cumulative amount released in the subsequent days of incubation and all of the enrichments were taken together.
For each day of incubation, the N2O/N2+N2O ra-tio was calculated as follows: maximum cumulative N2O release (treatment without C2H2) divided by the cumula-tive amount of N2+N2O (treatment with C2H2 addition). The mean value for N2O/N2+N2O ratio was calculated as follows: the mean value of cumulative N2O release from each day of incubation for all of the enrichments taken together (treatment without C2H2), divided by the amount of N2+N2O (treatment with C2H2 addition).
The treatments were divided into two groups in order to determine the incomplete actual denitrification, leading to N2O formation and the complete actual deni-trification. The soil samples were prepared according to the following scheme:
I – soil without the addition of C2H2 – corresponding to actual denitrification, leading to N2O formation (aD-N2O) – incomplete denitrification.
II – soil with the addition of C2H2 – corresponding to actual denitrification (aD) – complete denitrification.
The aD-N2O and aD was analyzed in the c soil: (treatments I-II). This was done by an analogy of the soil with M-treatment, M+CL-treatment and M+CL+Ca-treatment. The additives used in the different treatments
(I–II) determined the type of denitrification (incomplete and complete).
Therefore, the study included the following mea-surements: (i) aD-N2O, (ii) aD and (iii) the content of na-tive nitrate (NO3¯) and ammonium (NH
4 +).
Statistical data analysis
The results were subjected to statistical analysis. The linear (y = a + bx) and logarithmic (y = alnx + b) models were used in the regression analysis and, in each case, the model with the highest R2 was selected as the
best fit for the experimental data. A one-way analysis of variance (LSD test) was used to test the significance of the effect of the soil enrichments (M, CL and Ca), the treatment (C2H2) and the days of incubation on N2O re-lease. The mean values for cumulative N2O release were calculated based on twelve replicates for each of the en-richments and one treatment (treatments I–II separately) from each day. The least significant differences (LSD) at
p < 0.05 were calculated following an analysis of vari-ance (ANOVA).
Results
Chemical and physical attributes
The basic soil characteristics are presented in Ta-ble 1. The Haplic Luvisol was formed from sandy loam silt. The soil particles were 47 % sand, 29 % silt and 24 % clay. The final clay content was about 30 % by addition of clay. The control soil used for the experiment had an acidic pH in H2O (5.19), a relatively high content of NO3¯
(36.9 mg kg−1) and NH 4
+ (17.7 mg kg−1) and a low C org
content (4.7 g kg−1). The basic initial (i) and final (f) soil
characteristics are presented in Table 2. Generally, Corg content increased during the final stage of the field ex-periment, compared to the initial values (4.7 g kg−1) and
ranged from 5.2 g kg−1 (M+CL+Ca-treatment; p < 0.01)
to 6.7 g kg−1 (M-treatment; p < 0.001). The pH slightly
decreased in the c-soil (from 5.19 to 4.9; p > 0.05), in-creased in the M-treatment (from 5.19 to 5.50; p < 0.05) and clearly increased in the M+CL-treatment (from 5.19 to 7.10; p < 0.001) and the M+CL+Ca-treatment from acid reaction (5.19) to alkaline reaction (7.60; p < 0.001). The initial content of NO3 in the enriched soil was lower, compared to the control soil and ranged from 27.8 to 15.8 mg kg−1 of soil (p value ranged from 0.05 to 0.001).
The initial content of NH4+ in the enriched soil ranged
from 15.8 to 21.2 mg kg−1 of soil (p value ranged from
0.05 to 0.01) and was close to the value of the control soil except that of the M+CL+Ca-treatment (Table 2). In the case of M+CL-treatment there were no significant differences (p > 0.05).
The sorption capacity of the soil ranged from 32.0 to 33.8 mmolC+ kg−1 of soil (for lower pH), and from 49.8
to 67.3 mmolC+ kg−1 of soil (for higher pH). The sorption
39 to 40 and 42 to 45 % (v:v), respectively which was significantly higher in soils with higher pH as compared to soil with lower pH (p < 0.01).
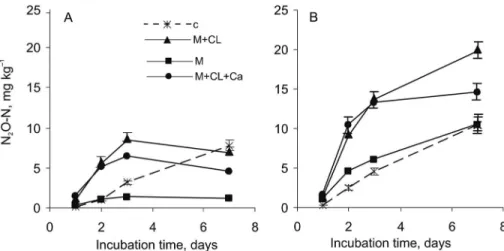
Incomplete denitrification (aD-N2O) under flooding soil conditions
The release of N2O increased on the third day of incubation. It then decreased in three cases of the en-riched soil samples, except in the c-soil (Figure 1A). This was due to the consumption of N2O produced and then released into the headspace.
The incomplete mcN2O-releasing for the c-soil was 7.79 N2O-N mg kg−1, which was 21 % of the natural NO
3 ¯
(Table 3).
The addition of M resulted in a distinct decrease (p
< 0.001) in aD-N2O, compared to the c-soil. The mcN2 O-releasing for the M-treatment was 1.36 N2O-N mg kg−1
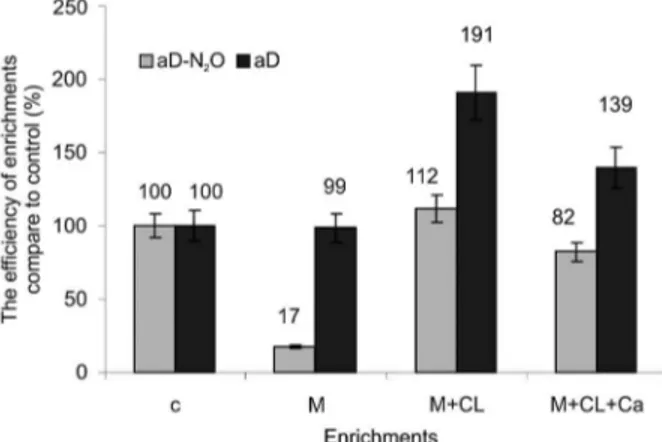
and represented 17 % of the c-soil (Figure 2). The per-cent of denitrified NO3¯ leading to the formation of N
2O,
was 5 % of the natural content (Table 3).
Compared to the c-soil, the addition of M+CL to the soil slightly increased aD-N2O (p > 0.05). The mc-N2O-releasing for the M+CL-treatment was 8.69 N2 O-N mg kg−1, which was 41 % of the natural NO
3 (Table
3). Furthermore, it was 1.1 times higher than the c-soil and 6.4-fold higher than the M-treatment (p < 0.001) soil (Figure 2).
The addition of M+CL+Ca to the soil decreased aD-N2O (p < 0.05), compared to the c-soil. The mcN2 O-releasing for the M+CL+Ca-treatment soil was 6.39 N2O-N mg kg−1, which was 41 % of the natural NO
3
(Table 3). This was 1.2 times lower than the c-soil, 4.8-fold higher than the M-treatment soil (p < 0.001) and 1.4 times lower than the M+CL-treatment (p < 0.01) soil (Figure 2).
The highest consumption of N2O was in the M+CL+Ca-treatment soil (28 % released N2O). The lowest consumption was in the M-treatment soil (17 % released N2O). Slightly higher consumption was found in the M+CL-treatment soil (19 % released N2O) (Table 3).
At the beginning of incubation, the natural con-tent of NO3¯ ranging from 15.8 to 36.9 mg kg−1 (Table
3), depending on the enrichments. The natural content of NO3¯ decreased as a function of the increased
enrich-ment of the soil. The highest content was in the c-soil and the lowest in the M+CL+Ca-treatment soil. There was no correlation between the natural NO3¯content and
the mcN2O-releasing for aD-N2Oand aD.
Complete denitrification (aD) under flooding soil conditions
The release of N2O increased on the seventh day of incubation with different activity (Figure 1B). There was no consumption by reason of the C2H2 addition.
Table 3 − Natural NO3¯ content, maximum N2O release, percent of NO3¯ denitrified and N2O consumption depending on type of enrichment.
Enrichments NO3¯ content
Maximum N2O release NO3¯ denitrified N2O consumed
Without C2H2 With C2H2 Without C2H2 With C2H2 Without C2H2
mg kg−1 %
---control 36.9 7.79 10.49 21.1 28.5 0.0
Manure 27.8 1.36 10.37 4.9 37.3 16.6
Manure+Clay 21.0 8.69 20.00 41.4 95.1 18.6
Manure+Clay+Ca 15.8 6.39 14.60 40.5 92.6 28.4
The complete mcN2O-releasing for the c-soil was 10.5 N2O-N mg kg−1, which was 29 % of the natural NO
3 ¯
(Table 3).
The complete mcN2O-releasing for the M-treat-ment soil was nearly the same as the c-soil (Figure 1B) and was 10.4 N2O-N mg kg−1 (p > 0.05). The percentage
of the denitrified NO3, leading to complete denitrifica-tion, was 37 % of the natural content (Table 3).
Much higher mcN2O-releasing values for the com-plete aD were found in the M+CL-treatment soil (20.0 mg N2O-N kg−1), which was 95 % of the natural NO
3 ¯
(Table 3) and higher (about two times higher) than the c-soil and M-treatment (p < 0.001) soil (Figure 2).
The addition of M+CL+Ca to the soil increased (1.4 times) the mcN2O-releasing aD, compared to the c-soil and M-treatment (p < 0.01) soil (Figure 2). Furthermore, it decreased (1.4 times) compared to the M+CL-treatment (p < 0.01) soil (Figure 2). The mcN2O-releasing for the M+CL+Ca-treatment soil was 14.6 N2O-N mg kg−1. The
percentage of denitrified NO3, leading to complete denitri-fication, was 93 % of the natural content (Table 3).
The regression analysis for aD-N2O and aD in the c-soil showed a positive linear relationship after seven days of incubation (p < 0.001).The statistical analysis for aD-N2O in the enriched soil, showed a positive non-linear relationship with the first three days of incubation (when the production and release of N2O enabled con-sumption) (p < 0.001), and after seven days of incuba-tion (p < 0.001) for aD.
Incomplete denitrification (aD-N2O), complete de-nitrification (aD) and N2O-reducing activity of soil as a function of soil pH
In the current study, the addition of M-, M+CL- and M+CL+Ca-treatments had increased pH by 0.31, 1.91 and 2.41 units, respectively. The aD-N2O in the soil
with a lower pH in H2O ranged from 4.9 to 5.5 (pH in the range of acid soil) for the c-soil and M-treatment, respectively, characterized by lower denitrification ac-tivity. Furthermore, the average mcN2O-releasing was 4.58 N2O-N mg kg−1, compared to the higher pH in
H2O, which ranged from 7.10 to 7.60 (pH in the range of neutral or alkaline soil) for the M+CL- and M+CL+Ca-treatments, respectively, characterized by the higher de-nitrification activity. Here, the average mcN2O-releasing was 7.54 N2O-N mg kg−1. A similar phenomenon was
observed during aD. The average mcN2O-releasing was 10.43 and 17.3 N2O-N mg kg−1 for the lower and higher
pH, respectively.
The lowest N2O-RA was found in the c-soil with the lowest pH (the highest N2O/N2+N2O ratio – 0.74; pH 4.9). However, the highest N2O-RA was found in the M-treated soil (the lowest N2O/N2+N2O ratio – 0.22; pH 5.5). The N2O/N2+N2O ratios for the other two treat-ments were 0.63 and 0.48, respectively for M+CL (pH 7.1) and M+CL+Ca (pH 7.6).
N2O-reducing activity of soil (N2O/N2+N2O ratio) under flooding
The ratio of N2O/N2+N2O described the N2 O-re-ducing activity (N2O-RA) of the soil samples. The N2 O-RA of the soil varied (Figure 3). At the time of incuba-tion, the N2O-RA showed an upward or downward trend, depending on the enrichments. In the c-soil, the N2O-RA of the soil decreased with the incubation time and the ratio ranged from 0.40 to 0.74. The average percentage of N2O formation in the products of denitrification in the c-soil was 56 %.
In the case of the remainder of the treatments the N2O/N2+N2O ratio showed a downward trend at the time of incubation compared to the c-soil and ranged from 0.34 to 0.22 (M-treatment), from 0.91 to 0.63 (M+CL-treatment) and from 0.86 to 0.48 (M+CL+Ca-treatment). The average percentage of N2O formation in the products of denitrification in the M-treatment soil was 23 %, in the M+CL-enriched soil 62 % and in the M+CL+Ca-treatment soil 54 %.
Figure 2 − The efficiency of organic and inorganic treatments compared to control soil for the actual denitrification leading to N2O release (aD-N2O) and actual denitrification (aD); c = control soil; M = manure enrichment; M+CL = manure and clay enrichments; M+CL+Ca = manure, clay and lime enrichments
The decline in the value of N2O/N2+N2O ratio to 0.11, 0.35 and 0.31 for the M-, M+CL-, and M+CL+Ca-treatment, respectively (Figure 3), was due to the con-sumption of N2O afterthe third day of incubation in aD-N2O.
Based on the average N2O/N2+N2O ratio, the N2 O-RA of the soil increased in the following order: M+CL < c < M+CL+Ca < M.
Discussion
Incomplete denitrification (aD-N2O) and complete denitrification (aD) under flooding
The rate of denitrification depends on the ma-nure’s capability, and both labile and complex forms of C. (Zhang et al., 2015). The use of manure in farming practice inspired us to investigate aD-N2O and aD and consequently N2O-RA in soil enriched with manure. This assumption allowed us to find out which combination of soil enrichments had a greater impact on the denitrifica-tion process under flooding condidenitrifica-tions, i.e., hypoxia. The native organic matter introduced into the soil by manure and other enrichments, i.e., clay and lime, as well as products of microbial transformation, have a positive effect on the physical, chemical and biological proper-ties of soil (Czyż and Dexter, 2016; Cima et al., 2015; Haruna and Nkongolo, 2015; Księżopolska and Joniec, 2014). The application of manure caused an increase in the number of bacteria in the activity of soil dehydro-genases, and in the intensity of the process of soil res-piration. Clay minerals generally reduce decomposition rates due to lower accessibility of the organic matter and increased adsorption of metabolites to surfaces. Liming is used in acid agricultural soils, as it increases pH up to values where the availability of nutrients is higher (Księżopolska and Joniec, 2014). The tested soil had very different aD-N2O levels, shown as mcN2O-releasing, which took the following order: 1.36 (M-treatment), 6.39 (M+CL+Ca-treatment), 7.79 (c-soil) and 8.69 N2O-N mg kg−1 (M+CL-treatment). The results of complete aD,
compared to aD-N2O, were different and mcN2 O-releas-ing took the followO-releas-ing order: 10.37 (M-treatment), 10.49 (c-soil) 14.60 (M+CL+Ca-treatment) and 20.00 N2O-N mg kg−1 (M+CL-treatment). This implies that, in
differ-ent combinations, the addition of M, CL and Ca to the soil strongly influenced the denitrification process and its N2O-RA in the soil. This was particularly the case for the M-treatment. After the application of the enrich-ments, the changes included levels of nutrient content and its availability, the pH, the sorptive properties and the porosity of soil.
Conservation of soil organic matter is widely rec-ognized as a strategy used for improving soil quality and reduce, amongst others, N2O emissions into the atmo-sphere. The addition of enrichments differentiated the availability of organic C and influenced especially the aD-N2O, where the lowest N2O release (M-treatment) was connected with the lowest oxidable C content.
Księżopolska et al. (2011) investigated the Corg trans-formation in sandy soil (Haplic Luvisol), enriched in field experiments with organic and inorganic materials and found that treatments stimulated or inhibited Corg mineralization and stimulated their enzymatic activity (Księżopolska and Joniec, 2014), which varies with aera-tion status (water-filled pore-space, WFPS) (Weymann et al., 2010).
We noted that, in the c-soil (aD-N2O), the linear function of the cumulative increased N2O in the head-space was similar to the 0-order of the reaction rate and the growth of denitrifiers was adapted to the natural NO3¯ and C
org where production outweighed N2O
con-sumption. Undoubtedly, this balanced activity of deni-trification can determine the C:N ratio (which amounted to 8.3:1 in the control soil) and approach the value de-fined by the microclimate conditions e.g., the C:N ratio 10:1 or 8:1 (Schulten and Schnitzer, 1997). The addition of the fermented manure in the stabilized soil C:N ratio (7.9:1) to the rest of the treatments (with and without the CL and Ca-additions) modified the denitrification rate and the N2O-releasing indicated a similar response as the 1-order reaction and was non-linear (logarithmic increase of N2O at the time). Pastorelli et al. (2011) found that the influx of C sources and energy into the oligo-trophic soil system was a major driving force in biogeo-chemical cycles.
The reasons for the higher activity of aD-N2O and aD in soil with a higher pH also lie in the sorption capac-ity (T mmolc+ kg−1), and the higher degree of saturation
of the sorption complex with basic cations (V%) in the soil and the addition of clay in combination with ma-nure under field conditions. The sorption capacity of the soil and the degree of saturation of the sorption complex with basic cations increased as the pH increased.
And finally, the highest aD-N2O and aD were ac-companied by the highest contents of two macro-com-ponents of soil: phosphorus and potassium. Thus, the higher abundance of nutrients in the soil affected the higher denitrification activity in the neutral and alkaline soil. In this case, the addition of clay was essential.
In conclusion, the addition of enrichments does not pose a threat to the environment due to increased N2O emissions and, whatsmore, in the case of M-treat-ment, decreased. However, in the case of aD, the addi-tion of clay proved to be disadvantageous with regard to conserving NO3¯ in the soil. This is because it increased
the complete denitrification, compared to the control soil. From the point of view of protecting the environ-ment, the results led to the conclusion that the addition of manure, in particular, should be recommended.
N2O-reducing activity (N2O/N2+N2O ratio) under flooding
From an environmental perspective, a very impor-tant result is the N2O/N2+N2O ratio, which shows the N2O-RA of soil (Yanai et al., 2008). This directly resulted, amongst other effects, in the diversity of soil pH and the availability of substrates, and indirectly resulted in the type of microbial community and the biochemical reaction. Pastorelli et al. (2010, 2011) have shown that the extent and degree of active bacterial diversity and the microbial communities in soil are clearly affected by the type of management and agriculture practices. The results indicated that the tested soil showed the high-est N2O-RA in a weakly acidic reaction (M-treatment) but much lower in an acid reaction (c-soil). The cause of different denitrification activity of the soil was the impact of the sensitivity of the nitrate reductases par-ticipating in the denitrification on soil acidity and N2O reductase. Šimek and Cooper (2002) found that under an acidic pH, the activity of N2O reductase is lowered and the synthesis of new N2O reductases is inhibited. This results in increased accumulation of N2O. In soil with higher pH values, the activity and synthesis of N2O reductase is supported. Our results confirm the signifi-cant effect of pH on the N2O-RA of soil with additions that are often used in farming practices, such as manure and Ca where the N2O-RA of the soil increases with the increasing pH. Čuhel and Šimek (2011) stated that the ratio of denitrification products (N2O and N2) is pH-spe-cific rather than soil-spepH-spe-cific. Laboratory and field stud-ies have demonstrated that the denitrification reductases and the N2O/N2 ratio differed in their sensitivity to pH and increased when the pH of soil was reduced (Cavigelli
and Robertson, 2000; Šimek and Cooper, 2002). This in-crease is non-linear. In our opinion, in the case of the M-treatment, other factors (described below) affect its activity. Generally, the N2O-RA was highest in the M-treated soil. Undoubtedly, this can be associated with a higher content of readily available organic carbon added with manure, compared to the c-soil. Following a large input of labile C, Senbayram et al. (2009) observed low N2O emissions without significant NO3¯ input in the soil
amended with organic matter. The nature and availabil-ity of soil C affects the denitrification enzyme activavailabil-ity (DEA), microbial community composition and the N2O/ N2 ratio. This is due to the ability of manure to provide both labile and complex forms of C for soil organisms.
In the c-soil, the N2O-RA of the soil with natural NO3¯ content decreased with the incubation time caused
by a gradual depletion of easily available carbon. In vari-ous sources of effluents, Vallejo et al. (2006) noticed a de-crease in N2O/N2 with increasing concentrations of DOC.
In the case of the treated soil samples, there was a sharp decline in the value of the N2O/N2+N2O ratio after the first day of incubation, compared to the c-soil. The sharp decline could have been due to the various dura-tions needed to activate reductases in the denitrification pathway after flooding. Dendooven and Anderson (1995) found that NO3 reductase was formed within 2 to 3 h, NO2 reductase between two and 12 h and N2O reductase between 24 and 42 h.
The high declining value of N2O/N2+N2O ratio re-quires a separate discussion. There is a high probability that in all the soils with the addition of manure, the ni-trification process occurred very intensively on the first day of incubation and the N2O, like a byproduct of the nitrification, was an additional source of N2O (Ciarlo et al., 2008; Martins et al., 2015; Włodarczyk et al., 2011; Zhong et al., 2015) when N2O reductase was still inac-tive. In flooded soil, there is a thin oxygenated layer at the interface between air and water, which may occur at the same time as the processes of nitrification and denitrification (Yu et al., 2006). In the soil with manure, there was an intense mineralization of organic matter, with a release in the form of ammonium (NH4+). The
confirmation of our hypothesis is the accumulation of NH4+ after seven days of incubation in the soil with the
addition of acetylene (C2H2) (Table 3), which is an in-hibitor of nitrification (Liu et al., 2015). The decrease in the N2O/N2+N2O ratio can be explained by lower ni-trification, caused by the decline in the substrate and the lowered oxygen concentration in the course of in-cubation for nitrifiers, as obligatory aerobic. Indirect evidence for the activity of nitrifiers in aD-N2O was a much lower percentage ofdenitrified NO3¯ (M+CL – 41
% and M+CL+Ca – 40 % for aD-N2O) and the very high percentage ofdenitrified NO3¯ in aD with a higher pH
In the soil with the addition of manure, there was a significantly lower ratio of N2O/N2+N2O, compared to M+CL and M+CL+Ca. This could have been caused by the significant reduction of nitrification due to the lower soil pH (acidic soil - pH 5.5). The pH affects ni-trification. A hydrogen ion toxicity at pH values of 5.7 and below has also been proposed as a mechanism for nitrification inhibition (Szwerinski et al., 1986). This explains the reduction observed in the nitrification rate when the pH suddenly changed from 7.2 to 5.8 but not when it changed from 7.2 to 6.4 in an activated sludge system. The optimal pH for the growth of nitri-fying bacteria varies widely (Ma et al., 2014). Chen et al. (2006) found that the optimum pH for nitrification ranges from 7.0 to 9.0, with the optimum pH ranging from 7.2 to 8.8 for Nitrosomonas and 7.2 to 9.0 for Ni-trobacter.
Secondly, a significantly higher soil porosity with the addition of M, in combination with CL (45 %) and CL+Ca (42 %), could have stimulated the development of nitrifiers in the field, resulting in their active develop-ment under the conditions of a laboratory experidevelop-ment.
The N2O-RA of soil allows us to determine the capa-bility of soil to release N2 as the final product. With regard to protecting the natural environment and predicting ni-trous oxide (N2O) emissions, this information is extremely important to understanding and modeling field fluxes of N2O from soil under conditions of hypoxia.
.
References
Bieganowski, A.; Witkowska-Walczak, B.; Gliński, J.; Sokołowska, Z.; Sławiński, C.; Brzezińska, M.; Włodarczyk, T. 2013. Database of Polish arable mineral soils: a review. International Agrophysics 27: 335-350.
Cavigelli, M.A.; Robertson, G.P. 2000. The functional significance of denitrifier community composition in a terrestrial ecosystem. Ecology 81: 229-241.
Chen, S.; Ling, J.; Blancheton, J.P. 2006. Nitrification kinetics of biofilm as affected by water quality factors. Aquacultural Engineering 34: 179-197.
Ciarlo, E.; Conti, M.; Bartoloni, N.; Rubio, G. 2008. Soil N2O emissions and N2O/(N2O+N2) ratio as affected by different fertilization practices and soil moisture. Biology and Fertility of Soils 44: 991-995.
Cima, D.S.; Luik, A.; Reintam, E. 2015. Organic farming and cover crops as an alternative to mineral fertilizers to improve soil physical properties. International Agrophysics 29: 405-412. Čuhel, J.; Šimek, M. 2011. Effect of pH on the denitrifying enzyme activity in pasture soils in relation to the intrinsic differences in denitrifier communities. Folia Microbiologica 56: 230-235. Czyż, E.A.; Dexter, A.R. 2016. Estimation of the density of the
clay-organic complex in soil. International Agrophysics 30: 19-23.
Dendooven, L.; Anderson, J. 1995. Use of a “least-square” optimization procedure to estimate enzyme characteristics and substrate affinities in the denitrification reactions in soil. Soil Biology and Biochemistry 27: 1261-1270.
Dendooven, L.; Bonhomme, E.; Merckx, R.; Vlassak, K. 1998. Injection of pig slurry and its effects on dynamics of nitrogen and carbon in a loamy soil under laboratory conditions. Soil Biology and Fertility of Soils 27: 5-8.
Food and Agriculture Organization [FAO]. 1998. World Reference Base for Soil Resources. FAO, Rome, Italy. (World Soil Resources Report, 84).
Franklin, H.M.; Dickinson, N.M.; Esnault, C.J.D.; Robinson, B.H. 2015. Native plants and nitrogen in agricultural landscapes of New Zealand. Plant and Soil 394: 407-420. Gliński, J.; Stępniewski, W. 1985. Soil Aeration and its Role for
Plants. CRC Press, Boca Raton, FL, USA.
Haruna, S.I.; Nkongolo, N.V. 2015. Effects of tillage, rotation and cover crop on the physical properties of a silt-loam soil. International Agrophysics 29: 137-145.
Księżopolska, A.; Joniec, J. 2014. Activity of microorganisms participating in organic matter transformation in Haplic Luvisol soil. Ecological Chemistry and Engineering 3: 499-514.
Księżopolska, A.; Włodarczyk, T.; Gliński, J.; Flis-Bujak, M. 2011. Respiration of soil enriched with manure and mineral materials (methodical aspects). Polish Journal of Environmental Studies 20: 387-392.
Liu, B.; Mørkved, P.T.; Frostegård, A.; Bakken, L.R. 2010. Denitrification gene pools, transcription and kinetics of NO, N2O and N2 production as affected by soil pH. FEMS Microbiology Ecology 72: 407-417.
Liu, R.; Hayden, H.; Suter, H.; He, J.; Chen, D. 2015. The effect of nitrification inhibitors in reducing nitrification and the ammonia oxidizer population in three contrasting soils. Journal of Soils and Sediments 15: 1113-1118.
Ma, S.; Zhang, D.; Zhang, W.; Wang, Y. 2014. Ammonia stimulates growth and nitrite-oxidizing activity of Nitrobacter winogradskyi.Biotechnology and Biotechnological Equipment 28: 27-32.
Martins, M.R.; Jantalia, C.P.; Polidoro, J.C.; Batista, J.N.; Alves, B.J.R.; Boddey, R.M.; Urquiaga, S. 2015. Nitrous oxide and ammonia emissions from N fertilization of maize crop under no-till in a Cerrado soil. Soil and Tillage Research 151: 75-81.
Öhlinger, R. 1995. Methods is soil physics and chemistry. p. 385-390. In: Schiner, F.; Öhlinger, R.; Kandeler, E.; Margesin, R., eds. Methods in soil biology. Springer, Heidelberg, Germany. Pastorelli, R.; Landi, S.; Trabelsi, D.; Piccolo, R.; Mengoni, A.;
Bazzicalupo, M.; Pagliai, M. 2011. Effects of soil management on structure and activity of denitrifying bacterial communities. Applied Soil Ecology 49: 46-58.
Pastorelli, R.; Piccolo, R.; Cocco, S.; Landi, S. 2010. mRNA recovery and denitrification gene expression in clay-soil bacterial communities under different agricultural managements. Agrochimica 54: 179-192.
Saggar, S.; Jha, N.; Deslippe, J.; Bolan, N.S.; Luo, J.; Giltrap, D.L.; Kim, D.G.; Zaman, M.; Tillman, W. 2013. Denitrification and N2O:N2 production in temperate grasslands: processes, measurements, modelling and mitigating negative impacts. Science of the Total Environment 465: 173-195.
Senbayram, M.; Chen, R.; Mühling, K.H.; Dittert, K. 2009. Contribution of nitrification and denitrification to nitrous oxide emissions from soils after application of biogas waste and other fertilizers. Rapid Communications in Mass Spectrometry 23: 2489-2498.
Senbayram, M.; Chen, R.; Budai, A.; Bakken, L.; Dittert, K. 2012. N2O emission and the N2O/(N2O+N2) product ratio of denitrification as controlled by available carbon substrates and nitrate concentrations. Agriculture, Ecosystems and Environment 147: 4-12.
Šimek, M.; Cooper, J.E. 2002. The influence of soil pH on denitrification: progress towards the understanding of this interaction over the last 50 years. European Journal of Soil Science 53: 345-354.
Smith, M.S.; Tiedje, J.M. 1979. Phases of denitrification following oxygen depletion in soil. Soil Biology and Biochemistry 11: 261-267.
Stępniewski, W.; Stępniewska, Z. 2009. Selected oxygen-dependent process-response to soil management and tillage. Soil and Tillage Research 102: 193-200.
Szwerinski, H.; Arvin, E.; Harremoës, P. 1986. pH-decrease in nitrifying biofilms. Water Research 20: 971-976.
Turski, R. 2008.Exercises for Students of Agricultural. University of Life Science Press, Lublin, Poland (in Polish).
Vallejo, A.; Skiba, U.M.; García-Torres, L.; Arce, A.; López-Fernández, S.; Sánchez-Martín, L. 2006. Nitrogen oxides emission from soils bearing a potato crop as influenced by fertilization with treated pig slurries and composts. Soil Biology and Biochemistry 38: 2782-2793.
Weier, W.C.; MacRae, I.C.; Myers, R.J.K. 1993. Denitrification in a clay soil under pasture and annual crop: losses from 15N-labelled nitrate in the subsoil in the field using C2H2 inhibition. Soil Biology and Biochemistry 25: 999-1004. Weymann, D.; Geistlinger, R.W.; von der Heide, C.; Flessa, H.
2010. Kinetics of N2O production and reduction in a nitrate-contaminated aquifer inferred from laboratory incubation experiments. Biogeosciences 7: 503-543.
Włodarczyk, T.; Stępniewski, W.; Brzezińska, M. 2005. Nitrous oxide production and consumption in Calcaric Regosols as related to soil redox and texture. International Agrophysics 19: 263-271.
Włodarczyk, T.; Stępniewski, W.; Brzezińska, M.; Majewska, U. 2011. Various textured soil as nitrous oxide emitter and consumer. International Agrophysics 25: 287-297.
Włodarczyk, T.; Szarlip, P.; Kozieł, W.; Nosalewicz, M.; Brzezińska, M.; Pazur, M.; Urbanek, E. 2014. Effect of long storage and soil type on the actual denitrification and denitrification capacity to N2O formation. International Agrophysics 28: 371-381. Xu, Y.; Wan, S.; Cheng, W.; Li, L. 2008. Impacts of grazing
intensity on denitrification and N2O production in a semi-arid grassland ecosystem. Biogeochemistry 88: 103-115.
Yanai, Y.; Hatano, R.; Okazaki, M.; Toyota, K. 2008. Analysis of the C2H2 inhibition-based N2O production curve to characterize the N2O-reducing activity of denitrifying communities in soil. Geoderma 146: 269-276.
Yu, K.; Faulkner, S.P.; Patrick, W.H. 2006. Redox potential characterization and soil greenhouse gas concentration across a hydrological gradient in a Gulf coast forest. Chemosphere 62: 905-914.
Zaman, M.; Nguyen, M.L.; Matheson, F.; Blennerhassett, J.D.; Quin, B.F. 2007. Can soil amendments (zeolite or lime) shift the balance between nitrous oxide and dinitrogen emissions from pasture and wetland soils receiving urine or urea-N? Australian Journal of Soil Research 45: 543-553.
Zhang, H-X.; Sun, B.; Xie, X-L.; Zhuang, S-Y. 2015. Simulating the effects of chemical and non-chemical fertilization practices on carbon sequestration and nitrogen loss in subtropical paddy soils using the DNDC model. Paddy and Water Environment 13: 495-506.