Assessment of Coastal Ecosystem Services for
Conservation Strategies in South Korea
Min Gon Chung¤, Hojeong Kang*, Sung-Uk Choi
School of Civil and Environmental Engineering, Yonsei University, Seoul, Korea
¤ Current address: Center for System Integration and Sustainability, Department of Fisheries and Wildlife, Michigan State University, East Lansing, Michigan, United States of America
*hj_kang@yonsei.ac.kr
Abstract
Despite the fact that scientific and political consideration for ecosystem services has dra-matically increased over the past decade, few studies have focused on marine and coastal ecosystem services for conservation strategies. We used an ecosystem services approach to assess spatial distributions of habitat risks and four ecosystem services (coastal protec-tion, carbon storage, recreaprotec-tion, and aesthetic quality), and explored the tradeoffs among them in coastal areas of South Korea. Additionally, we analyzed how the social and ecologi-cal characteristics in coastal areas interact with conservation and development policies by using this approach. We found strong negative associations between the habitat risks and ecosystem services (aquaculture, carbon storage, recreation, and aesthetic quality) across the coastal counties. Our results showed that the intensity of the habitat risks and the provi-sion of ecosystem services were significantly different between reclamation-dominated and conservation-dominated counties, except for coastal vulnerability. A generalized linear model suggested that reclamation projects were dependent on economic efficiency, whereas demographic pressures and habitat conditions influenced the designation of pro-tected areas at a county level. The ecosystem services approach provided guidelines to achieve both sustainable development and environment conservation. By using the approach, we can select the priority areas for developments while we can minimize the deg-radation of biodiversity and ecosystem services. As cultural ecosystem services are evenly distributed throughout coastal areas of South Korea, decision makers may employ them to improve the conditions of coastal wetlands outside of protected areas.
Introduction
Ecosystem services are defined as benefits to human well-being that are derived from nature systems [1,2]. The concept of ecosystem services deals with both scientific activities and envi-ronmental policies such as the Convention on Biological Diversity (CBD) and the Intergovern-mental Science-Policy Platform on Biodiversity and Ecosystem Services (IPBES) [3]. Marine and coastal ecosystems provide a broad range of ecosystem goods and services to human OPEN ACCESS
Citation:Chung MG, Kang H, Choi S-U (2015) Assessment of Coastal Ecosystem Services for Conservation Strategies in South Korea. PLoS ONE 10(7): e0133856. doi:10.1371/journal.pone.0133856
Editor:Jian Liu, Shandong University, CHINA
Received:February 26, 2015
Accepted:July 3, 2015
Published:July 29, 2015
Copyright:© 2015 Chung et al. This is an open access article distributed under the terms of the
Creative Commons Attribution License, which permits unrestricted use, distribution, and reproduction in any medium, provided the original author and source are credited.
Data Availability Statement:All relevant data are within the paper and its Supporting Information files.
Funding:This work was supported by National Research Foundation 2011-0030040 (http://www.nrf. re.kr) to HK. The funder had no role in study design, data collection and analysis, decision to publish, or preparation of the manuscript.
society, because they are one of the most productive ecosystems on Earth [2]. Recently, most services provided by the oceans and coastal zones have more rapidly deteriorated than other ecosystems [4]. Population distribution analysis indicates that about two billion people live in 7.6% of the land areas, and the coasts of Asia have experienced particularly high population pressures [4]. This leads not only to high population densities but also to development pres-sures in the coastal zone.
As many studies have provided hidden values of coastal wetlands such as habitats for migra-tory birds, storm protection, erosion control, water treatment, and high biodiversity [5], the estimated values of coastal wetlands have increased from 14,000 $/ha/yr in 1997 to 194,000 $/ha/yr in 2014 [6]. This highlights the fact that coastal wetlands are one of the most valuable ecosystems in the world. However, coastal wetlands have been severely affected by anthropo-genic impacts, which include not onlyin situdevelopment such as land reclamation, but also pollutions derived from upland agriculture and industry [2,4]. Therefore, it is necessary to consider terrestrial and coastal areas as a single spatial unit to assess accurately ecosystem ser-vices and implement efficient conservation strategies for coastal wetlands.
In East Asia, the reclamation projects of coastal wetlands in the past few decades have often been performed to expand land areas for increasing human activities such as urbanization and industrial development [7,8]. Whereas many decision makers believe that reclamation is a cost-effective way to pursue economic growth by building industrial complexes on reclaimed areas, large-scale reclamation has caused the degradation of coastal ecosystems and their ser-vices [5]. Reclamation of coastal wetland has led to permanent changes in ecosystem processes and functions [9] and it reduces not only ecosystem services but also human well-being in coastal areas [10]. Since coastal wetlands are directly affected by anthropogenic land-based activities and are closely linked to human society (e.g., fisheries, recreation, and reclamation) [9], societal characteristics (i.e., demographic and socioeconomic factors) impact conservation and development strategies. Conventionally, East Asian countries performed environmental impact assessments and cost-benefit analyses for coastal wetland reclamation projects. Although the assessments and analyses could consider the reclamation impacts on fisheries and direct environmental pollution, they have not quantified biodiversity loss and its impacts on ecosystem services provided by coastal wetlands [5,9].
Implementing reclamation policies often causes conflicts between different groups, which demand either conservation or development [11]. If development pressure is extremely high, politicians might be averse to implement conservation policies due to the conservation/devel-opment tension [12]. The designation of protected areas is a primary tool for relieving the pres-sures of coastal zone development among conservation strategies [13]. However, stakeholders often oppose the designation of protected areas, because it will restrict the use of provisioning services like fishery activities required for sustainable livelihoods. Although decision makers have recently attempted to plan compensation arrangements for protected areas to avoid con-flicts between stakeholders and governments [14], previous studies could not provide scientific evidence for decision-making processes to resolve the conflicts. Only a few studies have consid-ered the synergy of biodiversity and ecosystem services along with societal characteristics within coupled human and natural systems (CHANS) [15], particularly in coastal areas.
help us prioritize coastal areas for conservation and assist decision makers in informing the configuration of a spatial plan in coastal areas.
In this paper, we aimed to reveal determinants behind wetland reclamation projects and the designation of protected areas in coastal zones of South Korea. Additionally, we aimed to pro-pose effective strategies for coastal management using an ecosystem services approach. We fol-lowed a scientific assessments tool, InVEST model, to understand the complex interactions between human and natural systems. Then, we performed spatial assessments of natural habi-tat risks and ecosystem services. Using the results of the spatial assessments, we carried out tradeoff analysis and uncovered the determinants of reclamation projects and the designation of protected areas.
Materials and Methods
Study areas
Study areas consist of the western and southern coastal zones of South Korea, which cover both terrestrial counties and coastal areas (Fig 1). The coastal areas comprise 61 counties with sizes ranging from 3 to 1,006 km2in area. It also contains 27% of the total population of Korea. The average annual temperatures are between 10 and 15°C, and the annual precipitation varies from 1,200 to 1,500 mm in the central region and from 1,000 to 1,800 mm in the southern region [17]. The sea level change between high and low tide is 256 cm (ranging from 73 to 462 cm)[18].
Coastal wetlands in South Korea provide multiple ecosystem services such as fish produc-tion, coastal protecproduc-tion, and recreation to human society, which contribute to local livelihoods and economies [23,24]. About 90% of total fishery licenses are issued in coastal areas, and 92% of fishery households are located in coastal counties [25]. The Korean government has con-ducted large-scale reclamation of coastal ecosystems for agricultural lands, urbanization, and industrial development since 1970s [8]. The urban areas of coastal counties have rapidly increased twice from 561 km2in the 1980s to 1,222 km2in the 2000s [21]; large-scale reclama-tion projects have reclaimed 754 km2of coastal areas since 1982 [26]. The coastal protected areas cover 10,007 km2of South Korea, which is 10% of the land area and 15% of territorial waters of South Korea [27] (Fig 1). Specifically, since over a half of coastal wetlands in South Korea have been reclaimed and developed for urbanization and industrial complexes during the 20th century [2], many remained coastal wetlands locates near urbanized and industrial-ized areas. In the present, the conservation areas of coastal wetlands cover about 10% or 213 km2of the total coastal wetlands (2,487 km2) [27].
The Korean government amended the Coast Management Act in 2009 to achieve effective conservation and sustainable development of coastal areas. In 2011, the Ministry of Land, Transport and Maritime Affairs (the Ministry of Oceans and Fisheries as reconstituted in 2013) established the second integrated coastal management plan for 2011–2021 under the provisions of Article 8 of the Coast Management Act [26]. The objectives of the management plan aim not only to conserve coastal biodiversity but also to provide provisioning and cultural ecosystem services to the human society through ecosystem-based management. The Coast Management Act states that local governments will establish local integrated coastal manage-ment at a county level following the guidelines of the second integrated managemanage-ment plan, and therefore local governments have individualized coastal management authority.
Selection of ecosystem services
Fig 1. Distribution of study areas, protected areas, urban areas and reclaimed areas [Data Source: [19–22]]
wetland reclamation projects have dramatically degraded natural habitat and therefore led to biodiversity loss. The biodiversity loss has a negative impact on several ecosystem services [28]. Thus, we firstly assessed and mapped coastal and terrestrial habitat risks in South Korea as the proxies of biodiversity.
Conservation strategies, especially for strictly protected areas, benefit regulation and cultural services [29], whereas these strategies have restricted the use of provisioning services [30]. The second integrated management plan in South Korea was also established to conserve not only biodiversity but also regulation and cultural services, particularly in coastal areas. Although the decision makers identified the benefits of regulation and cultural services, few ecosystem ser-vice assessments support these strategies. In particular, ecosystem serser-vices research has over-looked the assessments of regulation services because these services are not utilized directly and hard to be quantified [1]. However, they may be the main indicators of regime shift risk, and therefore, it is necessary to assess regulating services at multiple scales [31].
The focus of the spatial assessment was four regulation and cultural ecosystem services (coastal protection, carbon storage, aesthetic values, and recreation) among Marine and Coastal Ecosystem Services (MCES) (Table 1). First, the spatial assessment of risky coastal areas from heavy rainfalls and storms is necessary to identify priority areas for habitat conser-vation or restoration. Coastal counties in South Korea are increasingly exposed to storm-induced flooding and inundation during every summer season [17], and they may be more vul-nerable due to destroying natural habitats that reduce the impact of natural disasters. Second, the spatial distribution of carbon storage helps to implement conservation policy as protected areas where the level of carbon storage is high. The capacity of carbon storage in terrestrial eco-systems largely influence global climate change [32], because the total quantities of carbon stor-age in terrestrial ecosystems are much larger than the quantities of carbon dioxide in the atmosphere [33]. Finally, understanding the distributions of recreational opportunities and scenic amenities in coastal areas is essential for establishing comprehensive coastal manage-ment policy. Recreational activities and local tourist attractions partially influence the regional economy of coastal counties [32], and thus the cultural ecosystem services can increase income in local communities [34].
Additionally, we added the amounts of aquaculture production (in metric tons) as a variable for statistical analyses, because the aquaculture production represents provisioning services in coastal areas, and conservation strategies can directly and indirectly impact provisioning ser-vices. Presently, the fishery resources in South Korea have been quite well regulated under sev-eral conservation acts. Traditionally, fisheries in South Korea are government-owned, and the local communities have formed cooperatives of fishing villages and gained access by obtaining fishery licenses from the government. The Fisheries Act and Fishing Villages and Fishery Har-bor Act have been enacted for increasing the fishery productions and improving the quality of life for fishing workers. The Fishing Ground Management Act and Fish Resources Manage-ment Act also designate restricted fishing areas, the period of the non-fishing season, and length limits to avoid overfishing and achieve sustainable fisheries.
Rationale for the Ecosystem Services Approach
studies should spend enormous time and resources with high costs, while it cannot give general solutions for regional and global challenges such as global climate change [37]. For example, drivers for ecotourism participation in Wolong Nature Reserve of China were positively associ-ated with the high income, education, and low cropland of households [38]. As the drivers for tourism participation is highly dependent on local context, the result is hard to be adopted to different areas.
Specifically, spatial assessment and advanced statistical analysis facilitate to figure out a hid-den relation between human and natural systems, because socioeconomics interact with natu-ral systems and thus impact on the status of biodiversity and ecosystem services [39,40]. Recent studies have sought to combine socioeconomic data with spatial data within coupled human and natural systems [41,42], but many studies separated into spatial assessment and advanced statistical analysis at multiple scales. Mapping ecosystem services performed at global [43,44], regional [45], and local levels [46]. In addition, researchers used advanced statistical analyzes to integrate socioeconomic data with biodiversity and ecosystem services [40,47].
In ecosystem services approach, combining spatial assessment and statistical analysis gives new perspectives in the study areas and helps to develop the regional model of both human and nature dimensions [37]. The result of spatial assessments gives spatial explicit information about biodiversity and ecosystem services and quantified values to evaluate tradeoffs among ecosystem services. The statistical analysis estimates socioeconomic and environmental drivers that may impact on the status of biodiversity and ecosystem services. Thus, the combined approach can answer important questions for ecosystem service assessments that were sug-gested by Seppelt et al. (2011) [48]; biophysical realism, tradeoffs, off-site effects, and stake-holder work. The approach has been mainly adopted to forest ecosystems with remote sensing and GIS [41,42], but not for coastal ecosystems because of data availability and greater research interests in terrestrial ecosystems. In this study, we used the combined approach in coastal ecosystems and dealt with reclamation and protection activities as deforestation and reforestation, respectively.
Data collection
The spatial dataset consisted of geographic, ecological, and social data provided by Korean gov-ernment agencies and institutes [18–22,49]. Geographic data included the Digital Elevation Model (DEM), the county boundaries, and coastline data, and it was used as basic information for ecosystem services assessment. Ecological data consisted of coastal habitats information, seafloor characteristics, and the location of protected and reclaimed areas. Social data involve the locations of industrial complexes, populations per counties, beaches, and recreation fishing points. When raw data was paper or physical data, we converted it to raster or vector formats using digitization and georeferencing. The coordinate system used in this study was WGS 1984 Table 1. The classification of marine and coastal ecosystem services [2,35,36].
Provisioning Regulating and maintenance Cultural
Food provision Water purification Ocean nourishment Symbolic and aesthetic values
Water storage and provision Air quality regulation Life cycle maintenance Recreation and tourism Biotic materials and biofuels Coastal protection Biological regulation Cognitive effects
UTM Zone 52N, and the vector scale was standardized to 1:20,000 and the raster data had a 30-meter resolution.
The database for statistical analyses consisted of demographic, socioeconomic, and biophys-ical data [18,20,21,49]. We also quantified habitat risk assessments and four ecosystem ser-vices at the county level (S1–S4Tables). Demographic data involved the population size, the population density, the number of households, the average family size, and the average age of the population. Socioeconomic data represented the characteristics of each county, such as the appraised value of land, the number of annual tourists, and Gross Regional Domestic Product (GRDP) [50].
Methods
We calculated total protected areas in South Korea: national parks, cultural properties areas, ecological and scenic conservation areas, wildlife protection areas, and coastal wetlands conser-vation areas. The reclaimed areas of each county were estimated by the spatial database [19].
We selected InVEST model for the spatial assessments of coastal habitat risks and ecosys-tem services for two reasons. First, this model is used broadly by lots of research groups in the world such as Indonesia, Colombia, Canada, and China [16,28]. The InVEST model was developed under Natural Capital Project to map and value various ecosystem services in both terrestrial and coastal areas. Second, the InVEST model provides various spatial sub-models particularly for coastal ecosystem services [28]. Thus, by providing spatially explicit and quan-tified outputs, the model specializes for coastal management plan as a scientific assessment tool [28].
Our ecosystem service approach consisted of four parts. First, we mapped the impact of human activities in both terrestrial and coastal areas and identified where human impacts are high. These proxies show the status of environmental degradation and can be used for terres-trial and coastal biodiversity, because habitat degradation significantly increase the possibility of species extinctions and then lead to biodiversity loss [51]. Second, we assessed 4 ecosystem services (two regulating services and two cultural services) by using the InVEST model, which had not been considered during the decision-making process of coastal conservation in South Korea. Then we analyzed potential tradeoffs among ecosystem services and between biodiver-sity and ecosystem services. Finally, we examined how demographic, socioeconomic, and bio-physical factors influence the designation of protected and reclaimed areas at the county level.
Spatial Assessments
Spatial assessments used InVEST (Integrated Valuation of Environmental Services and Trade-offs) version 2.5.6 to assess and quantify habitat risk and ecosystem services in coastal areas [51]. We selected five sub-models: coastal habitat risk assessment, coastal vulnerability model, overlap analysis model (recreation and aesthetic quality), terrestrial habitat quality model, and carbon storage model in terrestrial areas.
consequence are calculated similarly to weighted average,
E¼
XN
i¼1 ei diwi
XN
i¼1
1
diwi
ð1Þ
C¼
XN
i¼1 ci diwi
XN
i¼1
1
diwi
ð2Þ
whereeirepresents the exposure value,cirepresents consequence value,diis the data quality
rank, andwiis the importance weights for each criterioni. N is the number of criteria for each
habitat [51]. Second, the model combines both the exposure and consequence values and pro-duces a risk value (R) for each stressor-habitat combination. The risk value is that stressorj causes risk to habitati, and Rijis quantified using Euclidean Risk calculation [51].
Rij¼
ffiffiffiffiffiffiffiffiffiffiffiffiffiffiffiffiffiffiffiffiffiffiffiffiffiffiffiffiffiffiffiffiffiffiffiffiffiffiffi ðE 1Þ2þ ðC 1Þ2 q
ð3Þ
The third step calculates the sum of risk values for each habitat, andfinally the model assesses and maps the habitats’risk hotspots.
The habitat quality model in terrestrial areas is similar to the HRA model, except that the habitat quality model employs land use and land cover maps instead of habitat layers. The model produces a habitat quality map by integrating LULC information with threats to biodi-versity. The quantification of threats on each habitat in a pixel consists of four factors: 1) the relative impact of each threatr(wr); 2) the distance between habitat and the threat in grid cellx
and y(irxy); 3) the level of legal and physical protection from disturbance (bx); and 4) the rela-tive sensitivity of each habitat to each threat (Sjx) [51]. Then, the model calculates Dxj, the total
threat level in each grid cellx, with habitat typejs.
Dxj¼
XR
r¼1
X
Yr
y¼1 wr
XR
r¼1 wr 0 B B B B @ 1 C C C C A
ryirxybxSjr ð4Þ
The habitat quality model produces a habitat degradation map of the current landscape. To facilitate understanding where coastal areas are vulnerable to human activities, we simply over-lapped coastal and terrestrial habitat risk maps into a single map.
or pixel as follows [52]:
EI¼ ðRGeomorphologyRReliefRHabitatsRSLRRWindExposureRWaveExposureRSurgeÞ
1
7 ð
5Þ
The variables inEq 5are as follows:RGeomorphologyis the rank of geomorphology for each
coastline segment,RReliefis the relief ranking of each coastline segment,RHabitatsis a natural
habitat ranking for each coastline segment,RSLRis the level of net sea level change within the
study site,RWindExposureis the wind exposure ranking of each coastline segment,RWaveExposureis
the average depth of adjacent seas, andRSurgeis the distance ranking between the coastline and
the edge of the continental margin.
Carbon storage model. The carbon storage model estimates the carbon stocks of four car-bon pools: aboveground biomass, belowground biomass, soil organic matter and dead organic matter. Carbon storage data in terrestrial areas collected from national reports in South Korea and IPCC report [53–55] (S3 Table). The amounts of each carbon pool can be collected from preceding research based on land use and land cover types [51]. The model calculated the net amount of carbon storage in terrestrial areas. In this study, we only considered carbon storage without sequestration due to the high degree of uncertainty in estimating sequestration [56].
Overlap Analysis Model. The overlap analysis model allows us to identify the important areas of human use (e.g., recreation and fishing) in marine and coastal areas [28]. The model can assess and map recreation and aesthetic quality in coastal areas. In this study, we deter-mined the spatially explicit information on six common recreational activities: swimming at the beach, sea fishing, fishing village tourism, coastal visitors’center, yachting, and scenic view-ing. In addition, the model presented the areas of high aesthetic quality with scenic viewpoints. The model calculates how many activities exist in each pixel (i) using an Important Score (IS):
ISi¼
1
n
X
i;jUijIj ð6Þ
The variables inEq 6are as follows:nis the number of human activities using the analysis, Uijis the usage of activityjin grid celli, and Ijis the inter-activity weight of activityj[51].
Verification of the Spatial Assessments
To verify the accuracy of spatial assessments, we compared the spatial results with existing datasets in coastal areas provided by Korean governments and institutes. They provided the ecological grading system of coastal wetlands (7 grades) [57], the estimates of typhoon damages (5 grades) [57], the status of coastal recreation and tourism (3 grades) [19], and ecological zon-ing map in terrestrial areas (3 grades) [21]. In all grading systems, lower grade means a better status. Since the existing datasets were either continuous data or ranking data, we performed both Pearson correlation analysis (R) for continuous data and Spearman correlation analysis (ρ) for ranking data in R statistical software [58]. If the results of the spatial assessments
posi-tively correlate with the existing datasets, we can say that the spatial assessments achieve an accuracy and reliability.
assessments to each county. As the basic spatial unit for all statistical analyzes in this study (‘Statistical Analysis’in methods) is a coastal county, the verification process at a county level is reasonable. Then, coastal vulnerability result was compared to the grades of typhoon dam-ages. Also, we compared the results of recreation and aesthetic quality with the grades of coastal recreation and tourism. Finally, the ecological zoning maps represented the quality of terres-trial ecosystems [21]. We summed the areas (km2) of the first grade (high ecological quality) and protected areas and aggregated the results of the results of terrestrial habitat quality and carbon storage at each county. Then, we compared the total areas with the results of the habitat quality and carbon storage.
Statistical Analysis
We performed correlation analysis between habitat risk assessments and ecosystem services and among services. The analysis was performed on each pair of two habitat risk assessments and four ecosystem services. We determined the relations of their associations and identified potential tradeoffs between habitat risk and ecosystem services using R statistical software [58].
Firstly, using zonal statistics tools in ArcGIS 10.1, coastal and terrestrial habitat assessments and four ecosystem services were quantified from the spatial assessments at each county [59]. In this quantification, coastal and terrestrial habitat risk assessments, coastal vulnerability, and terrestrial carbon storage were represented as average numeric values for each county. Recreation was represented as the number of recreational sites, and aesthetic quality was calcu-lated as the number of scenic points per county. We quantified the number of recreation spots and aesthetic quality for each county. The areas of two cultural services cannot represent the intensity at a county level, because the areas of each county vary from 3 km2to 1006 km2.
Then, we divided coastal counties into two groups: conservation-dominated and reclama-tion dominated-counties. As most counties in South Korea have focused on one side of the debate, either conservation or development due to county circumstances, we divided the coun-ties into two groups. Potential differences in the level of habitat risks and the provision of four services were assessed between the two groups using a way ANOVA. Also, we used a one-way ANOVA to determine if several factors—including demographic, socioeconomic, and bio-physical determinants—are different between the two groups. The ANOVA assumptions (homoscedasticity and normality) were verified, and log transformations were carried out as needed.
We fitted two generalized linear models. First, we used the Poisson distribution for GLM with log-link function, but over-dispersion occurred in the Poisson regression model. To address over-dispersion, we selected the Negative binomial distribution that is used to model count response data without the assumption that the variance equals the mean. Negative Bino-mial regression models wrote in the following Eqs7and8,
lnðY1Þ ¼b0þb1X1þb2X2þb3X3þb4X4þb5X5þb6X6þb7X7þb8X8þb9X9þb10X10 ð7Þ
lnðY2Þ ¼b0þb1X1þb2X2þb3X3þb4X4þb5X5þb6X6þb7X7þb8X8þb9X9þb10X10 ð8Þ
Whereβis are the parameters to be estimated by Maximum Likelihood (ML) method. The vari-ables inEq 7are as follows. Y1is protected areas, Y2is reclaimed areas, X1is population of
coastal counties, X2is population density, X3is the number of households, X4is the average
number of household members, X5is the average age of population, X6is the appraisal value of
land, X7is Gross Regional Domestic Product, X8is the number offishery households, X9is the
number of tourists, and X10is the median slope within a kilometer radius of coastline (S5
To select the best model from the initial model, we removed non-significant predictors by using Akaike Information Criterion (AIC) and the ration of the Deviance (or Pearson Chi-square) to DF. If the sub model had the lowest AIC and the ration of the Deviance to DF was close to 1, we stopped. Because AIC is a measure of goodness of model fit, a smaller value of AIC represents a better model fit. In addition, the ratio of the Deviance to DF should be close to 1, when the model is a good fit for the data. To avoid multicollinearity problems, we checked whether the largest Condition Index (CI) in all models is greater than 10. As a result, there was no evidence of multicollinearity in the final models. All statistical analyses were performed using R and SAS 9.2 [58,60].
Results
Spatial Assessments
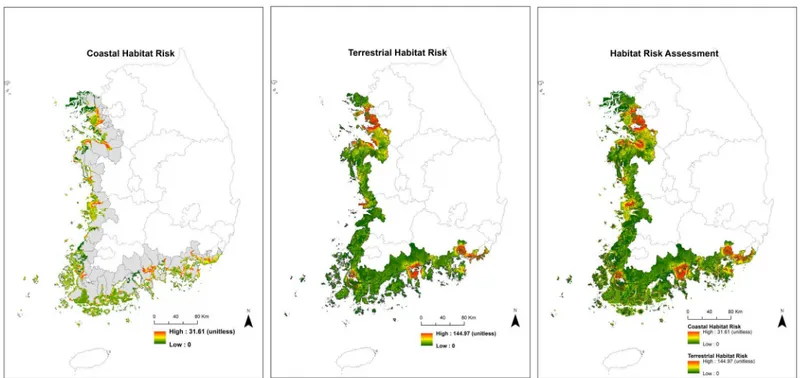
The coastal and terrestrial habitat risk assessments in the study area are shown inFig 2. The distribution of the values of habitat risks was different among the counties. The habitat condi-tions seriously deteriorate in urbanized areas such as Incheon and Busan, but most counties in the southwest are under low levels of habitat risk. The values of coastal habitat risk strongly correlate with terrestrial habitat conditions. For example, reclaimed areas particularly lead to the degradation of natural habitats in adjacent terrestrial and coastal counties (Figs1and2). The maps represent the intensities of several threats to natural habitats, while the habitat risk assessments signify the status of environmental degradation.
Fig 3exhibits four ecosystem services: coastal vulnerability, carbon storage, recreation, and aesthetic quality. The spatial distribution of each ecosystem service is distinctly different throughout the coastal counties. By mapping coastal vulnerability, we identify the locations of low or high vulnerability. The west coast of Korea is more vulnerable to climate change and inundations than the south coast. The map of terrestrial carbon storage displays the location of high quantities of carbon storage. According to the map, the western counties are associated with low levels of carbon storage, whereas the most southern counties have the high levels of carbon storage. Northwestern counties are located near Seoul (the capital of South Korea), and they have rapidly developed for urbanization and industrialization under national policies. Southwestern counties have reclaimed coastal wetlands as large-scale reclamation projects (e.g., Saemangeum project) to stimulate the regional economy in a short period. Thus, western counties have deteriorated natural habitats and led to the low levels of carbon storages. How-ever, national economic policies have not considered southern counties for the development, as the counties are traditionally agricultural and fishing areas.
Maps of recreation and aesthetic represent the number of recreational sites and visual impacts in the study area. The number of recreational sites indicates the intensity of human recreational uses in the coastal areas, and the aesthetic quality map demonstrates the specific areas of aesthetic appreciation. The locations of high recreational sites and aesthetic quality are evenly distributed across the counties. Many counties are generally of high value to multiple services with good habitat conditions (Fig 3). However, Busan, the second largest metropolis in South Korea, has undergone a high level of habitat risk due to anthropogenic impacts, but the county still provides much recreation and aesthetic quality (Figs2and3).
We performed correlation analysis to verify the accuracy of the spatial assessments (see
methods). Coastal habitat risk assessment was negatively associated with species diversity (ρ=
-0.158), habitat diversity (ρ= -0.346), and ecological health (ρ= -0.112). The coastal
vulnera-bility was positively associated with the grades of typhoon damages (ρ= 0.297). While
counties had more recreation spots from the recreation assessment, they also tended to have a higher status (lower grade) for coastal recreation and tourism, estimated by the Korean govern-ment. However, counties with a higher aesthetic quality tended to have a lower status (higher grade) for recreation and tourism. The grades of coastal recreation and tourism published by the Korean government considered a direct human use only such as sea bathing or recreational fishing. Thus, the grade systems may not reflect the values of viewpoints located in pristine areas where aesthetic values are high but direct human usage is minimal. Therefore, counties with high aesthetic quality tended to have a low status of coastal recreation and tourism. In addition, the areas (km2) of the first grade of ecological zoning map and protected areas were positively associated with total carbon storage (R = 0.594) and negatively associated with ter-restrial habitat risk (R = -0.580). All correlation results had a significant P-value (P<0.05).
Synergies and tradeoffs of habitat risk and ecosystem services
Most of the habitat risks and ecosystem services significantly correlate with one another (Table 2). We found significant positive relations between cultural services and between habitat risks: recreation and aesthetic quality are strongly correlated (r = 0.7–0.9), and coastal habitat risk and terrestrial habitat risk are also moderately correlated (r = 0.4–0.6). In particular, the coastal habitat risk is negatively correlated with regulation and cultural services and the terrestrial habitat risk is also negatively correlated with them except for coastal vulnerability (P<0.01). Aquaculture productions are insignificant with both coastal and terrestrial habitat
risk, while aquaculture productions are positively correlated with regulation and cultural ser-vices. Furthermore, carbon storage is positively correlated with cultural services, i.e., recreation and aesthetic quality.
The results of the t-test are presented inTable 3. The statistical results show that there are sig-nificant differences in the values of the habitat risks and four ecosystem services (aquaculture, Fig 2. Maps of habitat risk assessments in terrestrial and coastal areas in South Korea. Feature values on maps refer as continuous values from poor (red) to good (green) conditions.
Fig 3. Ecosystem services assessments of coastal areas in South Korea.Feature values of coastal vulnerability and terrestrial carbon storage are expressed in continuous values from poor (purple) to good (green) conditions. In addition, recreation and aesthetic quality are classified as low, moderate, high, or very high.
carbon storage, recreation, and aesthetic quality) between reclamation-dominated and conser-vation-dominated counties. The intensities of terrestrial and coastal habitats are significantly greater in the reclamation-dominated counties (P<0.01). In contrast, aquaculture productions
and the numbers of recreation activities and aesthetic quality are significantly larger in the con-servation-dominated counties (P<0.01). While the carbon storage of regulation services is
sig-nificantly higher in the conserved counties, coastal vulnerability is not different between the two groups.
Social and ecological impacts on the designation of conservation and
reclamation
A comparison of the demographic, socioeconomic, and biophysical predictors between conser-vation-dominated counties and reclamation-dominated counties is shown inTable 4. The rec-lamation-dominated counties are significantly larger than conservation-dominated counties in Table 2. Pearson’s correlation analysis between habitat risk assessments and ecosystem services.
Variable Habitat Risk Provisioning Regulating Cultural
Coastal habitat risk
Terrestrial habitat risk
Aquaculture Coastal vulnerability
Carbon storage
Recreation Aesthetic quality
Coastal habitat risk 1 Terrestrial habitat risk
0.502** 1
Aquaculture -0.149 -0.240 1
Coastal vulnerability
-0.437** -0.141 0.099 1
Carbon storage -0.346** -0.515** 0.278* 0.177 1
Recreation -0.351** -0.453** 0.648** 0.176 0.448** 1
Aesthetic quality -0.257 -0.394** 0.539** 0.189 0.338* 0.801** 1
*P<0.05, **P<0.01
doi:10.1371/journal.pone.0133856.t002
Table 3. Ecosystem Services Characteristics of reclamation-dominated and conservation-dominated counties.
Independent variable Reclamation† Conservation‡ F-test¶ Adjusted T-test§
(n = 34) (n = 25)
Coastal habitat risk 5.57 (2.39) 3.09 (1.71) 19.56** -4.65**
Terrestrial habitat risk 120.6 (74.43) 46.02 (38.58) 20.93** -5.00**
Aquaculture 59.32 (180.27) 1683.48 (3493.99) 5.64* 2.73*
Coastal vulnerability 4.13 (2.14) 4.43 (1.15) 0.4 0.67
Carbon storage 65.39 (27.23) 90.49 (16.01) 16.89** 4.43**
Recreation 200.81 (177.72) 513.9 (374.1) 14.32** 4.43**
Aesthetic value 1,278.55 (1,432.79) 2,609.48 (2,761.83) 4.69** 2.30**
†
Means and Standard Deviance (in parentheses) of reclamation-dominated counties. ‡
Means and Standard Deviance (in parentheses) of conservation-dominated counties.
¶F-statistics is testing variance equality of reclamation-dominated or conservation-dominated counties. §Adjusted t-test is used when the variances are not equal.
*P<0.05, **P<0.01
population, population density, household, family size, appraised value of land, and GRDP (P<0.01). On the contrary, the reclaimed counties are significantly smaller in the average age of population, fishery households, and median slope of coastline (P<0.05) (S6 Table).
Two generalized linear models revealed a significant association between socioeconomic/ biophysical factors and reclaimed or protected areas at a county level (Table 4). The model for protected areas has a positive association with protected areas with population, fishery house-holds, and biophysical slope (P<0.05), but have a negative association with the number of
households and land values (P<0.01). The most significant factors associated with conserva-tion are demographic factors and land values. The model for reclaimed areas has a positive association with reclaimed areas with GRDP (P<0.01), while the model has a negative associa-tion with land values and biophysical slope (P<0.01). The most significant factors with
recla-mation are economic and biophysical characteristics.
Discussion
In this study, the ecosystem services approach that combines spatial assessment with statistical analysis provided spatially explicit information on habitat risks and ecosystem services along with synergies and tradeoffs among habitat risks and ecosystem services. Additionally, we determined drivers on the designation of reclamation projects or conservation policies by using a generalized linear model. We showed how demographic, socioeconomic, and biophysi-cal factors associated with the designation of reclamation and conservation areas at the county level. Thus, the approach can provide scientific evidence that previous studies have not treated for a decision-making process in coastal managements. Also, the benefit of the approach is to spend no additional cost, because the necessary data has been established and verified by Korean governments. Indeed, the approach is available to adopt immediately in coastal areas where it need to analysis for development or conservation.
Our results indicated that reclamation of coastal wetlands has severely reduced biodiversity and their ecosystem services. The statuses of biodiversity and associated ecosystem services in conservation-dominated counties were quantitatively better than reclamation-dominated counties. Previous studies suggested that coastal wetland reclamation leads to degrade ecologi-cal health and biodiversity in coastal areas [7,8]. Furthermore, we showed that reclamation deteriorated regulating and cultural ecosystem services and decreased the benefits of the ser-vices to human societies.
The Status and Potential Risks of Coastal Areas
Spatially mapped ecosystem services can be used to select possible development sites (e.g., for industrialization or urbanization) that minimize degradation of ecosystem services [61,62]. In addition, the spatial assessments allow decision makers to prioritize the areas that should be included in conservation programs to protect from potential development [43,63]. In particu-lar, ocean national parks in South Korea have preserved their habitats in excellent condition and seem to have high biodiversity than those areas outside of protected areas (Figs1and2). Even though Busan has undergone severe habitat risk and biodiversity loss in both terrestrial and coastal areas, the areas still provide extremely high aesthetic quality and multiple recrea-tion activities. The levels of coastal and terrestrial habitat risks have a negative impact on coastal vulnerability, carbon storage, recreation, and aesthetic quality, indicating that develop-ment projects degrade and change the status of cultural services. Therefore, many recreational activities and high aesthetic quality in Busan may deteriorate in the near future.
Provisioning services are affected by habitat conditions and regulation services [64], and also influence cultural services by forming tradeoffs among them [65]. In this study, aquacul-ture activities are negatively correlated to cultural ecosystem services. Since aquaculaquacul-ture activi-ties cause the degradation of both coastal and terrestrial habitats by using intensified feeds and facilities, the correlation between aquaculture and habitat risks is not significant (Table 2). The coastal fishery of South Korea largely divides into two categories: adjacent waters fisheries and shallow sea cultures. While the production of shallow sea cultures have dramatically raised from 772,731 metric tons in 1990 to 1,515,210 metric tons in 2013, the fishery production of adjacent waters fisheries have decreased from 1,471,810 metric tons in 1990 and 1,044,697 Table 4. Negative binomial model results for conservation-dominated and reclamation-dominated counties.
Independent variable Protected Area (ha) Reclaimed Area (ha)
Model1 Model4 Model2 Model5 Model8
Constant 6.13*(3.38) 8.03***(0.62) 11.23***(2.40) 8.60***(0.54) 8.45***(0.57) Population, 1000 persons 0.067**(0.033) 0.076***(0.026) -0.053**(0.023) -0.042*(0.024) Population density, 100 persons/m2 -0.009 (0.013) -0.017*(0.009) -0.018***(0.004)
Household, 100 families -0.018*(0.009) -0.021***(0.007) 0.014**(0.007) 0.012*(0.007)
Average age 0.033 (0.063) -0.058 (0.046)
Land value, thousand won/m2 -0.006
***(0.002) -0.008***(0.001) -7.3e-4 (0.002) -2.9e-3***(0.001) GRDP, billion won -1.4e-4*(0.000) -1.3e-4*(0.000) 1.3e-4*(0.000) 7.4e-5**(0.000) 1.9e-4***(0.000) Fishery households, 10 families 0.008***(0.003) 0.008***(0.003) 0.003 (0.002) 0.002 (0.002) 0.003 (0.002) Tourist, 1000 persons -3e-5 (0.000) -4e-5 (0.000) 1.3e-6 (0.000) 3.5e-5 (0.000) 1.8e-5 (0.000) Slope, degree 0.375***(0.141) 0.356**(0.141) -0.395***(0.102) -0.331***(0.103) -0.385***(0.100)
Dispersion 1.640 1.652 1.127 1.223 1.233
AIC 925.30 921.80 974.01 971.63 976.20
Pearson Chi-square 52.048 51.416 57.457 56.445 48.458
DF 45 47 45 49 47
Deviance/DF 1.157 1.094 1.277 1.152 1.031
p-value 0.219 0.305 0.101 0.217 0.414
Condition Index 142.724 8.216 142.724 6.656 8.216
*P<0.10, **P<0.05, ***P<0.01.
metric tons in 2013 [49]. Most aquaculture facilities are located on the southwest coast of South Korea due to good habitat conditions. The increases of the facilities can negatively impact the aesthetic amenities [28], as the aesthetic quality of this area is very high. If sufficient information had been available regarding tradeoffs among ecosystem services or between bio-diversity and ecosystem services, the impact of several threats could have been reduced by com-pensating a loss in one service (e.g., food provision) with gains in another service (e.g.,
aesthetic values) through conservation strategies [48].
Coastal Conservation Strategies
Consideration of spatial scale differences between an ecological scale and an institutional scale is crucial for implementing conservation strategies [56]. An ecological scale indicates that bio-diversity and ecosystem services are supplied, and an institutional scale is a basic unit for implementing a management plan [3]. In South Korea, reclamation projects and conservation policies have implemented and performed at the county level, as local governments have prior-ity to establish and implement coastal management plans according to the Coast Management Act. These policies have caused change not only to natural systems but also to human society. For example, protected areas prevent the extraction of provisioning ecosystem services and the restrict development [30]. On the other hand, local people of reclaimed areas are forced to immigrate to other sites, because the reclamation has permanently destroyed natural habitats necessary for fisheries [66]. The comprehensive involvement of social and ecological character-istics within conservation strategies could minimize the conflicts between conservation and development aims [67]. Within this context, our results show that the status of habitat risks and ecosystem services are distinctively different between conservation-dominated and recla-mation-dominated counties (Table 3). Protected counties sustain better habitat conditions and higher levels of ecosystem services than reclaimed counties. Furthermore, the status of coastal vulnerability is not significantly different between conservation and reclamation-dominated counties (Table 3). This suggests that artificially constructed structure and natural habitats in estuaries may play a similar role in protecting coastal zones. Most urban areas are well pro-tected from coastal disasters such as storms and floods by constructing horizontal levees, while these areas have few recreational spots compared to protected areas.
The reclamation and conservation policies also influence social and biophysical characteris-tics at a county level. Our ANOVA results show that local society and natural environments may be of relevance for the designations of the conservation and development policies (Tables
quality during the selection process. To establish comprehensive conservation strategies in coastal areas, decision-makers need to overcome this trend.
If future research confirms a causal relationship between socioeconomic characteristics and the designation of reclamation projects or conservation policies, the coefficient estimates in
Table 4may be used to predict the designation of protected areas or reclaimed areas for differ-ent biophysical and socioeconomic predictors. For example, larger population and fishery households lead to greater protected areas and lower reclamation at the county level; while greater households and GRDP led to lower protection and greater reclamation and the appraised value of land is negatively related to both the designation of conservation and selec-tion of reclamaselec-tion areas. Also, areas with steeper slopes in coastal counties are more likely to be designated as a conservation area and areas with flatter slopes are more likely to be selected as reclamation projects (Table 4). As predicted by the model, if the population increases by ten thousand, households increase by 3000, and other predictors are constant in Geoje-si, then the area of conservation is predicted to 27,270 ha (originally 18,583 ha) and the area of reclamation is predicted to be 849 ha (originally 1,571 ha). Therefore, we can expect that there may no lon-ger be reclamation projects in Geoje-si.
As seen inFig 1, the locations of protected areas in coastal zones depart from urbanized areas. The protected areas in South Korea provide high biodiversity and multiple ecosystem services as a result of the conservation purposes (Figs2and3,Table 3), but outside of protected areas there is no legal basis to restrain effectively development and reduce the degradation of environmental conditions from human activities. Since cultural services (recreational activities and aesthetic quality) distribute evenly throughout the coastal areas of South Korea, even in highly urbanized areas, employing cultural services can support coastal conservation and sus-tainable development outside of protected areas [46]. Indeed, cultural ecosystem services are used explicitly by humans and generate benefits for local communities [68]. The benefits have strongly motivated local people to maintain natural habitats and related ecosystem services by owning, managing, and conserving areas [69], as the cultural services are provided by biodiver-sity and are sometimes linked with provisioning ecosystem services at a regional level [3].
Future Works
Natural habitats and ecosystem services are to change and transform over time with human activities. As such, the construction of scenarios that reflect coastal planning zone systems is necessary to implement effectively conservation policy and predict the impacts of policy by using the ecosystem services approach [70]. This study did not explore time-series but rather focused on the period around 2010, so the results cannot anticipate spatial changes in biodiver-sity and ecosystem services over time. Further studies should employ more advanced spatial models to estimate the spatial variation of biodiversity and ecosystem services by altering inputs in accordance with management scenarios. Investigating tradeoffs among scenarios or between temporal scales would enable decision makers to maximize the quality and quantity of ecosystem services [71,72].
assessments for the spatial models. For example, researchers collected soil samples in coastal wetlands and performed field and laboratory experiments to figure out the sediment biogeo-chemistry of coastal habitats [57]. Using the biogeochemical results, researchers graded the sta-tus of biodiversity and ecological health at each sample points. Then, we compared the coastal grades from field works with the result of coastal habitat risk assessment.
Second, sociological field works based on surveys and interviews help to construct an accu-rate statistical model [37]. To increase the efficiency of the field works, researchers can use the results of existing models. For example, we can calculate the errors in the models as a difference between the actual values of protected or reclaimed areas and the predicted values from the generalized linear models in each county (Table 4). By identifying positive and negative outli-ers, we can select specific counties where need to collect additional information from the field works. The information helps to figure out necessary variables to improve the accuracy of the statistical models. As followed this process, researchers will focus on the outlier counties for the field works, not all counties. Thus, they can save time and resources during the studies.
The ecosystem services approach in this study provided opportunities to constitute guide-lines for conservation and sustainable development of biodiversity and ecosystem services. We assessed the relative risk of human activities and regulation and cultural services in coastal areas. The results of the statistical analyses provide synergies and tradeoffs among services and between habitat risks and services. Additionally, social and ecological characteristics in the uni-fied spatial scale correlated with the designation of reclamation and conservation areas. We expect that the findings can help decision makers determine priority areas for conservation outside of protected areas.
China and other south-Asia countries have followed similar economic development model to South Korea; import substitution industrialization in heavy industry, governmental control over finance and support for enterprises, dependence on export markets [74]. Therefore, rapid developments in coastal areas of South Korea is spreading to East-Asian and southern Asian countries where have experienced rapid economic growths for last decade [5]. For example, China has reclaimed coastal wetlands 60,000 ha per year from 2010 to 2020 for infrastructure development [5]. Thus, this study will provide a valuable perspective to achieve both sustain-able development and conservation in Asia countries.
Supporting Information
S1 Table. The types and protective distance of coastal habitats and recreational activities (DOCX)
S2 Table. The threats and‘the maximum distance of each threat effect’on habitat quality
(DOCX)
S3 Table. Estimates of carbon storage (MgC/ha) in four carbon pools (aboveground bio-mass, belowground biobio-mass, soil organic matter and dead organic matter) associated with land use and land change type
(DOCX)
S4 Table. Land use and land cover type and sensitivity of LULC types to each threat (DOCX)
S5 Table. Variables in the negative binomial model for areas of conservation and reclama-tion at county level
S6 Table. Socioeconomic and biophysical characteristics of reclamation-dominated and conservation-dominated counties
(DOCX)
Author Contributions
Conceived and designed the experiments: MGC HK. Performed the experiments: MGC SC. Analyzed the data: MGC HK SC. Contributed reagents/materials/analysis tools: MGC HK SC. Wrote the paper: MGC HK SC.
References
1. TEEB. The Economics of Ecosystems and Biodiversity: Mainstreaming the Economics of Nature: A synthesis of the approach, conclusions and recommendations of TEEB. Malta: Progress Press; 2010. 2. MA. Ecosystems and human well-being: synthesis. Washington, DC: Island Press; 2005.
3. García-Nieto AP, García-Llorente M, Iniesta-Arandia I, Martín-López B. Mapping forest ecosystem ser-vices: from providing units to beneficiaries. Ecosystem Services. 2013; 4(0):126–38. doi:10.1016/j. ecoser.2013.03.003
4. UNEP. Marine and coastal ecosystems and human well-being: A synthesis report based on the findings of the Millennium Ecosystem Assessment: UNEP; 2006.
5. Ma Z, Melville DS, Liu J, Chen Y, Yang H, Ren W, et al. Rethinking China's new great wall. Science. 2014; 346(6212):912–4. doi:10.1126/science.1257258PMID:25414287
6. Costanza R, de Groot R, Sutton P, van der Ploeg S, Anderson SJ, Kubiszewski I, et al. Changes in the global value of ecosystem services. Global Environmental Change. 2014; 26(0):152–8. doi:10.1016/j. gloenvcha.2014.04.002
7. Wang X, Chen W, Zhang L, Jin D, Lu C. Estimating the ecosystem service losses from proposed land reclamation projects: A case study in Xiamen. Ecological Economics. 2010; 69(12):2549–56. doi:10. 1016/j.ecolecon.2010.07.031
8. Hong SK, Koh CH, Harris RR, Kim JE, Lee JS, Ihm BS. Land use in Korean tidal wetlands: Impacts and management strategies. Environmental Management. 2010; 45(5):1014–26. doi: 10.1007/s00267-006-0164-3PMID:18523822
9. Koh CH, Ryu JS, Kwon BO. A comparative study on policy and management of the Wadden sea and Korean getbol. Ministry of Land, Transport and Maritime Affairs, 2009.
10. Cochard R, Ranamukhaarachchi SL, Shivakoti GP, Shipin OV, Edwards PJ, Seeland KT. The 2004 tsunami in Aceh and Southern Thailand: A review on coastal ecosystems, wave hazards and vulnera-bility. Perspectives in Plant Ecology, Evolution and Systematics. 2008; 10(1):3–40.
11. Zhao B, Kreuter U, Li B, Ma Z, Chen J, Nakagoshi N. An ecosystem service value assessment of land-use change on Chongming Island, China. Land Use Policy. 2004; 21(2):139–48. doi:10.1016/j. landusepol.2003.10.003
12. Ingram J, Redford K, Watson J. Applying ecosystem services approaches for biodiversity conservation: Benefits and challenges. Sapiens. 2012; 5(1).
13. Dudley N. Guidelines for applying protected area management categories: IUCN; 2008. 14. Rees SE, Rodwell LD, Searle S, Bell A. Identifying the issues and options for managing the social
impacts of Marine Protected Areas on a small fishing community. Fisheries Research. 2013; 146 (0):51–8. doi:10.1016/j.fishres.2013.04.003
15. Liu JG, Dietz T, Carpenter SR, Alberti M, Folke C, Moran E, et al. Complexity of coupled human and natural systems. Science. 2007; 317(5844):1513–6. doi:10.1126/science.1144004
ISI:000249467900031. PMID:17872436
16. Kareiva P, Tallis H, Ricketts TH, Daily GC, Polasky S. Natural capital: theory and practice of mapping ecosystem services: Oxford University Press; 2011.
17. KMA. Annual climatological report. Korea Meteorological Administration, 2011.
18. KHOA. Calculating devation tablehttp://www.khoa.go.kr:Korea Hydrographic Oceanographic Adminis-tration; 2013 [cited 2014 19, June].
20. Korea Statistics. Statistical Geographic Information Servicehttp://sgis.kostat.go.kr/:Korea Statistics,; 2014 [cited 2014 22 January].
21. Ministry of Environment. Environment Geographic Information Systemhttp://egis.me.go.kr/:Ministry of Environment; 2014 [cited 2014 22 June].
22. MLTM. National Spatial Information Clearinghousehttps://www.nsic.go.kr/:MLTM; 2013 [cited 2014 22 January].
23. MLTM. The management of coastal wetland conservation policy: Ministry of Land, Transport and Mari-time Affairs; 2008.
24. Kim J. Fishing communites sociology in Korea: Minsokwon; 2010.
25. Korea Statistics. Census of Agriculture, Forestry and Fisheries. Daejeon, South Korea: Korea Statis-tics; 2010.
26. MLTM. The second integrated coastal management plan. Ministry of Land, Transport and Maritime Affairs, 2011.
27. Korea Statistics. Korea statistical yearbook. Daejeon, South Korea: Korea Statistics; 2013. 28. Sharp R, Tallis HT, Ricketts T, Guerry AD, Wood SA, Chaplin-Kramer R, et al. InVEST User's Guide.
The Natural Capital Project, Stanford: 2014.
29. Dudley N, Higgins-Zogib LH, Hockings M, MacKinnon K, Sandwith T, Solton S. National parks with ben-efits: how protecting the planet’s biodiversity also provides ecosystem services. Solutions. 2011; 2 (6):87–95.
30. Willemen L, Drakou EG, Dunbar MB, Mayaux P, Egoh BN. Safeguarding ecosystem services and liveli-hoods: Understanding the impact of conservation strategies on benefit flows to society. Ecosystem Ser-vices. 2013; 4(0):95–103. doi:10.1016/j.ecoser.2013.02.004
31. Bennett EM, Peterson GD, Gordon LJ. Understanding relationships among multiple ecosystem ser-vices. Ecology Letters. 2009; 12(12):1394–404. doi:10.1111/j.1461-0248.2009.01387.xPMID: 19845725
32. Tallis HT, Ricketts T, Guerry AD, Wood SA, Sharp R, Nelson E, et al. InVEST 2.3.0 user's guide: inte-grated valuation of ecosystem services and tradeoffs. The Natural Capital Project, Stanford, 2011. 33. Lal R. Soil carbon sequestration impacts on global climate change and food security. Science. 2004;
304(5677):1623–7. PMID:15192216
34. Sander HA, Polasky S. The value of views and open space: estimates from a hedonic pricing model for Ramsey County, Minnesota, USA. Land Use Policy. 2009; 26(3):837–45.
35. Hanines-Yong R, Potschin M. Common International Classification of Ecosystem Services (CICES): Consultation on Version 4, August-December 2012. Nottingham: European Environmental Agency, 2013.
36. Liquete C, Piroddi C, Drakou EG, Gurney L, Katsanevakis S, Charef A, et al. Current status and future prospects for the assessment of marine and coastal ecosystem services: a systematic review. PLoS ONE. 2013; 8(7):e67737. doi:10.1371/journal.pone.0067737PMID:23844080
37. Liverman D, Moran EF, Rindfuss RR, Stern PC. People and pixels: linking remote sensing and social science. 1998.
38. Liu W, Vogt CA, Luo J, He G, Frank KA, Liu J. Drivers and Socioeconomic Impacts of Tourism Partici-pation in Protected Areas. PLoS ONE. 2012; 7(4):e35420. doi:10.1371/journal.pone.0035420PMID: 22558149
39. Liu J, Mooney H, Hull V, Davis SJ, Gaskell J, Hertel T, et al. Systems integration for global sustainabil-ity. Science. 2015; 347(6225). doi:10.1126/science.1258832
40. Liu J, Dietz T, Carpenter SR, Folke C, Alberti M, Redman CL, et al. Coupled human and natural sys-tems. Science. 2007; 36(8):639–49.
41. DeFries RS, Rudel T, Uriarte M, Hansen M. Deforestation driven by urban population growth and agri-cultural trade in the twenty-first century. Nature Geosci. 2010; 3(3):178–81.http://www.nature.com/ ngeo/journal/v3/n3/suppinfo/ngeo756_S1.html.
42. Yackulic CB, Fagan M, Jain M, Jina A, Lim Y, Marlier M, et al. Biophysical and Socioeconomic Factors Associated with Forest Transitions at Multiple Spatial and Temporal Scales. Ecology and Society. 2011; 16(3). doi:10.5751/ES-04275-160315
43. Maes J, Egoh B, Willemen L, Liquete C, Vihervaara P, Schägner JP, et al. Mapping ecosystem services for policy support and decision making in the European Union. Ecosystem Services. 2012; 1(1):31–9. doi:10.1016/j.ecoser.2012.06.004
45. Chan KMA, Shaw MR, Cameron DR, Underwood EC, Daily GC. Conservation planning for ecosystem services. PLoS Biol. 2006; 4(11):e379. doi:10.1371/journal.pbio.0040379PMID:17076586
46. Plieninger T, Dijks S, Oteros-Rozas E, Bieling C. Assessing, mapping, and quantifying cultural ecosys-tem services at community level. Land Use Policy. 2013; 33(0):118–29. doi:10.1016/j.landusepol. 2012.12.013
47. Hope D, Gries C, Zhu W, Fagan WF, Redman CL, Grimm NB, et al. Socioeconomics drive urban plant diversity. Proceedings of the National Academy of Sciences. 2003; 100(15):8788–92. doi:10.1073/ pnas.1537557100
48. Seppelt R, Dormann CF, Eppink FV, Lautenbach S, Schmidt S. A quantitative review of ecosystem ser-vice studies: approaches, shortcomings and the road ahead. Journal of Applied Ecology. 2011; 48 (3):630–6. doi:10.1111/j.1365-2664.2010.01952.x
49. Korea Statistics. Korean Statistical Information Servicehttp://kosis.kr/:Korea Statistics,; 2014 [cited 2014 22 January].
50. Korea Statistics. Understanding statistical concepts and terminology. Korea Statistics, 2010.
51. Tallis HT, Ricketts T, Guerry AD, Wood SA, Sharp R, Nelson E, et al. InVEST 2.5.6 User's Guilde. The Natural Capital Project, Stanford, 2013.
52. Gornitz V. Vulnerability of the East Coast, USA to future sea level rise. Journal of Coastal Research. 1990; 9:201–37.
53. Eggleston S, Buendia L, Miwa K, Ngara T, Tanabe K. IPCC guidelines for national greenhouse gas inventories. Institute for Global Environmental Strategies, Hayama, Japan. 2006.
54. Hwang SI, Myeong SJ, Cho KJ, An JY. Low carbon land-use planning strategies with consideration for the role of carbon sinks such as begetation and soil (2). Korea Environment Institute, 2010.
55. Hong SY, Minasny B, Zhang YS, Kim YH, Jung KH, editors. Digital soil mapping using legacy soil data in Korea2010: International Union of Soil Sciences (IUSS), c/o Institut für Bodenforschung, Universität für Bodenkultur.
56. Chan KMA, Shaw MR, Cameron DR, Underwood EC, Daily GC. Conservation planning for ecosystem services. PLoS Biology. 2006; 4(11):e379. doi:10.1371/journal.pbio.0040379PMID:17076586
57. MOF. The National Survey of Coastal Wetlands: Basic Investigation. Ministry of Oceans and Fisheries, 2014.
58. R Core Team. R: A Language and Environment for Statistical Computing. Vienna, Austria: R Founda-tion for Statistical Computing; 2013.
59. ESRI. ArcGIS Desktop: Release 10.1. Redlands, CA: Environmental Systems Research Institution; 2012.
60. SAS Institute Inc. SAS/STAT 9.2 User's Guide. Cary, NC: SAS Institute Inc.; 2008.
61. Lester SE, McLeod KL, Tallis H, Ruckelshaus M, Halpern BS, Levin PS, et al. Science in support of ecosystem-based management for the US West Coast and beyond. Biological Conservation. 2010; 143(3):576–87. doi:10.1016/j.biocon.2009.11.021
62. McLeod K, Leslie H, Aburto M, Alessa L, de los Angeles Carvajal M, Barr B, et al. Ecosystem-Based Management for the oceans. Washington, DC: Island Press; 2009.
63. Petter M, Mooney S, Maynard SM, Davidson A, Cox M, Horosak I. A Methodology to Map Ecosystem Functions to Support Ecosystem Services Assessments. Ecology and Society. 2013; 18(1). doi:10. 5751/ES-05260-180131
64. Power AG. Ecosystem services and agriculture: tradeoffs and synergies. Philosophical Transactions of the Royal Society B: Biological Sciences. 2010; 365(1554):2959–71. doi:10.1098/rstb.2010.0143
65. Kareiva P, Watts S, McDonald R, Boucher T. Domesticated nature: shaping landscapes and ecosys-tems for human welfare. Science. 2007; 316(5833):1866–9. doi:10.1126/science.1140170 ISI:000247602700029. PMID:17600209
66. Kim J. The impact of large-scale reclamation projects on the lives of local residents with the Saeman-geum project as an example The Korean Association for Environmental Sociology. 2007; 11(2):285–
316.
67. Schroth G, McNeely JA. Biodiversity conservation, ecosystem services and livelihoods in tropical land-scapes: Towards a common agenda. Environmental Management. 2011; 48(2):229–36. doi:10.1007/ s00267-011-9708-2PMID:21706379
68. Sachedina H, Nelson F. The development of payments for ecosystem services as a community-based conservation strategy in East Africa. In: Ingram JC, DeClerck F, Rumbaitis del Rio C, editors. Integrat-ing Ecology and Poverty Reduction: SprIntegrat-inger New York; 2012. p. 149–71.
70. Goldstein JH, Caldarone G, Duarte TK, Ennaanay D, Hannahs N, Mendoza G, et al. Integrating ecosys-tem-service tradeoffs into land-use decisions. Proceedings of the National Academy of Sciences. 2012; 109(19):7565–70.
71. Ziv G, Baran E, Nam S, Rodríguez-Iturbe I, Levin SA. Trading-off fish biodiversity, food security, and hydropower in the Mekong river basin. Proceedings of the National Academy of Sciences. 2012; 109 (15):5609–14.
72. Guerry AD, Ruckelshaus MH, Arkema KK, Bernhardt JR, Guannel G, Kim C-K, et al. Modeling benefits from nature: using ecosystem services to inform coastal and marine spatial planning. International Jour-nal of Biodiversity Science, Ecosystem Services & Management. 2012; 8(1–2):107–21. doi:10.1080/ 21513732.2011.647835
73. Foody GM. Status of land cover classification accuracy assessment. Remote Sensing of Environment. 2002; 80(1):185–201. doi:10.1016/S0034-4257(01)00295-4
![Fig 1. Distribution of study areas, protected areas, urban areas and reclaimed areas [Data Source: [19–22]]](https://thumb-eu.123doks.com/thumbv2/123dok_br/18447321.363874/4.918.57.686.114.977/distribution-study-areas-protected-areas-urban-reclaimed-source.webp)
![Table 1. The classification of marine and coastal ecosystem services [2, 35, 36].](https://thumb-eu.123doks.com/thumbv2/123dok_br/18447321.363874/6.918.49.876.134.253/table-classification-marine-coastal-ecosystem-services.webp)