Global J. Environ. Sci. Manage., 2(3): 209-222, Summer 2016
209
ABSTRACT: In the present study, different activated carbons were prepared from carbonized African beech wood sawdust by potassium hydroxide activation. The activated carbons were characterized by brunauer–emmett–teller, scanning electron microscope, fourier transform infrared spectroscopy, and thermogravimetric analyzer. The phenol adsorption capacity of the prepared carbons was evaluated. The different factors affecting phenol’s removal were studied including: contact time, solution pH and initial phenol concentration. The optimum phenol removal was obtained after a contact time of 300 min. and at an initial phenol solution pH 7. The maximum removal percentages were determined at 5 mg/L initial phenol concentration as 79, 93, 94 and 98% for AC0, AC1, AC2 and AC3; respectively. The adsorption of phenol on African beech sawdust activated carbons was found to follow the Lagergren first order kinetics and the intraparticle diffusion mechanism gave a good fit to the experimental data. The isothermal models applied fitted the experimental data in the order: Langmuir> Dubinin–Radushkevich> Freundlich and Temkin.
KEYWORDS: Activated carbon; Brunauer–emmett–teller (BET); Fourier transform infrared spectroscopy (FTIR); Isothermal modeling; Kinetics surface characteristics; Potassium hydroxide (KOH); Thermogravimetric analyzer (TGA)
Global J. Environ. Sci. Manage., 2(3): 209-222, Summer 2016 DOI: 10.7508/gjesm.2016.03.001
*Corresponding Author Email: ghadiraly@yahoo.com Tel.: +23832030; Fax: +23832030
Note. Discussion period for this manuscript open until September 1, 2016 on GJESM website at the “Show Article”.
Preparation, characterization and phenol adsorption capacity of
activated carbons from
African beech
wood sawdust
N.T. Abdel-Ghani1,G.A. El-Chaghaby2,*, F.S. Helal3
1Chemistry Department, Faculty of Science, Cairo University, Cairo, Egypt 2Regional Center for Food and Feed, Agricultural Research Center, Giza, Egypt 3Science and Technology Center of Excellence, Ministry of Military Production, Cairo, Egypt
INTRODUCTION
Wastewater containing phenolic compounds presents a serious discharge problem due to their poor biodegradability, high toxicity and ecological aspects. Phenolic compounds are frequent contaminants of ground water because of their wide use in industrial sectors (Sabio et al., 2001). They are widely present in many effluents such as those generated from coal tar, plastics, leather, paint, pharmaceutical, steel, textile, timber, paper pulp, insecticides, pesticides and oil refineries (Podkoscielny et al., 2003). Phenols are considered as priority pollutants since they are harmful
to organisms at low concentrations and many of them have been classified as hazardous pollutants because of their potential harm to human health (Nagda et al., 2007). The ingestion of water contaminated by phenols in the human body causes protein degeneration, tissue erosion and paralysis of the central nervous system and also damages the kidney, liver and pancreas (Yan and Guixiang, 2009). Thus removing phenols from industrial effluents before discharging into the water stream is a necessity. There are many methods such as oxidation, precipitation, ion exchange, solvent extraction and adsorption for removing phenols and phenol derivatives from aqueous solutions (Aksu and Yener, 2001; Tseng and Tseng, 2005). In review of wastewater treatment containing phenolic compounds,
Original Research Paper
Original Research Paper
Original Research Paper
Original Research Paper
Original Research Paper
Global J. Environ. Sci. Manage., 2(3): 209-222, Summer 2016 N.T. Abdel-Ghani et al.
it was found that adsorption by activated carbon is
considered as a useful treatment technique (
Moreno-Castilla, 2004) and one of the best available environmental control technologies (Lin and Cheng,
1999). Activated carbons are considered to be good and
effective adsorbents for the removal of phenol from wastewater because of their large surface area, porous nature, high adsorption capacity, high purity and availability.
Many recent studies reported the development of activated carbon from cheape and readily available materials. Activated carbons have been prepared from
corncob (Tseng and Tseng, 2005), sugar beet bagasse
(Onalet al., 2007), apricot shell (Karagozogluet al., 2007), sunflower seed hull (Thinakaran et al., 2008), agricultural waste material (Singhet al., 2008), bagasses (Juang et al., 2002), rubber seed coat (Rengaraj et al., 2002), coconut shell (Hu and Srinivasan, 1999), apricot stone shells (Daifullah and Girgis,1998) oil palm fibre (Tan et al., 2007) , bamboo (Hameed et al., 2007), coconut husk
(Tanet al., 2008) and Heveabrasiliensis seed coat (Hameed and Daud, 2008).Generally activated carbons are prepared by two different activation processes, either by physical or chemical activation. The chemical activation is preferred over physical activation for its lowered activation temperature and increased yield (Ioannidou and Zabaniotou, 2007; Adinataet et al., 2007).
The aim of the presents study was to use African
beech wood sawdust for the production of activated carbons and to evaluate their characteristical properties and their adsorption capacities for phenol removal from aqueous solutions. This study has been performed in Egypt during 2015.
MATERIALS AND METHODS
Materials
Sawdust was collected from Egyptian furniture factories. Phenol (Fluka) was used without further purification. Stock solutions were prepared by dissolving 1.0 g of phenol individually in 1 L of double distilled water. This stock solution was used to prepare the different diluted solutions of phenol used in the experiments. HCl and NaOH used to adjust solutions pH were obtained from Sigma.
Methods
Adsorbents Preparation
Activated carbons used in the present study were
prepared following the procedure described byWuet
al., (2012) with some modifications. The sawdust was washed several times with deionized water to remove surface impurities, and then it was oven dried at 105C
for 24 h.The dried sawdust was immersed in 25 wt% H2SO4 overnight, and then was carbonized in vacuum oven at 290 ºC for 2 h. It was then washed with de-ionized water until the water was neutral. At this stage, it was called the sawdust char (AC0). The resulting char was immersed in potassium hydroxide solution (KOH), with the KOH/char weight ratio of 1, 2, and 3, respectively, and was finally activated at 780 ºC for 1 h. The prepared carbons were accordingly denoted as, AC1, AC2, and AC3; respectively.
Adsorbents characterization
The adsorbents surface functional groups were obtained by the fourier transform infrared spectroscopy (FTIR) analysis over the range of 500–4000 1/cm using a Nicolet, AVATAR FTIR-370 Csl instrument. The microstructure of the adsorbents was examined using a scanning electron microscope (SEM, Quanta 250- FEI). The adsorbents surface properties were determined with an automatic adsorption instrument (Porous materials Co., BET-202A) in order to determine surface areas and total pore volumes. Thermogravimetric analysis of the adsorbents was also carried out using a thermogravimetric analyzer (TGA-Q 500).
Adsorption experiments
Batch adsorption studies were carried out at room temperature. The effect of contact time on phenol removal was investigated by mixing a known volume of phenol solution with a known adsorbent weight in capped conical flasks for different time intervals (30-900 min). The solution-adsorbent mixtures were stirred at 100 rpm in a shaking water bath at 25C. At the end of each time interval the samples were filtered through
Whatman No. 50 filter paper (2.7μ m size particle
retention) to eliminate any fine particles. The effect of each of the operational parameters affecting phenol adsorption was studied. Batch studies were performed
as function of adsorbent dosage ranging from (0.1-2.5g), solution pH (2-10) and phenol concentration (5-100 mg/L) in separate experiments. The concentration of phenol was determined by measuring absorbance using UV–vis spectrophotometer (Shimadzu UV-1601 Spectrophotometer, Japan) at 270 nm.
Global J. Environ. Sci. Manage., 2(3): 209-222, Summer 2016
Removal % = (Ci- Cf) * 100/Ci (1)
Where, Ci and Cf are the initial and final concentrations of phenol (mg/L) in the solution Adsorption capacity was calculated using equation 2.
Q = (Ci- Cf) * V/W (2)
Where Q is the adsorption capacity (mg/g), Ci is the initial phenol concentration in solution (mg/L), Cf is the equilibrium phenol concentration (mg/L), V is the volume of metal ion solution (L) and W is the weight of the adsorbent (g).
The kinetics of analyzing adsorptive uptake of phenol from aqueous solution at different time intervals was studied using four kinetic models (namely, pseudo-ûrst- order, pseudo-second-order, the Elovich equation and intra-particle diffusion). Adsorption isotherm studies were carried out using the Langmuir, Freundlich, Temkin and Dubinin–Radushkevich (D-R) isothermal models.
RESULTS AND DISCUSSION
Physical properties of KOH-activated carbons prepared from African beech sawdust
Table 1 gives the physical properties of AC0 (the carbon without KOH activation), AC1, AC2 and AC3 prepared by KOH- activation using different KOH/char ratios. As seen from Table.1 thetotal surface area (Stot) was significantly improved upon KOH activation of the sawdust. The (Stot)value of KOH-activated carbons increased with increasing KOH/char ratio, a similar
behavior was previously reported byWuet al.,(2005).
The maximumStot value obtained in the present study
for AC3 (1553.8 m2/g) was better than previously reported Stot values of commercial activated carbon
(Kumaret al., 2006), steam activated carbon from rubber
wood sawdust (Kumaret al., 2006), sawdust and neem
bark (Naiyaet al., 2009). The total pore volume Vtot
increased from 0.033 to 1.325cm3/g with increasing
KOH/char ratio. Comparing Vmicroand Vmeso values it is clear that the prepared adsorbents exhibited significantly developed micropore and mesopore structures, with a higher portion of mesopores than micropores that were observed upon KOH activation. During adsorption, macro and mesopores allow rapid transport of the adsorbate into the interior of the carbon for subsequent diffusion into the micropore volume (Galiatsatouet al., 2001).
According to (Galiatsatouet al., 2001), the pores of activated carbons are classified into three groups depending on pore width (pw): micropores (pw <20A°); mesopores (20A° < pw< 500A°); macropores (pw>
500A°). As seen fromTable 1 the pore diameters of the
prepared adsorbents ranged from 40.2 to 115.5A° confirming their mesoporous structures.
Scanning electron microscope (SEM) studies The SEM enables the direct observation of the changes in the surface microstructures of the adsorbents due to the modiûcation (Jainet al., 2010).
Fig.1 shows the SEM micrographs of the char produced from the African beech sawdust (AC0), and the activated carbons AC1, AC2 and AC3 chemically activated by different char: KOH impregnation ratios 1:1, 1:2 and 1:3; respectively.
The SEM photo of AC (Fig. 1 a) shows a ruptured
surface with long ridges resembling a series of parallel lines and a small number of pores (Asadullahet al.,
2010). The chemical activation with KOH allowed the
development of pores with different sizes on the char
surface. As can be seen from (Fig. 1 b) a number of
Table 1: Physical properties of carbons derived from African beech sawdust by KOH activations
Characteristics AC0 AC1 AC2 AC3
Color Brown Black Black Black
Smic micropore surface area (m2/g)
114.600 863.700 913.600 1046.900
Smesmesopore surface area (m2/g)
251.700 373.100 421.200 506.900
Stot total BET surface area (m2/g) 366.300 1236.800 1334.800 1553.800
Vmicromicropore volume of the adsorbent (cm3/g)
0.010 0.219 0.292 0.317
Vmesomesopore volume of the adsorbent (cm3/g)
0.023 0.564 0.839 1.008
Vtottotal pore volume of the adsorbent (cm3/g)
0.033 0.783 1.131 1.325
Vmeso/ Vtot (%) 69.700 72.000 74.200 76.100
Average pore width (Å ) 115.500 84.400 63.800 40.200
Global J. Environ. Sci. Manage., 2(3): 209-222, Summer 2016 Phenol adsorption capacity of activated carbons from wood sawdust
small sized pores has been developed on the surface of AC1. The pores build-up and pores size increased by increasing the char: KOH ratio of activation. The surface of AC2 (Fig.1 c) shows large pores, non-homogenous in size and randomly distributed on the carbon’s surface. Large and well-developed pores were clearly found on the surface of the activated carbon AC3 as seen in (Fig. 1 d). It can be concluded that surface modiûcation of sawdust contributed positively to the pores development (Jainet al., 2010).
According toTanet al.,(2008);the development of
pores on the surface of the activated carbon, might be due to the activation process used, which involved both chemical and physical activating agents of KOH and CO2. Pore development in the char during pyrolysis was also important as this would enhance the surface area and pore volume of the activated carbon by
promoting the diffusion of KOH and CO2 molecules
into the pores and thereby increasing the KOH–carbon and CO2–carbon reactions, which would then create more pores in the activated carbon. The differences in the surface structure of the activated carbons produced by chemical activation with KOH could be attributed to the removal of considerable organic by-products and minerals present in the sawdust upon activation (Kalavathyet al., 2010).
FTIR analysis
According to Hanafiah et al., (2012), sawdust is known to contain lignin, hemicellulose, cellulose and tannin as the major components. Thus various types of functional groups such as carboxyl, alcohols, amines and phenolic might be involved during the adsorption process. The FTIR spectra of the different adsorbents prepared from African beech sawdust are presented in
Fig . 2.
The spectra of the four studied adsorbents show
bands in the region (3500–3200 cm-1) characteristic for
(-OH) stretching vibration in hydroxyl groups. These bands are very weak indicating that upon carbonization and chemical activation of the sawdust some types of bond cleavage occurs, leading to dehydration and elimination reactions that release volatile products such as water, acetic acid, methanol and other chemical substances (Ljupkoviæet al., 2011). The peak observed in the spectra of AC0 at 1712.48 1/cm assigned to C=O carbonyls disappeared in the KOH- activated carbon samples.
The peaks at 1650–1450 cm-1 present in the spectra
of all prepared adsorbents are assigned to aromatics C=C stretching; and those peaks at 1000–1100 1/cm
are assigned to C–O and C–O–C stretchings (Jibrilet
al., 2007). The peaks around 600-900 1/cm in the spectra Fig. 1:SEM images of (a) AC0, (b) AC1, (c) AC2 and (d) AC3 (1000×)
a b
Global J. Environ. Sci. Manage., 2(3): 209-222, Summer 2016
213 of AC1, AC2 and AC3 were assigned to bending of hydrogen in various locations in the aromatic rings (Jibril et al., 2007).
Thermogravimetric Analysis (TGA)
TGA analysis of the activated carbons was obtained by heating the samples from 30 to 900 °C at a ramping
rate of 10ºC/min under nitrogen gas atmosphere. The TGA curves of the different activated carbons prepared from African beech sawdust are presented in Fig. 3. At temperatures above 100 ºC, chemical bonds begin to break. The rate at which the bonds are broken increases
as the temperature increases. The weight loss from room temperature to 130 ºC observed in the thermographs corresponds to the release of water vapor (Seey and Kassim, 2012). Upon rapid heating, the carbohydrates (cellulose and hemicellulose) break down to provide low molecular weight volatile products.
Another weight loss step occurred from above 100 ºC to around 400 ºC. This step was attributed to the removal of volatile matter which corresponded to the decomposition of cellulose, hemicellulose and lignin (Kalderis et al.,2008).The broad weightloss step that Fig.2: FTIR spectra of (a) AC0, (b) AC1, (c) AC2 and (d) AC3
0 10 20 30 40 50 60 70 80 90 100
0 50 100 150 200 250 300 350 400 450 500 550 600 650 700 750 800 850 900
Temperature (oC)
We
ig
ht
(%
) AC0
AC1 AC2 AC3
Global J. Environ. Sci. Manage., 2(3): 209-222, Summer 2016N.T. Abdel-Ghani et al.
occurs above 350 ºC, is due to carbonization process which may be attributed to cellulose, hemicellulose and lignin intermediates being transformed to gaseous materials and tars (Kalderiset al., 2008).The observed
weight loss taking place at temperatures above 800°C
might be due to a possible melting of the traces of potassium carbonate, contained in the carbon matrix,
and its possible decomposition into CO2(El-Hendawy,
2009).
Effect of contact time and kinetic studies
The relationship between contact time and phenol removal obtained by the activated carbons prepared fromAfrican beech sawdust is presented inFig. 4 for an adsorbent dosage of 5 g/L, initial phenol concentration of 25 mg/L and at a solution pH =7. It
can be seen from theFig. 4 that the percentage phenol
removal started very slow and then increased gradually with increasing the contact time until
equilibrium was attained. It can be seen fromFig.4
that the removal of phenol by the studied adsorbents remained almost unchanged from 300 to 900 min. Thus for further experiments the contact time was kept at 300 min.
The importance of kinetic modeling has been one of the major features of recent studies in adsorption (Gupta and Bhattacharyya, 2011). Kinetic study is important to an adsorption process because it depicts the uptake rate of adsorbate, and controls the residual
time of the whole adsorption process (Demirbaset al.,
2009). Thus in order to find the appropriate kinetic model describing the adsorption of phenol onto activated
carbons prepared fromAfrican beech sawdust, four kinetic models namely; first order, pseudo-second order, Elovich and intraparticle diffusion were tried to fit the experimental data.
Lagergren first order model
The Lagergren first order kinetic processes signify reversible interactions with an equilibrium being
established between liquid and solid phases (Lowet
al., 2007).
The model is represented by: ln (qe-qt) = ln qe-K1t (Lagergren, 1898).
Where K1 (1/min) is the pseudo first order adsorption rate coefficient, qe and qt are the values of amount adsorbed per unit mass at equilibrium and at any time t. The values of K1 and the calculated qe can be obtained respectively from the slope and intercept of the linear plot of ln (qe-qt) versus (t).
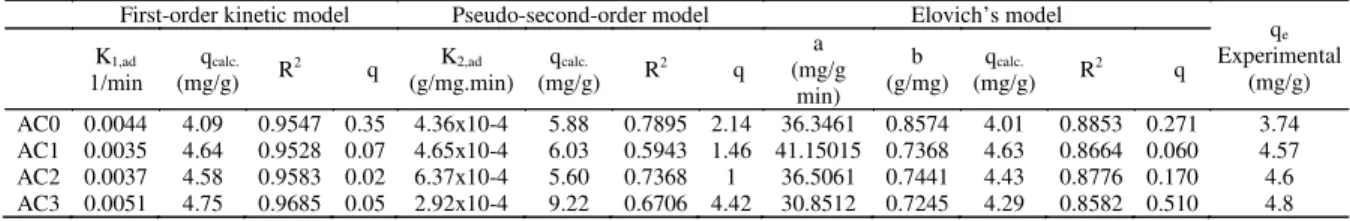
The values of K1, calculated qe values and correlation coefficients R2 obtained from the plots for adsorption of phenol on the activated carbons prepared fromAfrican beech sawdust are given inTable 2 . The
model’s R2 values were found to be relatively high >
0.95 and the experimental qe values were found to be in
good agreement with those calculated qe values
obtained from the linear Lagergren plots. Thus it can
be concluded that the adsorption of phenol onAfrican
beech sawdust activated carbons follows the Lagergren first order kinetics and that the process depends on both the solution concentration and the number of
available adsorption sites (Gupta and Bhattacharyya,
2011).
0 10 20 30 40 50 60 70 80 90 100
0 50 100 150 200 250 300 350 400 450 500 550 600 650 700 750 800 850 900
Contact time (min.)
P
h
e
n
o
l
re
m
o
v
a
l
p
e
rc
e
n
ta
g
e
(
%
)
AC AC1 AC2 AC3
Global J. Environ. Sci. Manage., 2(3): 209-222, Summer 2016
Pseudo-second order model
The second order kinetic model assumes that the rate-limiting step is most likely to involve chemical interactions leading to binding of the ions to the surface
by bonding as strong as covalent bonding (Gupta and
Bhattacharyya, 2011).
The pseudo-second-order equation (Ho and
McKay, 1998) based on equilibrium adsorption is expressed as: t/q= 1/ K2q2
e+ t /qe; where K2 (g/mg min.) is the rate constant of second-order adsorption.Plots of (t/qt) versus (t) give 1/qe as the slope and 1/K2qe2as the intercept.
The values of K2and correlation coefficient, R2 obtained from the plots for adsorption of phenol on African beech sawdust activated carbons are given in
Table 2. The R2 values were found to be relatively small (R2<0.8) and the experimental q
e values did not agree with the calculated values obtained from the linear plots.
Elovich model
Elovich’s equation assumes that the actual solid surfaces are energetically heterogeneous and that neither desorption nor interactions between the adsorbed species could substantially affect the
kinetics of adsorption at low surface coverage (Gupta
and Bhattacharyya, 2011).Elovich’s equation is given as: qt = (1/b) ln (ab) + (1/b) ln (t); where a (mg/g.min) is the initial sorption rate and b (g/mg) is related to the extent of surface coverage and activation energy for chemisorption. The constants of the Elovich’s equation y = 0.1622x - 0.5778
R² = 0.9804
y = 0.4889x - 4.7653 R² = 0.9938
0 0.5 1 1.5 2 2.5 3 3.5 4
0 5 10 15 20
t1/2
(a)
y = 0.1552x - 0.3145 R² = 0.9795
y = 0.6479x - 6.7395 R² = 0.9875
0 0.5 1 1.5 2 2.5 3 3.5 4 4.5 5
0 5 10 15 20
t1/2
(b)
y = 0.1651x - 0.2737 R² = 0.988
y = 0.6035x - 5.9361 R² = 0.9786
0 0.5 1 1.5 2 2.5 3 3.5 4 4.5 5
0 5 10 15 20
t1/2
(c)
y = 0.2335x - 0.4206 R2= 0.9694
y = 0.554x - 4.9296 R² = 0.9534
0 1 2 3 4 5 6
0 5 10 15 20
t1/2
(d)
qt qt
qt q
t
Fig. 5: Intraparticule diffusion mechanism for the adsorption of phenol onto (a) AC0, (b) AC1, (c) AC2 and (d) AC3
First-order kinetic model Pseudo-second-order model Elovich’s model q
e Experimental
(mg/g) K1,ad
1/min (mg/g)qcalc. R2 Δ q (g/mg.min)K2,ad (mg/g)qcalc. R2 Δ q a (mg/g
min) b
(g/mg) (mg/g)qcalc. R2 Δ q
AC0 0.0044 4.09 0.9547 0.35 4.36x10⁻⁴ 5.88 0.7895 2.14 36.3461 0.8574 4.01 0.8853 0.271 3.74 AC1 0.0035 4.64 0.9528 0.07 4.65x10⁻⁴ 6.03 0.5943 1.46 41.15015 0.7368 4.63 0.8664 0.060 4.57 AC2 0.0037 4.58 0.9583 0.02 6.37x10⁻⁴ 5.60 0.7368 1 36.5061 0.7441 4.43 0.8776 0.170 4.6 AC3 0.0051 4.75 0.9685 0.05 2.92x10⁻⁴ 9.22 0.6706 4.42 30.8512 0.7245 4.29 0.8582 0.510 4.8 Table 2: The first-order, second-order and Elovich’s kinetic models’ constants for phenol adsorption by different activated
Global J. Environ. Sci. Manage., 2(3): 209-222, Summer 2016
216
Phenol adsorption capacity of activated carbons from wood sawdust
for the same experimental data and given in Table 2 were obtained from the slope and intercept of the plots ofqtversus ln (t). The value of (1/b) is indicative of the number of sites available for adsorption while the (1/b) ln(ab) is the adsorption quantity when ln t is equal to zero; i.e., the adsorption quantity when t is 1 h (Tan et al., 2009).The R2 values obtained from Elovich’s equation
were found to be relatively high (R2> 0.85) and the q e
values calculated from Elovich’s equation agreed well with the experimental values.
Intra-particle diffusion
For porous adsorbents, the diffusion of the adsorbate molecules into the pores is also to be taken into account in finding a suitable kinetic model for the process. In many cases, the intra particle diffusion may control the rate of uptake of an adsorbate (Gupta and Bhattacharyya, 2011). The intraparticle diffusion equation, suggested by Weber and Morris (1963) can be expressed by: qt=
K(i) t0.5 + C
b(i) ; where qt is the adsorbed quantity of
phenol, Ki is the intraparticle diffusion parameter, and Cb.i is the thickness of the boundary layer at stage (i). The Plots (qt) versus (t0.5) representing the
intraparticle diffusion model are given in Fig. 8. The parameters obtained from the intraparticle plots are listed in Table 3.
From Table 3 it can be observed that high correlation coefficient values (R2>0.95) were obtained
for the intraparticle diffusion model suggesting the applicability of the model for describing the adsorption of phenol onto activated carbons prepared from African beech sawdust.
As can be noticed from Fig. 5 multi-linear plots with two linear portions were obtained for the adsorption of phenol onto activated carbons prepared from African beech sawdust. According to El-Naaset al. (2010) the first linear portion of these plots represents the external diffusion by macropore and Table 3: Intraparticulediffsion mechanism constants for phenol adsorption by different
activated carbons prepared from African beech sawdust
Intraparticle diffusion
K1
(mg/g min -0.5)
Cb (1)
(mg/g) R
2 K2
(mg/g min -0.5)
Cb (2)
(mg/g) R
2
AC0 0.1622 0.5778 0.9804 0.4889 4.7653 0.9938
AC1 0.1552 0.3145 0.9795 0.6479 6.7395 0.9875
AC2 0.1651 0.2737 0.9880 0.6035 5.9361 0.9786
AC3 0.2335 0.4206 0.9694 0.554 4.9296 0.9534
Global J. Environ. Sci. Manage., 2(3): 209-222, Summer 2016
mesopore; whereas the second portion of the plot indicates the micropore diffusion by the intraparticle diffusion (Aksu and Kabasakal, 2004). It has to be also noted that the plots did not pass through the origin indicating that the rate limiting process is not only due to the intraparticle diffusion some other mechanism along with intraparticle diffusion is also involved in the adsorption process (Tanet al., 2009).
Effect of solution pH
Hydrogen ion concentration in the adsorption is considered to be one of the most important parameters that influence the adsorption behavior of phenol in aqueous solutions (Kilicet al., 2011). The effect of solution pH on the removal of phenol by African beech sawdust activated carbons was studied over a pH range from 2 to 10 and the results are presented inFig.6.
The experimental results showed that the maximum phenol removal percentages were obtained at around pH 7 and decreased on either sides of pH 7 for the different studied adsorbents. It is worth noting that phenol exists predominantly as neutral species at pH 7 (Nadavalaet al., 2009). The pH dependence of phenol adsorption can largely be related to the type and ionic state of the activated carbon surface functional groups
and also on the phenol chemistry in solution (Bekeret
al.,2010).Nadavalaet al.(2009)explained the effect of solution pH on the removal of phenols and their
derivatives from aqueous solution by considering the presence of ionic and molecular forms of phenolic compounds in aqueous solution. These compounds act as weak acids in aqueous solution, and the dissociation of hydrogen ion from phenolic compounds strongly depends on the pH of the solution. In acidic solutions, the molecular form dominates and in alkaline medium, the anionic form is the predominant species.
It was suggested that the aromatic compounds adsorb on active carbon by a donor-acceptor complex mechanism involving carbonyl-oxygens of the carbon surface acting as the electron donor and the aromatic
ring of the solute acting as the acceptor (Mattson et
al.,1969).The decrease in phenol adsorption at pH <7
can be explained by the increased H+ adsorption on
the carbonyl sites, which suppresses phenol adsorption on these sites. On the other hand, the decrease in the phenol amount adsorbed at pH>7 is attributed to both greater solubility of dissociated phenol at pH>pKa and increased repulsion forces between the dissociated form of the adsorbate and the carbon surface due to high concentration of OH” ( El-Naaset al., 2010). In agreement with our results many researchers have found that pH around 7 was the optimum pH for phenol removal onto different types of activated carbons (Beker, 2010; El-Naas, 2010; Kilicet
al.,2011). Therefore, the optimum solution pH was
selected to be 7 for our further adsorption experiments. 0
10 20 30 40 50 60 70 80 90 100
0 5 10 15 20 25 30 35 40 45 50 55 60 65 70 75 80 85 90 95 100
Phenol concentration (mg/L)
AC0 AC1 AC2 AC3
P
he
no
l
re
m
ov
al
p
er
ce
nt
ag
e
(%
)
Global J. Environ. Sci. Manage., 2(3): 209-222, Summer 2016N.T. Abdel-Ghani et al.
Effect of initial phenol concentration
Fig. 7 gives the effect of initial phenol concentration on its removal from aqueous solution by the four prepared activated carbons over a concentration range from 5 to 100 mg/L. It was observed that the removal of phenol was high at lower concentrations and decreased by increasing the phenol concentration. The higher phenol adsorption at lower concentrations may be due to the presence of more available sites on the adsorbent than the number of phenol ions which are available in the solution. However, at higher concentrations the number of phenol ions is relatively higher than available sites for adsorption (Kilicet al., 2011). The maximum removal percentages were determined at 5 mg/L initial phenol concentration as 79, 93, 94 and 98% for AC0, AC1, AC2 and AC3; respectively.
Adsorption isothermal modeling
Equilibrium isotherms are fundamental in describing the interactive behavior between the solutes and adsorbent and also essential in the design of an
adsorption system (Wan Ngah and Fatinathan, 2008).
In the present study, four adsorption isotherms: the Langmuir, Freundlich, Temkin and Dubinin– Radushkevich (D-R) isotherms were applied to ût the
equilibrium data of adsorption of phenol on theAfrican
beech sawdust activated carbons. TheLangmuir, (1916) model assumes uniform energies of adsorption onto the surface and no transmigration of adsorbate in the
Table 4: Sorption isotherm coefficients of Langmuir, Freundlich, Temkin and Dubinin-Radushkevich (D-R) models applied to phenol adsorption by different activated carbons prepared from African beech sawdust
Langmuir Freundlich Temkin Dubinin-Radushkevich
qmax.
(mg/g) (L/mg)b R2 KF n R2 aT bT R2 (mg/g)qs BD R2
AC0 1.732 0.252 0.961 1.035 2.335 0.777 1.103 0.841 0.777 3.469 6.00E-07 0.944
AC1 2.597 0.353 0.980 1.856 3.319 0.672 2.285 0.685 0.638 4.075 1.00E-07 0.923
AC2 3.447 0.867 0.980 2.012 3.236 0.672 2.488 0.749 0.699 4.458 1.00E-07 0.955
AC3 4.336 1.524 0.997 2.636 3.893 0.703 3.204 0.677 0.735 4.982 5.00E-08 0.979
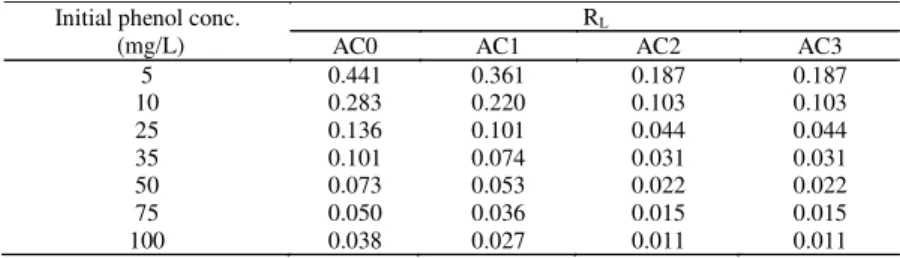
Table 5: Langmuir isotherm separation parameter, RLfor phenol adsorption by different activated carbonsprepared from African beech sawdust
Initial phenol conc. (mg/L)
RL
AC0 AC1 AC2 AC3
5 0.441 0.361 0.187 0.187
10 0.283 0.220 0.103 0.103
25 0.136 0.101 0.044 0.044
35 0.101 0.074 0.031 0.031
50 0.073 0.053 0.022 0.022
75 0.050 0.036 0.015 0.015
100 0.038 0.027 0.011 0.011
plane of the surface. The linear form of the Langmuir equation is given by: Ceq/qe = 1/bqmax + Ceq/qmax; where qe (mg/g) is the amount of solute adsorbed per unit weight of adsorbent at equilibrium, Ceq(mg/L) the equilibrium concentration of the solute in the bulk
solution, qmax (mg/g) is the maximum adsorption
capacity, and b (l/mg)is the Langmuir constant related to the affinityof binding sites. The Langmuir adsorption isotherms of phenol on AC0, AC1, AC2 and AC3 were obtained by ploting Ce/qe versus Ce. The empirical
model proposed byFreundlich, (1906) is shown to be
consistent with an exponential distribution of active centers, characteristic of heterogeneous surfaces. The amount of sorbate adsorbed, qe, is related to the concentration of sorbate in the solution through the following equation: log qe= log Kf + (1 /n) log Ceq ;
where KF and n are Freundlich constants. The
experimental data of the present study were ûtted to
the Freundlich equation and the parameters (Kf and n)
Global J. Environ. Sci. Manage., 2(3): 209-222, Summer 2016
The Dubinin–Radushkevich (D-R) isotherm (Dubinin, 1947), on the other hand, is based on the potential theory of adsorption for adsorbents with an energetically non-uniform surface where the dominant adsorption interaction is dispersion forces.The D–R model is used to determine if adsorption occurred by
physical or chemical processes (Unlu and Ersoz, 2006)
and it is presented mathematically as: lnq = lnqs - BD
ε2; where qs is the theoretical isotherm saturation
capacity,ε is the Polanyi potential and BD(mol2/kJ2) is
constantrelated to the free energy of sorption per mole of sorbate as it migrates to the surface of the
adsorbent from infinite distance in the solution (
El-Naas et al., 2010).The values of qs and BD were calculated from the intercept and slope of the lnq vs.
ε2 plots. The values for the determined parameters of
each isotherm are shown inTable 4, together with
the respective R2 value for each model. Comparison
of the obtained R2 values shows that the experimental
data fitted the isothermal models in the order: Langmuir> D-R>Freundlich and Temkin. The good fit of the experimental data with the Langmuir model may be attributed to the homogenous distribution of active sites on the surface of the prepared activated carbons. The favorable nature of adsorption can be expressed in terms of dimensionless Langmuir equilibrium parameter (Hallet al., 1966): RL= 1/(1 + bCi), wherebis
the Langmuir constant and Ci is the initial
concentration of the adsorbate in solution. The values of RL indicates the type of isotherm to be irreversible (RL= 0), favorable (0<RL<1), linear (RL= 1) or unfavorable (RL> 1) (Abdel-Ghaniet al., 2009).As seen fromTable 5 the RL values for the different initial concentrations of phenol adsorbed onto AC0, AC1, AC2 and AC3; were found to lie between zero and one indicating favorable adsorption of phenol on the studied adsorbents.
The Langmuir maximum adsorption capacity values of the present study were compared to some previously investigated adsorbents. The maximum adsorption capacity of phenol by activated carbons
prepared from coconut shells was 0.36 mmol/ g (Singh
et al., 2008). The maximum uptake of phenol by Tectonagrandis sawdust was found to be 2.82 mg/g (Mohantyet al., 2005). Coke breezeshowed a capacity of 0.18mg/g for phenol removal whereas the adsorption capacity was found to be 4.5 mg/g for
phenol removal by Rice husk (Ahmaruzzaman and
Sharma, 2005).
CONCLUSION
In the present study, the preparation of activated
carbon from African beech wood sawdust a locally
available waste was successfully achieved. The surface characteristics of the produced carbons were highly affected by the weight ratio of KOH to char used in the activation process. The prepared activated carbons had high brunauer–emmett–teller (BET) surface areas ranging from 1236.8 to1553.8 m2/g. The surface morphology of the prepared adsorbents obtained from the SEM analysis revealed well developed pores. The adsorption process of phenol by the prepared activated carbons was optimized at a contact time of 300 min. and initial solution pH of 7. Kinetic studies showed
that the adsorption of phenol onto African beech
sawdust activated carbons followed the first –order kinetics model. The adsorption experimental data showed a good fit to the Langmuir and D-R isotherms.
CONFLICT OF INTEREST
The authors declare that there are no conflicts of interest regarding the publication of this manuscript.
REFERENCES
Abdel-Ghani, N.T.; Hegazy, A.K.; El-Chaghaby, G.A., (2009). Typha domingensis leaf powder for decontamination of aluminium, iron, zinc and lead: Biosorption kinetics and equilibrium modeling. Int. J. Environ. Sci. Technol. 6: 243-248 (6 pages). doi:10.1007/BF03327628
Adinata, D.; Daud W.M.A.W.; Aroua M.K., (2007). Preparation and characterization of activated carbon from palm shell by chemical activation with K2CO3. Bioresour. Tech. 98:145– 149 (5 pages).
Ahmaruzzaman, M.; Sharma, D.K., (2005). Adsorption of phenols from wastewater. J. Colloid Interface Sci. 287:14– 24 (11 pages). doi:10.1016/j.jcis.2005.01.075
Aksu, Z. ; Kabasakal E., (2004). Batch adsorption of 2,4-dichlorophenoxy-acetic acid (2,4- D) from aqueous solution by granular activated carbon. Sep. Purif. Technol. 35: 223-240 (18 pages). doi:10.1016/S1383-5866(03)00144-8
Aksu, Z.; Yener J., (2001). A comparative adsorption/ biosorption study of monochlorinated phenols onto various sorbents. Waste Manag. 21:695-702 (8 pages).
Asadullah, M.; Asaduzzaman, M.; Kabir, M. S.; Mostofa, M. G.; Miyazawa, T., (2009). Chemical and structural evaluation of activated carbon prepared from jutesticks for Brilliant Green dye removal from aqueous solution. J. Hazard. Mater. 174:437-443 (7 pages).
Beker, U.; Ganbold, B.; Dertli, H.; Gülbayir, D.D., (2010). Adsorption of phenol by activated carbon: Influence of activation methods and solution pH. Energ. Convers. Manage. 51: 235–240 (6 pages). doi:10.1016/
j.enconman.2009.08.035
Global J. Environ. Sci. Manage., 2(3): 209-222, Summer 2016 Phenol adsorption capacity of activated carbons from wood sawdust
Demirbas, E.; Dizge, N.; Sulak, M.T.; Kobya, M., (2009). Adsorption kinetics and equilibrium of copper from aqueous solutions using hazelnut shell activated carbon, Chem. Eng. J., 148: 480–487(8 pages).
Dubinin, M.M.; Radushkevich, L.V., (1947). Equation of the characteristic curve of activated charcoal, Proceedings of the Academy of Sciences, Physical Chemistry Section, U.S.S.R., 55: 331-333 (3 pages).
El-Hendawy, A. A., (2009). An insight into the KOH activation mechanism through the production of microporous activated carbon for the removal of Pb2+ cations. Appl. Surf. Sci. 255: 3723–3730 (8 pages).doi:10.1016/j.apsusc.2008.10.034
El-Naas, M. H. ; Al-Zuhair S. ; Manal Abu Alhaija, (2010). Removal of phenol from petroleum refinery wastewater through adsorption on date-pit activated carbon. Chem. Eng. J. 162:997–1005 (9 pages). doi:10.1016/
j.cej.2010.07.007
Freundlich, H.M.F., (1906), Uber die adsorption in losungen,
Zeitschrift für Physikalische Chemie (Leipzig),
57A:385-470 (6 pages).
Galiatsatou, P. ; Metaxas, M. ; Kasseloui-Rigopoulou, V., (2001). Mesopores activated carbon from agricultural by products. Mikrochimica Acta. 136(3): 147-152 (6 pages).
Gupta S. S., Bhattacharyya K. G., (2011). Kinetics of adsorption of metal ions on inorganic materials: A review. Adv. Colloid. Interfac. 162: 39–58 (10 pages).
Hall, K.R.; Eagleton, L.C.; Acrivos, A. ; Vermeulen, T., (1966). Pore and solid diffusion kinetics in ûxed-bed adsorption under constant pattern conditions.Ind. Eng. Chem. Fund. 5: 212– 223 (2 pages).
Hameed, B.H.; Daud, F.B.M., (2008). Adsorption studies of basic dye on activated carbon derived from agricultural waste:
Hevea brasiliensis seed coat.Chem. Eng. J.139: 48–55 (8 pages).
Hameed, B.H.; Din, A.T.M.; Ahmadm, A.L., (2007). Adsorption of methylene blue onto bamboo-based activated carbon: kinetics and equilibrium studies. J. Hazard. Mater. 141: 819-825 (7 pages).
Hanafiah, M.A.; Ngah, W.S.; Zolkafly, S.H.; Teong, L.C.; Majid, Z.A., (2012). Acid Blue 25 adsorption on base treated Shorea dasyphylla sawdust: Kinetic, isotherm, thermodynamic and spectroscopic analysis. J. Environ. Sci. 24: 261–268 (8 pages).
Ho, Y.S.; McKay, G., (1998). The kinetics of sorption of basic dyes from aqueous solutions by sphagnum moss peat. Can. J. Chem. Eng. 76: 822–827 (6 pages).
Hu, Z.; Srinivasan, M.P., (1999). Preparation of high-surface-area activated carbons from coconut shell, Micropor. Mesopor. Mat. 27: 11–18 (8 pages).
Ioannidou, O.; Zabaniotou, A., (2007). Agricultural residues as precursors for activated carbon production: A review. Renew. Sustainable Energ. Rev.11: 1966–2005 (10 pages).
Jain, M.; Garg, V. K.; Kadirvelu, K., (2010). Adsorption of hexavalent chromium from aqueous medium onto carbonaceous adsorbents prepared from waste biomas. J. Environ. Manage. 91: 949–957 (8 pages).
Jibril, B. Y. ; Al-Maamari, R. S. ; Hegde, G. ; Al-Mandhary, N. ; Houache, O., (2007). Effects of feedstock pre-drying on carbonization of KOH-mixed bituminous coal in preparation of activated carbon. J. Anal. Appl. Pyrol. 80:277-282 (6 pages).
Juang, R.S.; Wu, F.C.; Tseng, R.L., (2002). Characterization and use of activated carbons prepared from bagasses for liquid-phase adsorption. Colloid. Surface A. 201:191–199 (10 pages).
Kalavathy, H. ; Karthik, B. ; Miranda, L. R., (2010). Removal and recovery of Ni and Zn from aqueous solution using activated carbon from Hevea brasiliensis: Batch and column studies. Colloid. Surface B. 78: 291–302 (12 pages). Kalderis, D.; Bethanis, S.; Paraskeva, P.; Diamadopoulos, E.,
(2008). Production of activated carbon from bagasse and rice husk by a single-stage chemical activation method at low retention times, Bioresour. Tech. 99:6809–6816 (18 pages).
Karagozoglu, B. ; Tasdemir, M. ; Demirbas, E. ; Kobya, M., (2007). The adsorption of basic dye (Astrazon Blue FGRL) from aqueous solutions onto sepiolite, fly ash and apricot shell activated carbon: kinetic and equilibrium studies. J. Hazard. Mater. 147:297–306 (10 pages).
Kilic, M.; Apaydin-Varol, E.; Pütün, A. E., (2011). Adsorptive removal of phenol from aqueous solutions on activated carbon prepared from tobacco residues: Equilibrium, kinetics and thermodynamics. J. Hazard. Mater. 189:397–403 (7 pages).
Kumar, P. B.G.; Shivakamy, K.; Miranda, L. R.; Velan, M., (2006). Preparation of steam activated carbon from rubberwood sawdust (Hevea brasiliensis) and its adsorption kinetics. J. Hazard. Mater. 136: 922-929 (8 pages).
Lagergren, S., (1898). Kungliga Svenska Vetenskapsakademiens. Handlingar. 24:31-39 (10 pages).
Langmuir, I., (1916). The constitution and fundamental properties of solids and liquids, J. Am. Chem. Soc. 38: 2221-2295 (6 pages).
Lin, S.H.; Cheng, Y.H.J., (1999). Adsorption of BTEX from aqueous solutions by macro reticular resins. J. Hazard. Mater. 70:21-37 (7 pages).
Ljupkoviæ, R.B.; Mitroviæ, J.; Radoviæ, M.; Kostiæ, M.; Bojiæ, D.; Mitiæ-Stojanoviæ, D-L.; Bojiæ, A.Lj., (2011). Removal Cu(II) ions from water using sulphuric acid treated
Lagenaria vulgaris Shell. Biologica Nyssana.2: 85-89 (5 pages).
Low, K.S.; Lee, C.K.; Liew, S.C., (2007). Sorption of cadmium and lead from aqueous solutions by spent grain. Process Biochem. 36: 59-64 (6 pages).
Mattson, J.S.; Mark, Jr. H.B.; Malbin, M.D.; Weber, I.W.J.; Crittenden, J. C., (1969). Surface chemistry of active carbon: Specific adsorption of phenols, J. Colloid. Interf. Sci. 31: 116-130 (15 pages).
Mohanty, K.; Das, D.; Biswas, M.N., (2005). Adsorption of phenol from aqueous solutions using activated carbons prepared from Tectona grandis sawdust by ZnCl2 activation. Chem. Eng. J. 115:121–131 (11 pages). doi:10.1016/
j.cej.2005.09.016
Moreno-Castilla, C., (2004). Adsorption of organic molecules from aqueous solutions on carbon materials, Carbon, 42: 83-94 (12 pages).
Nadavala, S. K.; Swayampakula, K.; Boddu, V.M.; Abburim, K., (2009). Biosorption of phenol and o-chlorophenol from aqueous solutions onto chitosan–calcium alginate blended beads, J. Hazard. Mater.162:482–489 (8 pages).
Global J. Environ. Sci. Manage., 2(3): 209-222, Summer 2016
Naiya, T. K. ; Chowdhury, P. ; Kumar, B. A. ; Kumar, D. S., (2009). Saw dust and neem bark as low cost natural biosorbent for adsorptive removal of Zn(II) and Cd(II) ions from aqueous solutions. Chem. Eng. J. 148: 68–79 (12 pages).
Onal, Y.; Akmil-Baºar, C.; Sarici-Ozdemir, C.; Erdoðan, S., (2007). Textural development of sugar beet bagasse activated with ZnCl2. J. Hazard. Mater. 142:138–143 (6 pages).
Podkoscielny, P.; Dabrowski, A.; Marijuk, O.V., (2003). Heterogeneity of activated carbons in adsorption of phenol aqueous solutions. Appl. Surf. Sci. 205: 297-303 (7 pages).
Rengaraj, S.; Moon, S.H.; Sivabalan, R.; Arabindoo, B.; Murugesan, V., (2002). Removal of phenol from aqueous solution and resin manufacturing industry wastewater using an agricultural waste: rubber seed coat. J. Hazard. Mater. 89 :185-196 (12 pages).
Sabio, E.; González-Martýn, M.L.; Ramiro, A.; González, J.F.; Bruque, J.M.; Labajos-Broncano, L.; Encinar, J.M., (2001). Influence of regeneration temperature on the phenols adsorption on activated carbon. J. Colloid Interf. Sci. 242: 31- 35 (5 pages).
Seey, T.L.; Kassim M.J.N.M., (2012). Characterization of mangrove bark adsorbent and its application in the removal of textile dyes from aqueous solutions. J. Appl. Phytotechnol. Environ. Sanit. 1: 121-130 (10 pages).
Singh, K.P.; Malik, A.; Sinha, S., Ojha P., (2008). Liquid-phase adsorption of phenols using activated carbons derived from agricultural waste material. J. Hazard. Mater.150: 626–641 (16 pages).
Tan, I.A.W.; Hameed, B.H.; Ahmad, A.L., (2007). Equilibrium and kinetic studies on basic dye adsorption by oil palm fibre activated carbon. Chem. Eng. J. 127: 111–119 (10 pages).
Tan, I.A.W.; Ahmad, A.L.; Hameed, B.H., (2008). Adsorption of basic dye on high surface area activated carbon prepared from coconut husk: equilibrium, kinetic and thermodynamic studies. J. Hazard. Mater. 154: 337-346 (10 pages).
Tan, I.A.W.; Ahmad, A.L.; Hameed, B.H., (2009). Adsorption isotherms, kinetics, thermodynamics and desorption studies of 2,4,6-trichlorophenol on oil palm empty fruit bunch-based activated carbon. J. Hazard. Mater. 164: 473-482 (10 pages).
Temkin, M.I., (1941). Adsorption equilibrium and the kinetics of processes on non homogeneous surfaces and in the interaction between adsorbed molecules,Zhurnal Fizicheskoi Khimii, 15: 296–332 (7 pages).
Thinakaran, N.; Baskaralingam, P.; Pulikesi, M.; Panneerselvam, P.; Sivanesan, S., (2008). Removal of Acid Violet 17 from aqueous solutions by adsorption onto activated carbon prepared from sunflower seed hull. J. Hazard. Mater. 151:316–322 (7 pages).
Tseng, R.L.; Tseng, S.K., (2005). Pore structure and adsorption performance of the KOH activated carbons prepared from corncob. J. Colloid Interf. Sci. 287: 428–437 (10 pages).
Unlu, N.; Ersoz, M., (2006), Adsorption characteristics of heavy metal ions onto a low cost biopolymeric sorbent from aqueous solutions. J. Hazard. Mater. B136: 272–280 (9 pages).
Wan Ngah, W.S.; Fatinathan, S., (2008). Adsorption of Cu(II) ions in aqueous solution using chitosan beads, chitosan– GLA beads and chitosan–alginate beads. Chem.Eng. J. 143: 62–72 (11 pages).
Weber, W.J.; Morris, J.C., (1963). Kinetics of adsorption on carbon from solutions, J. Sanit. Eng. Div. 89: 31–60 (30 pages).
Wu, F.C.; Tseng, R.L.; Juang, R. S., (2005). Preparation of highly microporous carbons from fir wood by KOH activation for adsorption of dyes and phenols from water. Sep. Purif. Tech. 47: 10-19 (10 pages).
Yan, J.; Quan, G. , (2009). Equilibrium and kinetic studies of phenol sorption by chitosan coated montmorillonite. J. Chil. Chem. Soc. 54: 73-76 (4 pages).
AUTHOR (S) BIOSKETCHES
Abdel-Ghani, N.T.,Ph.D., Professor, Chemistry Department, Faculty of Science, Cairo University, Cairo, Egypt. Email:noureta2002@yahoo.com
El-Chaghaby, G.A.,Ph.D., Assistant Professor, Regional Center for Food and Feed, Agricultural Research Center, Giza, Egypt. Email:ghadiraly@yahoo.com
Helal, F.S.,Ph.D., Instructor, Science and TechnologyCenterofExcellence, Ministry of Military Production, Cairo, Egypt. Email:ghadir_elchaghaby@yahoo.com
DOI:10.7508/gjesm.2016.03.001 URL:http://gjesm.net/article_18506.html
HOW TO CITE THIS ARTICLE
Abdel-Ghani, N.T.; El-Chaghaby, G.A.; Helal, F.S., (2016). Preparation, characterization and phenol adsorption capacity of activated carbons from African beech wood sawdust. Global J. Environ. Sci. Manage., 2(3): 209-222. COPYRIGHTS
Copyright for this article is retained by the author(s), with publication rights granted to the journal.
Global J. Environ. Sci. Manage., 2(3): 209-222, Summer 2016
222