META-GSA: Combining Findings from
Gene-Set Analyses across Several Genome-Wide
Association Studies
Albert Rosenberger1*, Stefanie Friedrichs1, Christopher I. Amos2, Paul Brennan3, Gordon Fehringer4, Joachim Heinrich5, Rayjean J. Hung4, Thomas Muley6,7,
Martina Müller-Nurasyid8,9,10,11, Angela Risch6,12,13, Heike Bickeböller1
1Department of Genetic Epidemiology, University Medical Center, Georg-August University Göttingen, Göttingen, Germany,2Geisel School of Medicine, Dartmouth College, Lebanon, NH, United States of America,3International Agency for Research on Cancer (IARC), Lyon, France,4Prosserman Centre for Health Research, Samuel Lunenfeld Research Institute, Mount Sinai Hospital, Toronto, Ontario, Canada, 5Institute of Epidemiology I, Helmholtz Zentrum München, German Research Center for Environmental Health, Neuherberg, Germany,6Translational Lung Research Center Heidelberg (TLRC-H), Member of the German Center for Lung Research (DZL), Heidelberg, Germany,7Thoraxklinik at University of Heidelberg, Heidelberg, Germany,8Department of Medicine I, Ludwig-Maximilians-University Munich, Munich, Germany,9Institute of Medical Informatics, Biometry and Epidemiology, Chair of Genetic Epidemiology, Ludwig-Maximilians-University, Munich, Germany,10Institute of Genetic Epidemiology, Helmholtz Zentrum München—German Research Center for Environmental Health, Neuherberg, Germany,11DZHK (German Centre for Cardiovascular Research), partner site Munich Heart Alliance, Munich, Germany,12Division of Epigenomics and Cancer Risk Factors, German Cancer Research Center, Heidelberg, Germany, 13Division of Molecular Biology, University Salzburg, Salzburg, Austria
Abstract
Introduction
Gene-set analysis (GSA) methods are used as complementary approaches to genome-wide association studies (GWASs). The single marker association estimates of a prede-fined set of genes are either contrasted with those of all remaining genes or with a null non-associated background. To pool the p-values from several GSAs, it is important to take into account the concordance of the observedpatternsresulting from single marker association point estimates across any given gene set. Here we propose an enhanced version of Fish-er’s inverseχ2-method META-GSA, however weighting each study to account for imperfect correlation betweenassociation patterns.
Simulation and Power
We investigated the performance of META-GSA by simulating GWASs with 500 cases and 500 controls at 100 diallelic markers in 20 different scenarios, simulating different relative risks between 1 and 1.5 in gene sets of 10 genes. Wilcoxon’s rank sum test was applied as GSA for each study. We found that META-GSA has greater power to discover truly associ-ated gene sets than simple pooling of the p-values, by e.g. 59% versus 37%, when the true relative risk for 5 of 10 genes was assume to be 1.5. Under the null hypothesis of no
OPEN ACCESS
Citation:Rosenberger A, Friedrichs S, Amos CI, Brennan P, Fehringer G, Heinrich J, et al. (2015) META-GSA: Combining Findings from Gene-Set Analyses across Several Genome-Wide Association Studies. PLoS ONE 10(10): e0140179. doi:10.1371/ journal.pone.0140179
Editor:Manu Sharma, Institute for Clinical Epidemiology and Applied Biometry, GERMANY
Received:May 28, 2015
Accepted:September 21, 2015
Published:October 26, 2015
Copyright:© 2015 Rosenberger et al. This is an open access article distributed under the terms of the Creative Commons Attribution License, which permits unrestricted use, distribution, and reproduction in any medium, provided the original author and source are credited.
Data Availability Statement:The summary data of individual data which are used in our meta-analysis approach for all four included genome-wide association studies will be found in dbGaP, accession number phs000877.
difference in the trueassociation patternbetween the gene set of interest and the set of remaining genes, the results of both approaches are almost uncorrelated. We recommend not relying on p-values alone when combining the results of independent GSAs.
Application
We applied META-GSA to pool the results of four case-control GWASs of lung cancer risk (Central European Study and Toronto/Lunenfeld-Tanenbaum Research Institute Study; Ger-man Lung Cancer Study and MD Anderson Cancer Center Study), which had already been analyzed separately with four different GSA methods (EASE; SLAT, mSUMSTAT and Gen-Gen). This application revealed the pathway GO0015291“transmembrane transporter activity”
as significantly enriched with associated genes (GSA-method: EASE,p= 0.0315 corrected for multiple testing). Similar results were found for GO0015464“acetylcholine receptor activity”
but only when not corrected for multiple testing (all GSA-methods applied; p0.02).
Introduction
Genome-wide association studies (GWASs) enable us to identify single markers or narrow geno-mic regions associated with a disease after genotyping thousands of single nucleotide polymor-phisms (SNPs) throughout the whole genome. However, the interplay of genes in the etiology of the phenotype in question has still not been considered.“It is well known that genes do not work in isolation; instead, complex molecular networks and cellular pathways are often involved in dis-ease susceptibility and disdis-ease progression”[1]. Hence, to respect pathways, which are typically sets of genes connected through known or proposed mechanisms on a molecular, cellular, or organic level, can help discover genetic susceptibility to complex traits [2].
Gene-set analysis (GSA) was therefore proposed as a complementary approach in the inves-tigation of the genetic basis of disease using GWAS results [3–9]. In principle, GSA either con-trasts the entirety of observed marker-specific associations of a common set of genes of interest (GS) with those of all remaining genes (GS´) (competitive test) or compares these to a null hypothesis (H0) of a non-associated background (self-contained test). GSA approaches provide
in general no estimate of the strength of association but only p-values (pGS), indicating some
kind of accumulation in significance of observed associations with a phenotype for genes or markers within theGS (denoted asaccumulated marker significance). ThesepGS-values
usu-ally result from one-sided statistical tests. Hence, lowpGS–values result from low single marker
p-valuespmof genes inGS. GSA in general does not provide any estimate of the strength of a
joint association for the set of markers or genes in question, respectively. The appeal of GSA as an analysis tool complementary to GWAS is that gene sets which are enriched with moderate association signals may be discovered, even if no individual markers within genes of theGS
demonstrate genome-wide significance.
If one aims to perform a meta-analysis across several existing GSA studies (s = 1. . .ns)
based on GWAS results, it seems straightforward simply to apply e.g. Fisher’s inverseχ2 -method [10] as a quantitative method to pool p-values (pGS,s) from independent, one-sided
tests (further denoted as simple p-pooling (SPP)) of concordant null hypotheses (direction of the test) [10]. Nevertheless, lowpGS–values can theoretically arise throughaccumulated marker
significance, in which the minor alleles of all markers are observed for example as protective factors in one study, while being seen at the same time as risk factors in another study. Thus, significance forGScan appear simultaneously in several studies without concordance of the patterns of all observed associations of markers, respectively genes, contained inGS(briefly
Hung. The German lung cancer study consists of three investigations: The sample collection of the Heidelberg lung cancer study was in part supported by grant 70-2919 from the Deutsche Krebshilfe. The work was additionally supported by a Helmholtz-DAAD fellowship (A/07/97379) and by the National Institutes of Health (USA) (U19CA148127). The KORA Surveys were financed by the Helmholtz-Zentrum München (HMGU), which is funded by the German Federal Ministry of Education, Science, Research and Technology and the State of Bavaria. The LUCY study was funded in part by the National Genome Research Network (NGFN), the DFG (BI 576/2-1; BI 576/2–2), the Helmholtzgemeinschaft (HGF) and the Federal office for Radiation Protection (BfS:STSch4454). Genotyping was performed in the Genome Analysis Center (GAC) of the Helmholtz Zentrum Muenchen. Funding for the MD Anderson Cancer Study was provided by NIH grants–P50 CA70907, R01CA121197, RO1 CA127219, U19CA148127, and CPRIT grant RP100443. Genotyping services were provided by the Center for Inherited Disease Research (CIDR). CIDR is funded through a federal contract from the National Institutes of Health to The Johns Hopkins University, contract number HHSN268200782096C. Support for the Central Europe study was provided by Institut National du Cancer, France. Support for the Central Europe study, Czech Republic, was also provided by the European Regional Development Fund and the State Budget of the Czech Republic (RE-CAMO, CZ.1.05/2.1.00/03.0101). The Central Europe study was a multicenter study conducted in seven central European countries. The following investigators are responsible for the collection of data at each of the sites: Neonila Szeszenia-Dabrowska, Jolanta Lissowska, David Zaridze, Peter Rudnai, Eleonora Fabianova, Lenka Foretova, Vladimir Janout, Vladimir Bencko, and Miriam Schejbalova.
denoted asassociation pattern). Consequently, concordance of thedirection of the test(ofpGS)
is not givena priori.
Hence, it is of vital importance to take theconcordance of association patternsbetween stud-ies into account when combiningpGS,s-values of several studies (reflectingsignificance of GSs).
Furthermore, replicatedaccumulated marker significance(lowpGS–values) alone is insufficient
to state the consistency in GSA findings in terms of the Bradford Hill criteria [11].
We propose an approach for a quantitative meta-analysis of GSA results, which we have named META-GSA. This follows the idea of an enhanced version of Fisher’s inverseχ2 -method [12], weighting each study to account for imperfect correlation between its own associ-ation patternwith anoverall association patternacross studies. Because thisoverall association patternis a hidden construct, we use principal component analysis (PCA) to determine appro-priate study weights. Doing so, the weights are neither specified nor strictly positive, as pre-sumed by the above-mentioned method. Thus the distribution of the final test statistic under the H0of“noaccumulated marker significancetakingconcordance of association patternsinto
account”needs to be derived by data permutation.
In this manuscript we outline the principle of META-GSA. We then present simulation results considering 20 different scenarios for the“pattern of true marker-phenotype associa-tion”, simulating different relative risks between 1 and 1.5 in gene sets of 10 genes. Finally, we apply META-GSA to four lung cancer GWASs from the Transdisciplinary Research in Cancer of the Lung / International Lung Cancer Consortium (TRICL / ILCCO).
Method
Notation
Assume that for several independent studiess = 1. . .nsgene-set analyses (GSA) based on the
results of GWASs have already been performed (seeFig 1). Within each GWAS, a particular association measureθm,s(e.g. odds ratio OR) for each ofm = 1,. . .,nmmarkers has been
esti-mated. Additionally, corresponding p-valuespm,sand/or test statisticsTm,sfrom two-sided
tests of no association (in the case of odds ratios the null hypothesis is: H0:θm,s= 1, the
alterna-tive hypothesis is HA:θm,s6¼1) are available. We introduce the parameterdm,sas indicator for
the direction of the point estimator ofθm,s,taking values of -1 or +1 (e.g. ofdm,s= -1 ifORm,s<1
anddm,s= +1 ifORm,s1).
Within each GSA, a common set of genesGS, identical for all studies s, was compared to another setGS`of genes, possibly all remaining genes or to a non-associated background. A gene-level statisticΓg,sfor each genegin each study s was constructed fromθm|g,s,Tm|g,sor
pm|g,s, respectively (e.g. the lowest observed marker-specific pm|g,s-value for all markers of gene
m|g). A GSA test statistic for each studyESs, e.g. an enrichment score, was calculated fromΓg,s.
Usually, p-valuespGS,s(ESs)are gained from one-sided tests of H0,s: ESs= 0 versus e.g. HA,s:
ESs>0, i.e. the alternative is an enrichment of lowpm|g,s-values of genes fromGS.
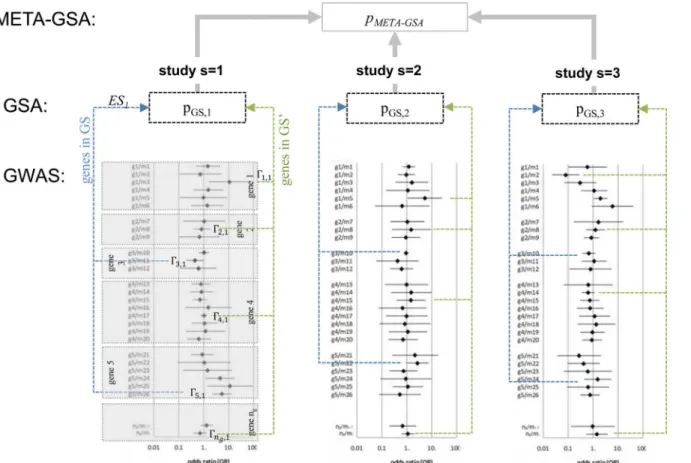
A meta-analytical approach with several levels such as markers, genes, and gene sets is nec-essarily rich in notation. Thus the relationship between GWAS, GSA, and META-GSA is sum-marized inFig 1. All the important notation is listed inTable 1.
The termnominal significanceis used to indicate significance without correcting for multi-ple testing.
Aim and principle of META-GSA
Theaimof META-GSA is to increase statistical evidence by poolingp-valuesof GSAs (pGS,s
thedirectionofθm|g,s). We only consider situations in which all studies use the same association
measure (e.g. odds ratio).
A well-knownp-poolingtechnique to combine evidence from independent one-sided tests of significance isFisher’s inverseχ2-methodor enhancements thereof [10,12,13]. Assuming a p-valuepto follow a uniform distribution, if H0is true, the sumMns ¼ 2
Xns
s¼1
lnðpsÞofns
inde-pendent tests then follows aχ2-distribution, withdf = 2nsdegrees of freedom.Mnsis
meaning-ful if and only if all related test statisticsTspoint towards the same direction in terms of the
target measure. Makambi enhanced this method by introducing pre-specified weightswsfor
each study (X
ns
s¼1
ws¼1andws>0 for alls), to account for imperfect concordance of the
direc-tion of the test[12]. More details are given inS1andS2Figs andS1 Text.
Theprincipleof META-GSA is to make use of the test statisticMns ¼ 2
Xns
s¼1
wslnðpGS;sÞby
allocating both necessary aspects (GS-significanceandconcordance of association patterns) to its parameters:
pGS,srepresentingGS-significance:
Fig 1. META-GSA: a tool for meta-analysis based on GSAs for GWASs.Genome-wide association study (GWAS); gene-set analysis (GSA); meta-analysis of GSAs (META-GSA); gene set of interest (GS, containing genes 3,5,. . .); complementary gene set (GS’, containing genes 1, 2, 4,. . .); gene-level statistic of genegand studys (Γg,s);“enrichment score”(ES) as test statistic for GSA in studys.
Testing in GSA is usually performed one-sided, thus study-specificpGS,sare used as the
p-values to be combined.
wsrepresentingconcordance of association patterns
(patterns of all or a selected number of observed marker-specific associations of markers, respectively genes, contained inGS)
PDR: A single quantity combing significance and direction of association
A core element of META-GSA is the combination of significance (p-values:pg,s) and direction (e.g.
sign of association measure) of an observed gene-specific association in a manner similar to a cor-relation coefficient, such that zero represents no evidence and the limits +1 and -1 represent strong evidence of positive or negative association. Thus we define adirected reversed p-value(PDR)
as
p0
g;s¼dg;s ð1 pg;sÞ ð1Þ
Table 1. Notation.
ns no. of studies
s = 1 to ns study
nm no. of markers
m = 1 to nm marker
r2
m,m´ measure of linkage disequilibrium between markerm andm´
ng no. of genes
g = 1 to ng gene
nm|g no. of markers assigned to gene g
θm,s association measure (odds ratio) for markerm of studys
dm,s direction ofθm,s2[−1,+1] for markerm of studys
pm,s p-value of testing e.g. H0:θm,s= 1 for markerm
pg,s p-value of a gene for gene g of studys
dg,s direction of a gene for gene g of studys
p´g,s directed reverse p-value (PDR) for geneg of studys
nGS no. of gene sets
GS = 1 to nGS gene set of interest
GS` gene set complimentary toGS
Γg,s Gene-level statistic of GSA for geneg of studys
ESGS,s test statistic of GSA for gene setGS of studys
pGS,s p-value of GSA for gene setGS of studys
Mns test statistic of META-GSA for gene setGS across studies
ppermut,GS p-value of META-GSA (nominal) for gene setGS across studies
pMETA-GSA,GS p-value of META-GSA (adjusted for multiple testing) for gene setGS across studies
There are four tests mentioned further:
SPP testing significance of simple p-pooling unconditional combination ofpGS,s
direction test testing concordance of association patterns
pooledGWAS-GSA first performing a random effects meta-analysis
for each marker and then perform a single GSA
META-GSA conditional combination of SPP and the direction
test
where
dm;s¼direction of g2f 1;þ1g ð2Þ
This definition proved superior to two alternative definitions, which are presented inS2 Text.
The workflow of META-GSA
To perform META-GSA, the following four steps are necessary to select and concentrate marker-specific information up to study-specific weightsws,to determine the null distribution
of the test statisticsMns, as well as to assess the overall significance:
step I) From the marker- to the gene-level:
Combination of significance (p-value) and direction (sign of effect estimate) to a directed reverse p-value (PDR) for each gene;
step II) From the gene-level to between-study concordance: Determination of study weights from PDRs,
step III) Performance of significance testing for a GS and step IV) Correction for multiple testing.
Although summarizing marker-specific association results is necessary as an intermediate step when performing META-GSA, it is not our aim to perform gene-level tests of association. Gene-level statistics are considered only to assess theconcordance of association patterns
between studies.
Step I: Combination of significance and direction to a PDR for each gene
Marker information is aggregate to a gene-level statistic for each gene and each study by calcu-lating PDRsp0
g;s, since often several markers are allocated to a gene. In general, there are three
possible strategies of marker selection / aggregation with the aim of calculating PDRs:
Choosing the best (most significant) marker for a gene
“Averaging”over all markers allocated to a gene
“Averaging”over only“promising”markers allocated to a gene
For META-GSA it is advisable, but not essential, to apply the same strategy of marker selec-tion / aggregaselec-tion that was used for individual GSAs.
This step, as stated previously, is solely to assess theconcordance of association patterns. This is the purpose of“PDR-profiles”, one for each study, comprising all genes in GS.
Choosing the best (most significant) marker for a gene. To choose the most significant
markerm€
sper gene asrepresentative markeris the easiest way to“aggregate”multiple marker
information to a single gene-level statistic within each study [8,14].
Gene-level significancepg,s: In such a case, the p-values for a gene (within each study) is give
straightforward:
pg;s¼minðpmjg;sÞ ð3aÞ
Gene-level direction dg,s:The determination of the directiondg,sis a bit more complicate. In
the simplest case, allrepresentative markersm€
dg,sis then the sign of the association point estimateym€;s(ifH0:θm,s= 0 as for log(odd ratio)):
dg;s¼signðym€;sÞ: ð3bÞ
If therepresentative markersm€
sare not the same, LD between these markers needs to be
taken into account to determinedg,s. As measure of choice for LD, we considerrthe correlation
between the alleles of markerm€
sandm€0s0. A motivation for this choice is given inS3 Text.
To compute the directiondg,sfor studys, we multiply then sign ofym€;swith the mean of allr
of the respective markerm€
swith those markers selected by any other studym€0s0:
dg;s¼signðym€;sÞrmjs€ ;m€0js0 ð3cÞ
Please note, if the representative markers of one studym€
sis in linkage equilibrium to any
selected marker for another studiesm€0
s0, the directiondg,s=0. Regardless of the observed
signif-icancepm€;sof this marker the PDR will getp0g;s¼0.
“Averaging”over all markers allocated to a gene. Another way to generate a single
gene-level statistic is to combine evidence for association of all markers assigned to a gene [14].
Gene-level significance pg,s: Performing the weighted Fisher inverseχ2-method for single
marker p-valuespm|g,sis one possibility. Thus the sumCg;s¼ 2
P
nmjg;s
i¼1
vilnðpi;sÞis calculated and
a p-valuepg,sis derived from aχ2-distribution. Weightsvm|g,sare assigned to markers in order
to account for pairwise LD and the LD-block structure, respectively. For mSUMSTAT [15] or SLAT [16] permutation approaches to determine these marker weights were previously pro-posed, but these are time consuming. Instead we choosevm|g,sproportional to the inverse of the
sum ofr2across any pair of markers in the same LD-block:vmjg¼1=
P
m0r 2
m0jg;mjg(m´
indicat-ing any marker within the same LD-block). Thus the sum of marker weights∑g,svm|g,sis equal
to the“number of independent markers”which also defines the degrees of freedom for the con-sideredχ2-distribution.
Hence, the p-values for a gene (within each study) is, in contrast toEq 3a, a function of all markers:
pg;s¼fmjgðpmjg;sÞ ð4aÞ
Gene-level direction dg,s: The directiondg,sis simply determined as the weighted mean of
marker specific direction (as calculated accordingEq 3c), using the same marker weightsvm|g,s
as before:
dg;s¼
Pnmjg
i¼1vmjg;ssignðyi;sÞ ð4bÞ
“Averaging”over only“promising”markers allocated to a gene. The same procedures
as just explained can be applied restricted to“promising”markers (e.g. filtered forpm|g,s<0.05).
Re-orientate the gene-level directionsdg,sacross studies. To be able to calculated
compa-rable PDRs, one needs to re-orientate these gene-level directionsdg,salong a“profile of
refer-ence directions”, represented by the mean of directions across studies for each gene:
dg; ¼
1
ns
Pns
s¼1dg;s. In the case thedg;is negative for a geneg, alldg,s(direction within a study)
are multiplied with -1, to ensure a positive value indicating, that a marker is pointing towards the reference direction (mean of all studies).
As soon as the directiondg,sand the significancepg,sof all genes and for each study are
deter-mined, PDR-valuesp0
only) in a vector of observed gene-phenotype associationsp0GS;s¼ ðp0gjGS;sÞ. It is important to
note that a true“PDR-profile”of theGSof interest is unknown. The average profile is used as reference instead.
Step II: Determination study weights
w
sfrom rank correlations of PDRs
Determination of the rank correlation of PDRs between studies. Next, we have to
quan-tify the pairwise concordance of observedPDR-profilesbetween studies. For this, we simply cal-culate all pairwise correlationsτs,s’.
Regardingp0
g;sas a function of the true associationθm,s, the sample sizenm,s, perhaps
popula-tion stratification, and thefitted statistical model, PDRs may be“scaled”differently between studies. Hence, we propose applying Kendall’sτ. Alternative correlation measures were also investigated (seeS2 Text).
Deriving study weightswsby principal component analysis. Once the correlation matrix
is found, we use principal component analysis (PCA) to determine the load of each study on a common but unknown generalPDR-profileof theGS. We assume that these loads can be repre-sented by the first principal component (PC1s). The corresponding eigenvalue (EV1) isns
-times the fraction of the variance accounted for byPC1s. Only in the case of perfect pairwise
correlation between (totalconcordanceof) PDR-profilesp0GS;sbetween all studiess, this
propor-tion will be 1 and henceEV1=n2andPC1s=1. We interpret the fractionEV
1
ns as“effective num-ber of studies”.
Finally, a study weightwsis calculated as the product of thenormalized loadand theeffective
number of studies(= fraction of explained variance):
ws¼PPC1s ns j¼1PC1j
EV1
ns
ð5Þ
This satisfies the condition that the sum of weights is equal to theeffective number of studies: Pns
s¼1ws¼ EV1
ns . However this does not satisfy Pns
s¼1
ws¼1and1ws0for allsas would be
nec-essary for Makambi’s enhancement of Fisher’s inverseχ2-method.
Step III: Performing significance testing
The assumption that the test statisticMnsasymptotically follows aχ
2-distribution is based on a
few conditions: The p-values are independent, identically distributed (iid), and follow a uni-form distribution under H0. The weightswsare pre-specified, range between 0 and 1, and sum
up to one (Pns
s¼1ws¼1andws0for all s). Thus the test statisticMnsis strictly non-negative: Mns 0.
Since the assumptions forwsandMnsare not fulfilled, the null distribution of the test
statis-ticM0needs to be determined by a permutation procedure, permuting the allocation of genes
toGS(to determinews) and drawingpGS,s-values by random from a uniform distribution. The
statistical significance is expressed by the permutation p-valueppermute,GS, which is assessed by
the fraction of permutations achieving a test statisticMj(j = 1 to x) at least as extreme as the
non-permuted (original) test statistic M0. Details and techniques to reduce the computational
Step IV: Correction of multiple testing
Correction for multiple testing is required if several GSs have been investigated. Because a sin-gle genes can appear across multiple gene sets and genes can be in LD to each other,ppermut,GS
-values are maybe not independent. Application of a Bonferroni orŠidák adjustment for
multi-ple testing would lead to overcorrection. We propose applying the bootstrap method of Storey and Tibshirani [17,18] to estimate the proportion of true null hypothesesπ0and use this in a
Bonferroni-like manner to correct p-values for eachGS:
pMETA GSA;GS¼minð1;p
permute;GSnGSp0Þ ð6Þ
Details of howπ0is derived are given inS6 Text.
Simulation
Method
We performed power simulations in order to compare the performance of META-GSA and the simple p-pooling of GSA results. To this end, we set up 20 different scenarios for“patterns of true marker-phenotype associations”investigated by GSAs based on GWAS data in two to ten studies (seeTable 2). For simplicity, we assumed only one genotyped marker for each gene.
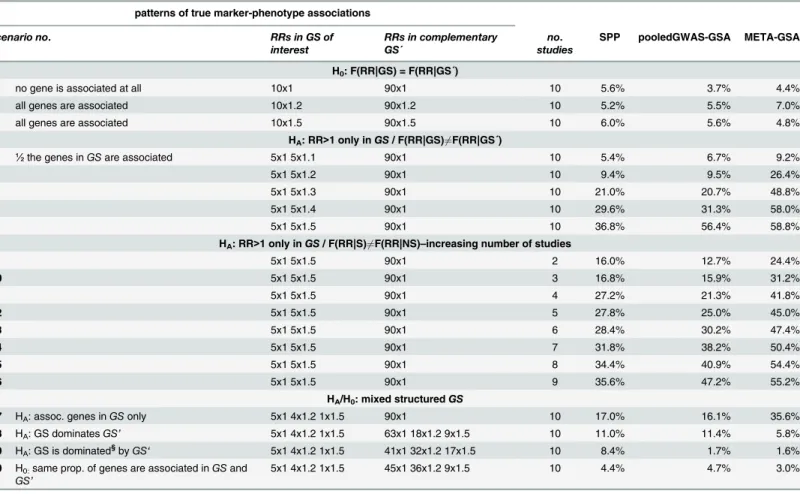
Table 2. Power of META-GSA, pooledGWAS-GSA and SPP across all studies, based on 100 genes with 1 marker each.
patterns of true marker-phenotype associations
scenario no. RRs in GS of
interest
RRs in complementary GS´
no. studies
SPP pooledGWAS-GSA META-GSA
H0: F(RR|GS) = F(RR|GS´)
1 no gene is associated at all 10x1 90x1 10 5.6% 3.7% 4.4%
2 all genes are associated 10x1.2 90x1.2 10 5.2% 5.5% 7.0%
3 all genes are associated 10x1.5 90x1.5 10 6.0% 5.6% 4.8%
HA: RR>1 only inGS/ F(RR|GS)6¼F(RR|GS´)
4 ½the genes inGSare associated 5x1 5x1.1 90x1 10 5.4% 6.7% 9.2%
5 5x1 5x1.2 90x1 10 9.4% 9.5% 26.4%
6 5x1 5x1.3 90x1 10 21.0% 20.7% 48.8%
7 5x1 5x1.4 90x1 10 29.6% 31.3% 58.0%
8 5x1 5x1.5 90x1 10 36.8% 56.4% 58.8%
HA: RR>1 only inGS/ F(RR|S)6¼F(RR|NS)–increasing number of studies
9 5x1 5x1.5 90x1 2 16.0% 12.7% 24.4%
10 5x1 5x1.5 90x1 3 16.8% 15.9% 31.2%
11 5x1 5x1.5 90x1 4 27.2% 21.3% 41.8%
12 5x1 5x1.5 90x1 5 27.8% 25.0% 45.0%
13 5x1 5x1.5 90x1 6 28.4% 30.2% 47.4%
14 5x1 5x1.5 90x1 7 31.8% 38.2% 50.4%
15 5x1 5x1.5 90x1 8 34.4% 40.9% 54.4%
16 5x1 5x1.5 90x1 9 35.6% 47.2% 55.2%
HA/H0: mixed structuredGS
17 HA: assoc. genes inGSonly 5x1 4x1.2 1x1.5 90x1 10 17.0% 16.1% 35.6%
18 HA: GS dominatesGS’ 5x1 4x1.2 1x1.5 63x1 18x1.2 9x1.5 10 11.0% 11.4% 5.8%
19 HA: GS is dominated§byGS‘ 5x1 4x1.2 1x1.5 41x1 32x1.2 17x1.5 10 8.4% 1.7% 1.6%
20 H0:same prop. of genes are associated inGSand
GS’
5x1 4x1.2 1x1.5 45x1 36x1.2 9x1.5 10 4.4% 4.7% 3.0%
Given a true type I error of 5%, the observed type I error may range from 3% to 7% (95% random dispersion interval for 500 simulations). Given a true power of 50%, the observed power may range from 45% to 54% (95% random dispersion interval for 500 simulations).
§Truly associated genes are more frequent in GS
’than in GS.
These patterns comprised the following situations (H0and HAare expressed according to a
competitive test strategy):
1. H0: no enrichment in theGSof interest: F(RR|GS) = F(RR|GS´) scenarios 1–3
2. HA: markers with RR>1 only inGS: F(RR|GS)6¼F(RR|GS´) scenarios 4–16
3. HA/H0: mixed structured gene sets (markers with RR6¼1 inGSandGS’) scenarios 17–20
where F(RR|GS) is the cumulative distribution function of“true”relative risks (RR) of mark-ers/genes inGS. For example, in scenario 1 the true relative risk (RR) of all markers was set to RR = 1, in scenario 2 to RR = 1.2. Both scenarios represent a H0situation for a competitive test
strategy. In scenario 5 we assumed RR = 1.2 for half of the markers ofGSand a RR = 1 for the other half and all of the markers ofGS´. Not necessarily the same markers ofGSneeded to be truly associated in each study. However, a true association only appears in genes belonging to the gene set of interest, which is an idealized situation for the competitive test strategy.
To complete each simulation run, we needed to perform the following steps:
For theMA stepwe considered samples of 500 cases and 500 controls. The minor allele fre-quencies of all markers were set to 30%. The distribution of the genotypes was assumed to be in Hardy-Weinberg Equilibrium (HWE). The prevalence of a binary phenotype in the population was set to 5%. The relative risk was pre-specified and ranged between 1.0 and 1.5. The direction of an association was chosen randomly, assuming both directions as being equally likely.
In theGWAS stepwe considered 100 genes with one genotyped marker each. For each of these 100 markers, we performed a two-sided Armitage trend test, yieldingpm,s-values and
fit-ted log-additive models to determine the direction of observed association (dm,s= +1 if OR1
anddm,s= -1 if OR<1). Markers strongly deviating from HWE in controls (pm,s<1×10⁻⁷) were
excluded from further analysis.
In theGSA step,we applied a one-sided Wilcoxon’s rank-sum test [19] to investigate enrichment of lowpm,s-value inGS(yieldingpGS,s). The gene setGSunder investigation always
consisted of 10 genes, the remaining 90 genes were considered asGS’.
In theMETA-GSA step,marker-specificpm,s-values and directionsdm,swere subsequently
combined to PDR-values. Finally, we determined gene-set-specificpGS,s-values. There was no
need to correct for multiple testing because we only regarded a singleGS.
Subsequently and for the purpose of comparison, we simply summarizedpGS,s-values
apply-ing Fisher’s inverseχ2-method topSPP-values.
As an alternative approach, one may consider a so-called mega-analysis (individual partici-pant data meta-analysis) directly based on all participartici-pants’geno- and phenotype data, if or when available, as gold standard. Advantages of such an approach would be the use of only one statistical model throughout the analysis, the inclusion of available unpublished data, a larger sample size that allows subset analysis, the avoidance of ecological bias, and potentially higher power [20,21]. However, it has been demonstrated mathematically that summarizing sum-mary results, i.e. performing a meta-analysis for main effects of each marker, is as efficient as pooling genotype data, i.e. performing a mega-analysis for each marker, if no covariates are
MA step: simulate marker association
GWAS step: perform GWAS
GSA step: perform GSA
META-GSA step: perform META-GSA and SPP
considered [22]. This is similarly true for investigations of gene x environment interactions [23]. In addition, limitations associated with mega-analysis need to be dealt with, such as ethics or confidentiality constraints in sharing study data, comparable data quality and completeness, or sufficient system capacity for storage and transfer. Analyzing studies separately and summa-rizing their results in a meta-analysis also enables adjustment for different sets of covariates for different studies, as well as allowing for heterogeneous genetic effects between studies [24].
Since the single marker associations of all studies are available (which is a prerequisite for META-GSA), we also accomplished a random effects meta-analysis for each marker and then performed a single GSA (denoted as pooledGWAS-GSA) for the purpose of comparison with META-GSA and SPP. Thus the combining of studies is switched to the level of markers, respectively genes. This approach is located halfway between an individual participant data meta-analysis and an aggregate study-level data meta-analysis.
We considered 500 simulations for each scenario. The percentages ofpMETA-GSA-values,
ppooledGWAS-GSA-values orpSSP-values lower than the level of significance of 5% were used as
power for the respective test. Given a true type I error of 5%, the observed type I error may range from 3% to 7% (95% random dispersion interval for 500 simulations).
An overview of the scenarios, the achieved type I error, and power is presented inTable 2.
Type I error
As expected, in about 5% of the simulations, aGSis falsely discovered when the pattern of asso-ciation does not differ betweenGSandGS’(scenarios 1–3). Any observed type I error is within random variation according to the number of simulations. However, in the case of mixed struc-tures with risk markers inGSandGS’(scenario 20), SPP, pooledGWAS-GSA and META-GSA seem to be conservative (type I error ranges between 2.6% and 4.8%).
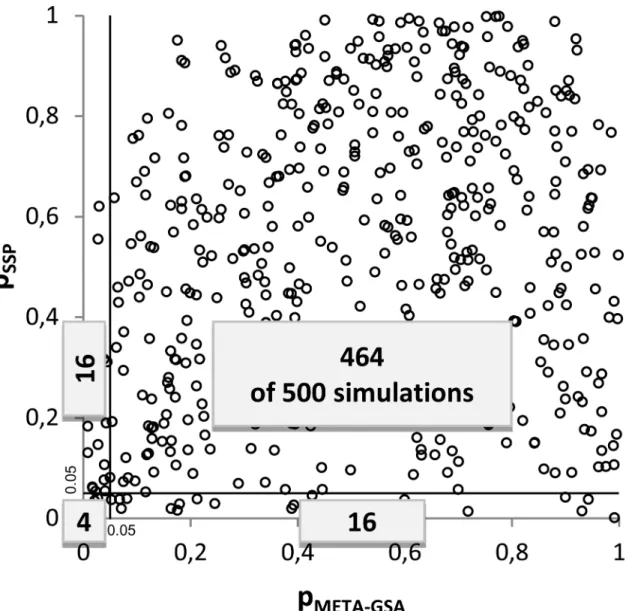
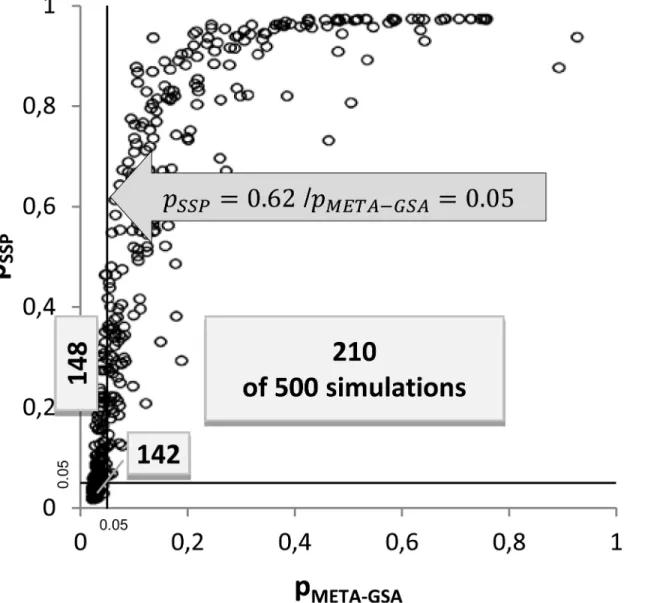
Interestingly, there seems to be almost no systematic overlap in discoveredGSsbetween META-GSA and SPP. For example, in scenario 1 theGSwas falsely discovered in 20 simulation runs by each approach. However,GSwas concordantly discovered by META-GSA and SPP in only four runs (seeTable 3). Furthermore, almost no correlation betweenpMETA-GSAandpSPP
was observed (seeFig 2). False-positive gene sets found by META-GSA and SPP only partially overlap. We assume that this may result at least in part from respecting theconcordance of association patterns.
Power
Next, we consider those scenarios in which patterns of association differ betweenGSandGS’
(scenarios 4–19). The power of a META-GSA exceeded that of SPP in all considered scenarios, that of a pooledGWAS-GSA was always in between. Only in the presence of stronger marker-specific associations (e.g. true RR = 1.5) and a larger number of studies (scenarios 8, 15, and 16) were pooledGWAS-GSA and META-GSA comparable in terms of power.
For example, the simulated power of META-GSA was almost 60% if five markers with a true RR = 1.5 belong toGS(scenario 8). For SPP, we achieved a power of only 37% and a power of 56% for a pooledGWAS-GSA in the same scenario. TheGSwas identified by META-GSA in 294 out of 500 runs, while SPP identified theGSin only 184 of those 294 runs (approximately two out of three runs). In every simulation run in which META-GSA failed to identify theGScorrectly, SPP also failed (seeTable 3). Using SPP, the largest p-value found in these 294 runs waspSPP=0.62,
Regarding scenarios 4 to 8, we found that the moreGSdiffers fromGS’, the larger the bene-fit becomes in terms of power of META-GSA compared to SPP.
Finally, we simulated three patterns with varying associations in both gene setsGSandGS’
(scenarios 17–19). Note that a third to a half of all the genes inGS’were set to be associated, which is an extremely and unrealistically high proportion. We found a remarkable loss of power if theGSof interest is dominated by other gene sets inGS’, meaning that truly associated genes are more frequent inGS’than inGS(scenario 19). The power of a META-GSA even falls below the level of significance, as was the case for a pooledGWAS-GSA. This was to be expected, since we simulated according to the“competitive hypothesis”. SPP behaves better in such a scenario. However, a demonstrated power of 8% is far from promising though.
Application: GO-Pathways and Lung Cancer
Previous comparison of GSA methods
Data from four case-control GWASs of lung cancer risk were previously implemented [15] to compare the performance of four different GSA approaches: EASE [3], GenGen (developed from GSEA) [8], SLAT [16], and mSUMSTAT [15] a modification of the SUMSTAT approach [25]. The lung cancer cases and controls were taken from the Central Europe Study [26], a
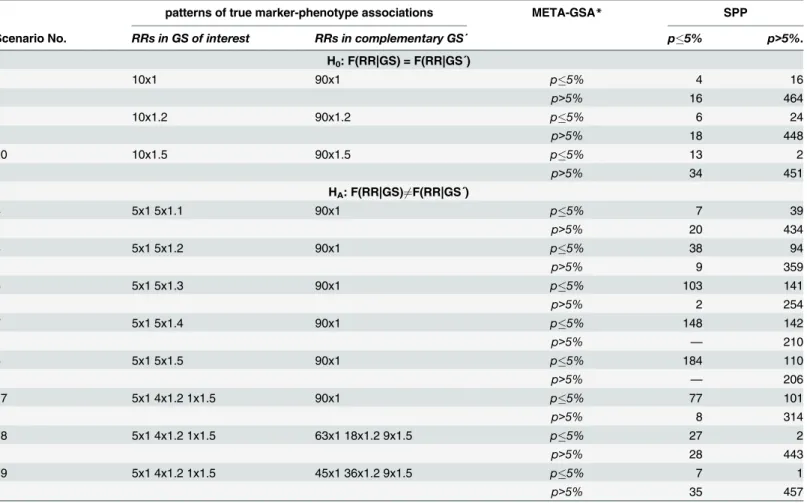
Table 3. Comparing the number of significant findings of META-GSA with SPP in selected scenarios.
patterns of true marker-phenotype associations META-GSA* SPP
Scenario No. RRs in GS of interest RRs in complementary GS´ p5% p>5%.
H0: F(RR|GS) = F(RR|GS´)
1 10x1 90x1 p5% 4 16
p>5% 16 464
2 10x1.2 90x1.2 p5% 6 24
p>5% 18 448
20 10x1.5 90x1.5 p5% 13 2
p>5% 34 451
HA: F(RR|GS)6¼F(RR|GS´)
4 5x1 5x1.1 90x1 p5% 7 39
p>5% 20 434
5 5x1 5x1.2 90x1 p5% 38 94
p>5% 9 359
6 5x1 5x1.3 90x1 p5% 103 141
p>5% 2 254
7 5x1 5x1.4 90x1 p5% 148 142
p>5% — 210
8 5x1 5x1.5 90x1 p5% 184 110
p>5% — 206
17 5x1 4x1.2 1x1.5 90x1 p5% 77 101
p>5% 8 314
18 5x1 4x1.2 1x1.5 63x1 18x1.2 9x1.5 p5% 27 2
p>5% 28 443
19 5x1 4x1.2 1x1.5 45x1 36x1.2 9x1.5 p5% 7 1
p>5% 35 457
*Applying Kendall’s correlation coefficient
study of the Lunenfeld-Taneberg Research Institute / Toronto [26], the German Lung Cancer Study [27,28], and a study of the MD Anderson Cancer Center / Texas (MDACC Study, non-small cell lung cancer cases and controls) [29]. This research was granted a renewed protocol approval from the Dartmouth Committee for Protection of Human Subjects on 7/30/2014 with id STUDY00023602. The specific protocol for this research covers meta-analysis of data from several studies for which participants previously signed consent documents and for which genome-wide association studies have already been completed. The current research covers the combination of data across studies. These studies are shared amongst members of the Transdisciplinary Research in Cancer of the Lung / International Lung Cancer Consortium (TRICL / ILCCO). Data from these four studies were combined into two data sets: 1) Central Europe and Toronto (CETO); and 2) Germany and MDACC (GRMD), in order to create ade-quate sample sizes and statistical power to detect associations in the pathway analyses. More details on the studies are provided by Fehringer et al. [15].
Fig 2. Correlation ofpMETA-GSAandpSPPin scenario no. 1.The numbers of simulations out of a total of 500 are depicted. Gene sets are classified as significant (p0.05) or not significant using SPP and META-GSA.
In summary, the genotypic information from 8,542 individuals (3,897 cases and 4,646 con-trols) was used. Genotyping of more than 300,000 SNPs assigned to about 18,000 genes was performed using either the Illumina HumanHap300 or HumanHap550 chips. In total, 7,163 genes were assigned to at least one of 421 GO level 4 pathways (obtained from the GenGen website), comprising 15 to 200 genes to avoid testing overly large or small gene sets. Only a sin-gle gene set (GO0015464: acetylcholine receptor activity) was found nominally significant in both data sets by two of the four GSA methods. Some biological interpretation of how acetyl-choline receptor activity can influence the risk for lung cancer was given [15].
The resulting files, containing p-values according to gene set and method as well as SNP-to-gene assignment, SNP-to-gene-to-pathway assignment, and SNP-wise association, were the same as used previously. The only information needed which had not been used previously was the LD measure between markers within genes to homogenize PDRs. These quantities were therefore estimated based on a sample of 484 Caucasians used as controls in the German Lung Cancer
Fig 3. Correlation ofpMETA-GSAandpSPPin scenario no. 8.The numbers of simulations out of a total of 500 are depicted. Gene sets are classified as significant (p0.05) or not significant using SPP and META-GSA.
Study. All controls were genotyped for 561,466 SNPs using the Illumina Sentrix Human-Hap550 Beadchip. How we corrected for multiple testing is outlined inS6 Text.
Results
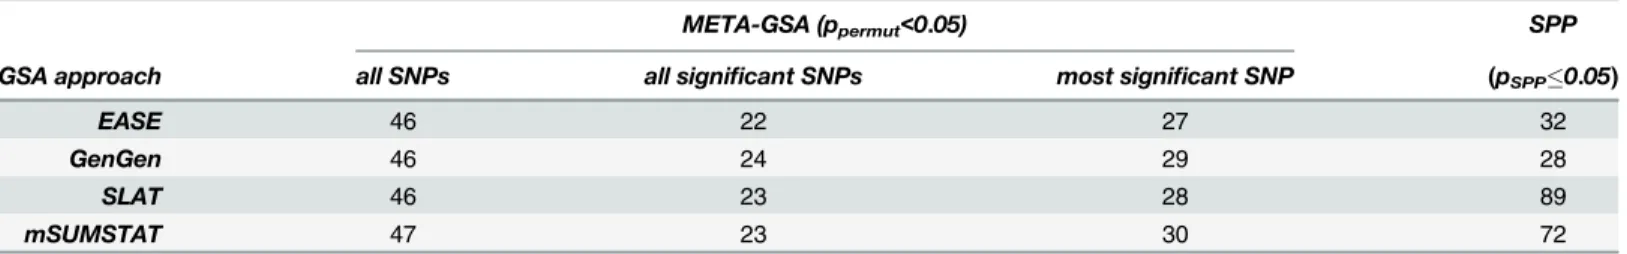
At the nominal level of significance ofα= 5%, 30 out of all 421 gene sets were found to be sig-nificant according toppermutby at least one of the GSA methods (EASE, GenGen, SLAT,
mSUMSTAT), when only the most significant marker was selected to determine concordance of the direction of association. Remarkably, 26 gene sets thereof were identified irrespective of which GSA approach was chosen. In contrast, 134 pathways would have been identified as nominally significant by at least one of the GSA methods when using SPP and only 8 by all of the methods. This impressively demonstrates the selective character of META-GSA. Moreover, a strong variation in the number of nominally significant gene sets between GSA methods was observed when analyzed by SPP (28 to 72 gene sets). This maybe can be attributed to the prin-ciples of the applied GSA methods. EASE or GeneGen are based on the count of genes classi-fied assignificantornot significant. Analyzed by SPP the number of nominal significant gene sets are 32 or 28, respectively. SLAT an mSUMSTAT make use of the magnitude of single marker significance (p-values orχ2-values). Analyzed by SPP the number of nominal signifi-cant gene sets are 89 or 72, respectively.
Applying META-GSA, results were consistent irrespective of which GSA method was used. Using all SNPs at a gene, 46 to 47 gene sets were nominally significant; using only significant SNPs at each gene, 22 to 24 gene sets appeared nominally significant. Using the most signifi-cant SNPs for each gene, the number of signifisignifi-cant gene sets lay in between (27 to 30 gene sets, seeTable 4). This demonstrates that META-GSA substantially reduces the influence of the GSA method applied on the final results. On the contrary, the dependency of SPP on the GSA method applied can clearly be demonstrated for GO0015291, for whichpSPP, adjusted for
mul-tiple testing ranges, from 0.0003 to 1.0. Further details demonstrating the inhomogeneity between GSA-methods and the homogenizing effect of META-GSA are given inS7 Text.
The homogenizing effect of META-GSA can also be demonstrated by the strong pairwise rank correlations between thepMETA-GSA-values of the GSA-methods, when using the most
sig-nificant SNP to determine concordance (ρ>0.85) in contrast with only moderate correlations regardingpSPP-values (ρ0.5; seeTable 5).
A comparison here with pooledGWAS-GSA cannot be made, since gene set analyses were previously applied to the presented data only for each study, but not for a pooled GWAS.
Using all markers allocated to a gene to determine concordance and applying the GSA approach EASE revealed GO-pathway GO0015291 (“transmembrane transporter activity”) to be significantly enriched with associated genes (ppermut= 0.0001;pMETA_GSA=0.315). When
GSA was performed using another method, significance was reached nominally (ppermut
0.001) but not when adjusted for multiple testing (pMETA_GSA0.2). In comparison with
META-GSA, even nominal significance was missed applying SPP. For the previously identified
Table 4. META-GSA vs. SPP: Number of nominally significant gene sets by GSA methods.
META-GSA (ppermut<0.05) SPP
GSA approach all SNPs all significant SNPs most significant SNP (pSPP0.05)
EASE 46 22 27 32
GenGen 46 24 29 28
SLAT 46 23 28 89
mSUMSTAT 47 23 30 72
gene set GO0015464 [15], we achieved almost the same nominal ppermut-values as for
GO0015291 and across GSA methods.
Discussion
It is increasingly recognized that GSA can extend GWAS approaches by incorporating existing knowledge of biological processes, with the aim of identifying disease-related pathways. GSA has gained great popularity and several approaches have been proposed. Although the pros and cons have been discussed [9,19] and points to improve have been formulated [30], it has only been mentioned that there is a need to replicate pathway association findings to avoid false positive results [30]. According to our knowledge, there is no formal method to combine the results of several GSAs. The basic criticism on applying simple p-pooling (SPP) is a lack in interpretability of results when single markers differ in their attributed role as risk or predictive factor. Here we propose the quantitative approach META-GSA to combine such results, respectivelyGS-significance, by incorporatingconcordanceof single-markerassociation pat-ternsbetween studies, relevant for theGSof interest.
The main steps of META-GSA are first to determine theconcordance of association patterns; second, to use these to derive a weight for each study; and third, to apply a weighted version of Fisher’s inverseχ2-method to summarize significance of GSAs in a single meta-analytical p-value. Thussignificanceof GSA-results andconcordanceof single-marker association are com-bined. META-GSA can be further considered as a conditional approach, testingGS-significance
conditional to, or in the presence ofconcordance of association patterns.
Since the mathematical conditions of the weighted version of Fisher’s inverseχ2-method are not fulfilled, the application of a CPU-intensive permutation procedure is required. Thus we investigated the effort and benefits of META-GSA in comparison with SPP, which is fast but does not addressconcordance of association patternsin any way. Both methods keep type 1 error at the specified level. However, under H0the results of META-GSA and SPP were found
to be almost uncorrelated. We believe this to be down to addressing or ignorance of the concor-dance of association patterns, respectively. Moreover, META-GSA was found to be more pow-erful than SPP. The greater the number of studies combined, the larger the advantages in power became. The gain in power can be clearly attributed to the fact that META-GSA is more efficient at separating the“wheat from the chaff”for gene sets in terms of false replicate find-ings whenconcordance of association patternsis not given. Given a unique truly associated gene set, META-GSA successfully yielded a significant result twice out of 3 times, whereas SPP failed to find even one of these two significant results.
We also compared META-GSA to a pooledGWAS-GSA approach. For the latter, the com-bining of studies is switched to the level of markers, followed by a single GSA performed on the pooled marker-specific associations. In general, we found META-GSA to outperform pooledG-WAS-GSA. This is similar to the fact that a mega-analysis does not outperform a meta-analysis when testing for single marker association [22]. One further advantage of META-GSA is the
Table 5. Rank correlation of p-values comparing GSA methods (best SNP approach).
META-GSA SPP
GenGen SLAT mSUMSTAT GenGen SLAT mSUMSTAT
EASE 0.93 0.88 0.93 0.54 0.40 0.55
GenGen 0.90 0.95 0.52 0.73
SLAT 0.90 0.70
mSUMSTAT
fact that heterogeneity in the strength of association for single markers or genes, respectively, between studies does not necessarily cause lower power, as long as other genes belonging toGS
compensate such deficiency.“Between-study heterogeneity. . .can offer valuables insight for
further clarification of gene-disease associations”[31].
Furthermore, META-GSA is applicable to any GSA method selected, even those using indi-vidual participants’genotype data, which may prove to be more suitable and more powerful than methods based on GWAS summary results (pooledGWAS-GSA) [2,32]. Resting the GSA on common effect estimates can become critical in the case of strong study heterogeneity for few or many markers, since the existence of a common marker-specific association in such a situation is doubtful. For META-GSA, study heterogeneity results in low concordance of the patterns of study-specific association estimates and subsequently in low study weights, which simply reduces the power, however without violating such a critical assumption.
Nevertheless, the simulations were configured to compare a gene set of interest to all other genes. If the investigated gene set is truly dominated by other, containing more strongly associ-ated genes, the simulation revealed META-GSA as performing poorly, although META-GSA is not based on the so-called“competitive hypothesis”. This disadvantage is related to the genetic architecture of complex diseases that always needs to be taken into account when performing pathway analysis [1,9]. GSA is likely to be informative if the interplay of hundreds of genes in pathways contributes to the susceptibility to a disease or trait. In the presence of a single, strongly associated gene, GSA methods may be of less interest to research that addresses the
“competitive hypothesis”. However, such a drawback can be obviated by e.g. excluding such genes and other genes of already identified pathways from the analysis. GSA methods address-ing the“self-contained hypothesis”are said to be more appropriate, as is the case in studies lim-ited to candidate genes. Note that META-GSA is applicable to both types of hypotheses underlying a GSA. META-GSA, however, has only limited use for pleiotropic investigation, since concordance of gene effects between all studies is regarded as important. This matters when considering only one outcome entity. Summarizing genetic associations with distinct but putatively related traits, one may allow susceptibility loci to be associated in subsets or in differ-ent directions for differdiffer-ent traits [33].
Applying META-GSA to (only) two independent GWAS/GSA investigations into lung can-cer revealed that META-GSA is more robust than SPP compared to the previously used GSA method. Furthermore, we discovered a positive relationship between the sufficiency in con-densing single-SNP information to a gene-level statistic and the likelihood of identifying a related gene set. Nevertheless, this observation is related to the general discussion of how to condense SNP information within a gene, addressing LD structures, gene size and length, over-lapping genes, or the statistical method applied [1,9,30].
All the same, META-GSA has some critical points that need to be mentioned. First, it is nec-essary to estimate LD between neighboring markers to be able to calculate PDRs of differing markers across studies. However, patterns of LD in the human genome are said to be noisy, they vary from region to region, and are difficult to determine for broadly defined ethnicities such as Caucasians, Africans, and Asians. For example, LD in non-African populations extends over longer genomic distances than in Africans [34]. Since it is known that LD-patterns in human subpopulations are different [35], this can be problematic if one aims to combine results across different ethnicities or if the source population of a study is known to be admixed. To circumvent the problem of multiple ethnicities, we considered only studies of Caucasians in our analysis.
adaptive rank truncated product method (ARTP)[38], or any approach for that matter, in which the number of true null hypotheses [39] is estimated. Any of these methods could have been implemented instead. The pros and cons of several methods have been discussed else-where [36–39].
Thirdly, the use of a permutation procedure is time and CPU-intensive. We therefore devel-oped a“quick but dirty”test to avoid the computational burden caused by unnecessary permu-tations. This test consists of a marginal combination of significance andconcordance of association patterns(details are given inS8 Text). However, we must recognize that the ability to sort out only“bad candidate gene sets”for the permutation was fairly limited. That said, we could speed up the program by implementing early-stopping rules. That again also means that the resulting p-values are insufficiently approximated and imprecise, in particular for gene sets clearly not significant.
Fourthly, p-values are the only results. As with most GSA approaches META-GSA does not deliver any effect estimation.
Fifthly, gene-set analysis results are often prone to sources of bias including a) unequal gene set size, a) LD patterns and c) overlapping genes [6,30,40]. To be robust against a) and b) mul-tiple comparison procedures, such as Sidak's correction [6]; decorrelation tests [5]; or omnibus tests, such as Fisher’s inverse Chi2-method (e.g. SLAT [16]) are used. To be robust against a), b) and c) permutation procedures (e.g. ALIGATOR [41]) or single model approaches compris-ing all SNPs allocated to a gene-set and correctcompris-ing for the number of effective markers (e.g. ker-nel methods[32]) can be used. An additional source of bias results from d) low resolution knowledge bases. To perform GWASs and GSAs one needs to annotate SNPs to genes which are annotated to pathways in a static way, referring to public databases. In contrast, genes act dynamically and may have for instance several transcripts which can be active or passive in a certain pathway. Thus, a static annotation maybe doesn’t matches well to a dynamic biological process. Furthermore, e) both SNP-to-gene as gene-to-pathway annotation databases reflect at the best the state of knowledge and should therefore considered as incomplete (to an unknown degree). Because GSA methods, as they have been proposed, use genomewide genotype data therefore are f) unable to model dynamic response of a gene in the course of disease develop-ment. In the same they are g) limited to model response to external stimuli [40]. These addi-tional sources of bias (d-g) affect all GSA approaches. Hence, META-GSA is concerned (biased) to the same extend as the GSA approaches aimed to be combined.
All in all, we demonstrate that META-GSA may be a powerful add-on tool in the research of the genetic architecture of complex traits or diseases. One can attribute its benefit to the incorporation of the concordance of single-marker association into the test statistics.
All programs were implemented in SAS 9.3 (SAS Institute, NC, USA) and are provided as
S11 Text.
Supporting Information
S1 Fig. Graphical representation of Fisher’s p-pooling method for independent and
identi-cal target measures.The test statisticMis thesum of -2ln(ps) for s = 1 to nsstudies, which
fol-lows aχ2-distribution, assuming all tests point towards the same (common) direction (identical target measures). Note: the lower the p-value, the higher the statistical evidence and the longer the arrow.
(TIF)
S2 Fig. Graphical representation of Makambi’s weighted p-pooling method for different,
hence imperfect correlated target measures.The test statisticMis thesum of -2wsln(ps) for
of the target measures. No study points towards a common direction. (TIF)
S1 Text. Details Chi2method.
(DOCX)
S2 Text. Alternative PDRs.
(DOCX)
S3 Text. Between marker LD.
(DOCX)
S4 Text. Significance testing.
(DOCX)
S5 Text. Speeding up the permutation.
(DOCX)
S6 Text. Correction for multiple testing.
(DOCX)
S7 Text. Comparison META-GSA with SPP.
(DOCX)
S8 Text. A quick but dirty test.
(DOCX)
S9 Text. PRISMA Checklist.
(DOCX)
S10 Text. PRISMA flow diagram.
(DOCX)
S11 Text. META-GSA routines.
(7Z)
Acknowledgments
We would like to thank all the individuals who participated in the four studies, as well as the patients’physicians, who made this meta-analysis possible. We would like to thank all the researchers involved in the four studies and who made their data available to us.
Author Contributions
Conceived and designed the experiments: A. Rosenberger. Performed the experiments: A. Rosenberger. Analyzed the data: A. Rosenberger SF GF. Contributed reagents/materials/analy-sis tools: CA PB JH RH TM MMN A. Risch HB. Wrote the paper: A. Rosenberger HB.
References
1. Wang K, Li M, Hakonarson H. Analysing biological pathways in genome-wide association studies. Nature reviews Genetics. 2010; 11(12):843–54. doi:10.1038/nrg2884PMID:21085203.
2. Ramanan VK, Shen L, Moore JH, Saykin AJ. Pathway analysis of genomic data: concepts, methods, and prospects for future development. Trends in genetics: TIG. 2012; 28(7):323–32. doi:10.1016/j.tig. 2012.03.004PMID:22480918; PubMed Central PMCID: PMC3378813.
4. Lewinger JP, Conti DV, Baurley JW, Triche TJ, Thomas DC. Hierarchical Bayes prioritization of marker associations from a genome-wide association scan for further investigation. Genet Epidemiol. 2007; 31 (8):871–82. PMID:17654612
5. Luo L, Peng G, Zhu Y, Dong H, Amos CI, Xiong M. Genome-wide gene and pathway analysis. Euro-pean journal of human genetics: EJHG. 2010; 18(9):1045–53. doi:10.1038/ejhg.2010.62PMID:
20442747
6. Peng G, Luo L, Siu H, Zhu Y, Hu P, Hong S, et al. Gene and pathway-based second-wave analysis of genome-wide association studies. European journal of human genetics: EJHG. 2010; 18(1):111–7. doi:
10.1038/ejhg.2009.115PMID:19584899
7. Sohns M, Rosenberger A, Bickeboller H. Integration of a priori gene set information into genome-wide association studies. BMC Proc. 2009; 3 Suppl 7:S95. doi:10.1186/1753-6561-3-S7-S95PMID:
20018092
8. Wang K, Li M, Bucan M. Pathway-based approaches for analysis of Genomewide Association Studies. Am J Hum Genet. 2007; 81(6).
9. Fridley BL, Biernacka JM. Gene set analysis of SNP data: benefits, challenges, and future directions. European journal of human genetics: EJHG. 2011; 19(8):837–43. doi:10.1038/ejhg.2011.57PMID:
21487444
10. Petitti DB. Meta-analysis, decision analysis, and cost-effectiveness analysis methods for quantitative synthesis in medicine. New York: Oxford University Press; 2000.
11. Rothman KJ, Greenland S. Modern epidemiology. 1998;2. ed.
12. Makambi K. Weighted inverse chi-square method for correlated significance tests. Journal of Applied Statistics. 2003; 30(2):225–34.
13. Hedges LV, Olkin I. Statistical methods for meta-analysis. 1985.
14. Lehne B, Lewis CM, Schlitt T. From SNPs to genes: disease association at the gene level. PLoS One. 2011; 6(6):e20133. doi:10.1371/journal.pone.0020133PMID:21738570; PubMed Central PMCID: PMC3128073.
15. Fehringer G, Liu G, Briollais L, Brennan P, Amos CI, Spitz MR, et al. Comparison of pathway analysis approaches using lung cancer GWAS data sets. PLoS One. 2012; 7(2):e31816. Epub 2012/03/01. doi:
10.1371/journal.pone.0031816PMID:22363742; PubMed Central PMCID: PMCPMC3283683. 16. De la Cruz O, Wen X, Ke B, Song M, Nicolae DL. Gene, region and pathway level analyses in
whole-genome studies. Genetic epidemiology. 2010; 34(3):222–31. doi:10.1002/gepi.20452PMID:
20013942; PubMed Central PMCID: PMC4061611.
17. Storey JD, Tibshirani R. Statistical significance for genomewide studies. Proc Natl Acad Sci USA. 2003; 100(16):9440–5. PMID:12883005
18. Publishing SAS. SAS/Stat 9.22 User's Guide the MULTTEST Procedure: SAS Publishing; 2010. 19. Ackermann M, Strimmer K. A general modular framework for gene set enrichment analysis. BMC
Bioin-formatics. 2009; 10.
20. Riley RD, Lambert PC, Abo-Zaid G. Meta-analysis of individual participant data: rationale, conduct, and reporting. BMJ. 2010; 340:c221. doi:10.1136/bmj.c221PMID:20139215.
21. Blettner M, Sauerbrei W, Schlehofer B, Scheuchenpflug T, Friedenreich C. Traditional reviews, meta-analyses and pooled meta-analyses in epidemiology. Int J Epidemiol. 1999; 28(1):1–9. PMID:10195657. 22. Lin DY, Zeng D. Meta-analysis of genome-wide association studies: no efficiency gain in using
individ-ual participant data. Genetic epidemiology. 2010; 34(1):60–6. doi:10.1002/gepi.20435PMID:
19847795; PubMed Central PMCID: PMC3878085.
23. Sung YJ, Schwander K, Arnett DK, Kardia SL, Rankinen T, Bouchard C, et al. An empirical comparison of meta-analysis and mega-analysis of individual participant data for identifying gene-environment interactions. Genetic epidemiology. 2014; 38(4):369–78. doi:10.1002/gepi.21800PMID:24719363. 24. Lee S, Teslovich TM, Boehnke M, Lin X. General framework for meta-analysis of rare variants in
sequencing association studies. Am J Hum Genet. 2013; 93(1):42–53. doi:10.1016/j.ajhg.2013.05.010
PMID:23768515; PubMed Central PMCID: PMC3710762.
25. Tintle NL, Borchers B, Brown M, Bekmetjev A. Comparing gene set analysis methods on single-nucleo-tide polymorphism data from Genetic Analysis Workshop 16. BMC Proc. 2009; 3 Suppl 7:S96. PMID:
20018093
27. Koshiol J, Rotunno M, Consonni D, Pesatori AC, De Matteis S, Goldstein AM, et al. Chronic obstructive pulmonary disease and altered risk of lung cancer in a population-based case-control study. PLoS One. 2009; 4(10):e7380. doi:10.1371/journal.pone.0007380PMID:19812684
28. Sauter W, Rosenberger A, Beckmann L, Kropp S, Mittelstrass K, Timofeeva M, et al. Matrix metallopro-teinase 1 (MMP1) is associated with early-onset lung cancer. Cancer epidemiology, biomarkers & pre-vention: a publication of the American Association for Cancer Research, cosponsored by the American Society of Preventive Oncology. 2008; 17(5):1127–35. doi:10.1158/1055-9965.EPI-07-2840PMID:
18483334
29. Amos CI, Wu X, Broderick P, Gorlov IP, Gu J, Eisen T, et al. Genome-wide association scan of tag SNPs identifies a susceptibility locus for lung cancer at 15q25.1. Nat Genet. 2008; 40(5):616–22. doi:
10.1038/ng.109PMID:18385676
30. Wang L, Jia P, Wolfinger RD, Chen X, Zhao Z. Gene set analysis of genome-wide association studies: methodological issues and perspectives. Genomics. 2011; 98(1):1–8. doi:10.1016/j.ygeno.2011.04. 006PMID:21565265
31. Ioannidis JP, Patsopoulos NA, Evangelou E. Heterogeneity in meta-analyses of genome-wide associa-tion investigaassocia-tions. PLoS One. 2007; 2(9):e841. doi:10.1371/journal.pone.0000841PMID:17786212; PubMed Central PMCID: PMC1950790.
32. Freytag S, Manitz J, Schlather M, Kneib T, Amos CI, Risch A, et al. A network-based kernel machine test for the identification of risk pathways in genome-wide association studies. Human heredity. 2013; 76(2):64–75. doi:10.1159/000357567PMID:24434848; PubMed Central PMCID: PMC4026009. 33. Bhattacharjee S, Rajaraman P, Jacobs KB, Wheeler WA, Melin BS, Hartge P, et al. A subset-based
approach improves power and interpretation for the combined analysis of genetic association studies of heterogeneous traits. Am J Hum Genet. 2012; 90(5):821–35. doi:10.1016/j.ajhg.2012.03.015PMID:
22560090; PubMed Central PMCID: PMC3376551.
34. Wall JD, Pritchard JK. Haplotype blocks and linkage disequilibrium in the human genome. Nature reviews Genetics. 2003; 4(8):587–97. doi:10.1038/nrg1123PMID:12897771.
35. Gabriel SB, Schaffner SF, Nguyen H, Moore JM, Roy J, Blumenstiel B, et al. The structure of haplotype blocks in the human genome. Science. 2002; 296(5576):2225–9. doi:10.1126/science.1069424PMID:
12029063.
36. Zaykin DV, Zhivotovsky LA, Czika W, Shao S, Wolfinger RD. Combining p-values in large-scale geno-mics experiments. Pharmaceutical statistics. 2007; 6(3):217–26. doi:10.1002/pst.304PMID:
17879330; PubMed Central PMCID: PMC2569904.
37. Dudbridge F, Koeleman BP. Rank truncated product of P-values, with application to genomewide asso-ciation scans. Genet Epidemiol. 2003; 25(4):360–6. PMID:14639705
38. Yu K, Li Q, Bergen AW, Pfeiffer RM, Rosenberg PS, Caporaso N, et al. Pathway analysis by adaptive combination of P-values. Genetic epidemiology. 2009; 33(8):700–9. doi:10.1002/gepi.20422PMID:
19333968; PubMed Central PMCID: PMC2790032.
39. Hsueh HM, Chen JJ, Kodell RL. Comparison of methods for estimating the number of true null hypothe-ses in multiplicity testing. Journal of biopharmaceutical statistics. 2003; 13(4):675–89. doi:10.1081/ BIP-120024202PMID:14584715.
40. Khatri P, Sirota M, Butte AJ. Ten years of pathway analysis: current approaches and outstanding chal-lenges. PLoS computational biology. 2012; 8(2):e1002375. doi:10.1371/journal.pcbi.1002375PMID:
22383865; PubMed Central PMCID: PMC3285573.