Transcriptional Dysregulation in
NIPBL
and Cohesin
Mutant Human Cells
Jinglan Liu1, Zhe Zhang2, Masashige Bando3, Takehiko Itoh3, Matthew A. Deardorff1,4, Dinah Clark1, Maninder Kaur1, Stephany Tandy1, Tatsuro Kondoh5, Eric Rappaport6, Nancy B. Spinner1,4, Hugo Vega7, Laird G. Jackson8, Katsuhiko Shirahige3, Ian D. Krantz1,4*
1Division of Human Genetics, Abramson Research Institute, The Children’s Hospital of Philadelphia, Philadelphia, Pennsylvania, United States of America,2Center for Biomedical Informatics, The Children’s Hospital of Philadelphia, Philadelphia, Pennsylvania, United States of America,3Laboratory of Chromosome Structure and Function, Department of Biological Science, Graduate School of Bioscience and Biotechnology, Tokyo Institute of Technology, Yokohama City, Kanagawa, Japan,4The University of Pennsylvania School of Medicine, Philadelphia, Pennsylvania, United States of America,5Division of Developmental Disability, Misakaenosono Mutsumi Developmental, Medical, and Welfare Center, Isahaya, Japan,6NAPCORE, The Children’s Hospital of Philadelphia, Philadelphia, Pennsylvania, United States of America, 7Instituto de Gene´tica, Universidad Nacional de Colombia, Bogota´, Colombia,8Department of Obstetrics and Gynecology, Drexel University School of Medicine, Philadelphia, Pennsylvania, United States of America
Abstract
Cohesin regulates sister chromatid cohesion during the mitotic cell cycle with Nipped-B-Like (NIPBL) facilitating its loading and unloading. In addition to this canonical role, cohesin has also been demonstrated to play a critical role in regulation of gene expression in nondividing cells. Heterozygous mutations in the cohesin regulator NIPBL or cohesin structural components SMC1A and SMC3result in the multisystem developmental disorder Cornelia de Lange Syndrome (CdLS). Genome-wide assessment of transcription in 16 mutant cell lines from severely affected CdLS probands has identified a unique profile of dysregulated gene expression that was validated in an additional 101 samples and correlates with phenotypic severity. This profile could serve as a diagnostic and classification tool. Cohesin binding analysis demonstrates a preference for intergenic regions suggesting acis-regulatory function mimicking that of a boundary/insulator interacting protein. However, the binding sites are enriched within the promoter regions of the dysregulated genes and are significantly decreased in CdLS proband, indicating an alternative role of cohesin as a transcription factor.
Citation:Liu J, Zhang Z, Bando M, Itoh T, Deardorff MA, et al. (2009) Transcriptional Dysregulation inNIPBLand Cohesin Mutant Human Cells. PLoS Biol 7(5): e1000119. doi:10.1371/journal.pbio.1000119
Academic Editor:Nicholas Hastie, MRC Human Genetics Unit, United Kingdom
ReceivedNovember 7, 2008;AcceptedApril 17, 2009;PublishedMay 26, 2009
Copyright:ß2009 Liu et al. This is an open-access article distributed under the terms of the Creative Commons Attribution License, which permits unrestricted use, distribution, and reproduction in any medium, provided the original author and source are credited.
Funding:JL is supported by a CdLS Foundation Fellowship Grant; IDK is supported by PO1 HD052860, NICHD; KS was supported in part by a grant of the Genome Network Project and Grant-in-Aid for Scientific Research (S) from the MEXT, Japan. MAD is supported by KO8 HD055488, NICHD. This project is funded, in part, under a grant with the Pennsylvania Department of Health (to NBS). The funders had no role in study design, data collection and analysis, decision to publish, or preparation of the manuscript.
Competing Interests:The authors have declared that no competing interests exist.
Abbreviations:AGS, Alagille syndrome; CdLS, Cornelia de Lange syndrome; ChIP, chromatin immunoprecipitation; FDR, false discovery rate; IPA, Ingenuity Pathways Analysis; LCL, lymphoblastoid cell line; MAT, model-based analysis of tiling-arrays algorithm;NIPBL, Nipped-B-Like; OMIM, Online Mendelian Inheritance in Man; qPCR, quantitative PCR; RBS, Roberts-SC phocomelia syndrome; TSS, transcription start site; TTS, transcription termination site.
* E-mail: ian2@mail.med.upenn.edu
Introduction
Cohesin is an evolutionally conserved multisubunit protein complex consisting of an SMC1A and SMC3 heterodimer, and at least two non-SMC proteins SCC1 (also known as RAD21 or MCD1) and SCC3 (also known as SA or STAG). Cohesin controls sister chromatid cohesion during S phase with Nipped-B-Like (NIPBL) facilitating its loading and unloading [1]. ESCO2 possesses acetyltransferase activity and is involved in the establishment of cohesion [2]. Cohesin is loaded onto chromatin during G1/S phase in budding yeast and during telophase of the preceding cell division in vertebrates. Loading of cohesin also happens during G2/M phase when double strand DNA breaks are generated [3]. Removal of cohesin from chromosome arms begins during prophase and completes by separase-mediated dissolving of the remaining cohesin from centromeres during anaphase [3]. Although no consensus DNA sequence for cohesin binding has been demonstrated, cohesin is enriched at heterochromatin [4]
both X inactivation and escape domains, it stabilizes the repetitive sequences in several genetic disorders, and has been suggested to act as a tumor suppressor gene [15]. CTCF binding sites have been mapped in the human genome [16].
Cornelia de Lange syndrome (CdLS, Online Mendelian Inheritance in Man [OMIM] 122470, 300590, and 610759) is a dominant disorder with multisystem abnormalities including characteristic facial features, hirsutism, upper extremity defects, gastroesophageal dysfunction, growth, and neurodevelopmental delays. The incidence is about one in 10,000, with most cases being sporadic. There is equal gender distribution with a high degree of phenotypic variability. About 60% of the probands with CdLS have heterozygous mutations in the NIPBL gene, whereas 5% have mutations in theSMC1Agene, and one patient was found to have a mutation in theSMC3gene [17,18]. Other multisystem develop-mental disorders have been found to be caused by mutations in cohesin-related genes, such as Roberts-SC phocomelia (RBS, OMIM 268300) an autosomal recessive disorder caused by either homozygous or compound heterozygous mutations in theESCO2 gene [19]. These disorders have collectively been termed ‘‘cohesi-nopathies.’’ Given the paucity of sister chromatid cohesion defects observed in individuals with CdLS [20], we hypothesize that it is the newly established role of cohesin in gene regulation that results in the multisystem phenotype when disrupted. To study the effects of disruption of cohesin on gene expression in human cells we have utilized lymphoblastoid cell lines (LCLs) from individuals with CdLS that harbor known heterozygous mutations in the cohesin regulator NIPBL and cohesin structural component SMC1A and applied a genome-wide approach to analyze gene transcription and cohesin binding.
Results
Specific Genes Are Differentially Expressed in CdLS Probands withNIPBLMutations
LCLs from 16 severely affected CdLS probands with NIPBL protein-truncating mutations as well as 17 age, gender, and race
matched healthy controls were used as training samples for assays on the Affymetrix HG-U133 plus 2.0 expression arrays, six additional individuals including one CdLS proband, one healthy control, two RBS probands (a related cohesinopathy), and two Alagille syndrome (AGS) probands (an unrelated multisystem dominant developmental disorder caused by disruption in the Notch signaling pathway) served as testing samples (Table S1A and S1B). 27,995 probe sets (12,740 nonredundant genes) were considered to be expressed in human LCLs. Unsupervised sample clustering by principle component analysis (PCA) of all the expressed probe sets was able to separate probands from controls in the training set indicating these two groups have different gene expression patterns (Figure 1A). Differential expression of these 27,995 probe sets was ranked by F= (between group variance)/ (within group variance). Permutation analysis was performed 100 times and false discovery rate (FDR) was calculated for each F score, whereas redundancy was collapsed by keeping the ones with the highestFscores. We have identified a group of 1,915 probe sets (1,501 nonredundant genes) with FDR,0.05 and 420 probe sets (339 nonredundant genes) with FDR,0.01 (Tables S2 and S3) that are differentially expressed in CdLS. Heatmap representation of the expression levels of these genes clearly demonstrates that the expression of the 420 probe sets is remarkably different between CdLS probands and controls (Figure 1B). NIPBL itself had the highest ranking, with FDR = 0 and a fold change of21.34.
In order to examine whether CdLS probands could be differentiated from controls through expression profiling, Leave-One-Out cross validation was performed on the training set. The top 400 probe sets were selected on each of the 33 rounds that corresponded to an FDR<0.01. The left-out samples were
successfully classified into two distinct groups using nearest centroid method with the exception of two controls and one proband that were misclassified (Figure 1C). The area under the receiver operating characteristic (ROC) curve is 0.985 with test accuracy of 91% (95% confidence interval = 76%–98%). Nearest centroid classification method was further performed on the six testing samples based on the identified 420 probe sets (FDR,0.01). The one healthy control and two individuals with AGS were classified as controls; one CdLS and two RBS probands were classified as probands (Figure 1C and Table S4). RBS is due to the mutations in theESCO2gene that also regulates cohesin, whereas AGS is an independent genetic disorder due primarily to mutations in the JAG1 gene, a member of the Notch signaling pathway. Thus, although limited to only two samples, it appears that RBS shares a similar transcription profile with CdLS, consistent with these two disorders being caused by disruption of the cohesin pathway. It is of interest that whereas the two RBS probands were classified as CdLS, their discriminant scores (DS) were actually midway between the scores of CdLS probands and the controls suggesting RBS might have an intermediate transcription profile to CdLS and controls (Figure 1C).
Specific Gene Expression Is Tightly Associated with Phenotypic Severity among Different Groups of CdLS Probands
Clustering-based feature selection was carried out on the 339 nonredundant genes (420 probe sets, FDR,0.01) to identify independent pathways or functional groups. Five clusters were discovered (Table S5) and 32 genes (Table S6) were chosen for further custom array validation according to smaller FDR, bigger fold change, and less redundancy.
A cohort of 101 samples including individuals with different phenotypes (healthy, CdLS, or other disorders) and various gene mutations (Table S7) were measured on custom arrays carrying 56 Author Summary
Figure 1. Classifications of the 33 training samples by gene expression.(A) Unsupervised clustering of 17 healthy controls (blue dots) and 16 severe CdLS probands (red dots) by principle component analysis (PCA) of the 27,995 probe sets actively transcribed in LCLs. The separation between the training groups indicates that controls and probands have different gene expression patterns. (B) Heatmap showing that the identified 420 probe sets (FDR,0.01) are expressed dramatically differently between CdLS probands (PT) and healthy controls (N). Red represents genes that are upregulated and blue represents genes that are downregulated. The left 17 columns represent control samples, and the right 16 columns represent proband samples. Rows display gene expression levels. (C) Nearest centroid classifications of the 33 training samples and six testing samples. Among the training samples, two healthy controls and one CdLS proband were misclassified after Leave-One-Out cross validation. Among the testing samples, CdLS probands and two RBS probands were classified into CdLS group whereas the one healthy control and two probands with AGS were classified into the control group.
doi:10.1371/journal.pbio.1000119.g001
probes mapped to the 32 selected genes (Tables S6 and S8). We have followed a step-wise procedure to identify classifiers according to different CdLS subgroups, and applied nearest centroid classifications on all 101 samples (Table S9A and S9B). Detailed analysis is described in Text S1. A 23-gene classifier can be used to categorize CdLS probands withNIPBLmutations from the rest of the samples including non-CdLS, CdLS probands with SMC1A mutations, and CdLS probands without an identifiable gene mutation. This indicates that the expression of these 23 genes is tightly correlated toNIPBLfunction. To improve the generality of the classifier, we randomly selected 15 mild probands with NIPBLmutations as a new training group. Expression of ten of the 23 genes was significantly different between this group and the original 17 controls and was also capable of subclassifying all CdLS probands from non-CdLS controls, regardless of the gene mutations or clinical presentations of the probands. This suggests that expression of these ten genes is affected by a CdLS specific disease process. For both classifications, the expression levels of the classifier genes are tightly correlated to disease severity. A clear progression of increasing discriminant scores (DS) can be seen from healthy controls through mild, moderate, and severe CdLS probands (Figure 2A and 2B). In addition, we have identified three genes NFATC2, PAPSS2, and ZNF608 that could be used as biomarkers for CdLS (Figure S1A and S1B). The phenotype associated gene expression profiles strongly suggest either direct or indirect roles for the identified genes.
Cohesin Binding Is Involved in Gene Expression in Human Cells
Cohesin is a multisubunit complex constructed from SMC1A, SMC3, RAD21, and SCC3 subunits. Mutations in SMC1A or SMC3 and the cohesin regulator NIPBL lead to the human developmental disorder CdLS. To test the hypothesis that cohesin regulates transcription through its chromatin binding activity and that this association is regulated by NIPBL activity we undertook whole genome mapping of cohesin binding sites in LCLs from two healthy controls and one severely affected CdLS proband with an NIPBLmutation. Because of our inability to identify an effective antibody with high specificity against NIPBL or SMC1A, we chose an antibody against RAD21 (one of the other key components of the cohesin complex) to map genome-wide cohesin binding sites. Chromatin immunoprecipitation (ChIP) using a polyclonal antibody against human RAD21 was performed and products were hybridized on Affymatrix 2.0 tiling arrays. The score of model-based analysis of tiling-arrays algorithm (MAT) was calculated and probes were mapped to genomic positions. Peaks representing genomic regions bound by hRAD21 were identified with ap,1026and FDR,0.01.
The 54,675 probe sets on Affymetrix HG-U133 plus 2.0 expression array can be unambiguously mapped to 15,162 unique RefSeq mRNAs including 10,378 transcribed and 4,784 nontran-scribed genes in LCLs. 78% of the 15,162 mapped genes do not harbor intragenic cohesin sites (Here, ‘‘intragenic’’ means genomic region from the transcription start site [TSS] of a gene to the transcription termination site [TTS] of the same gene), and cohesin binds at variable distances outside those genes. 22% of the 15,162 mapped genes harbor intragenic cohesin sites, this number is reduced to 19.0% in the silent nontranscribed genes (p#7.2e26) and no change in the disease neutral genes (22.9%,p#0.0864); on the contrary, more of the differentially expressed genes harbor cohesin sites (27.0%,p#7.44e25) (http://145.18.230.98/Service/ Statistics/Binomial_proportions.html) (Table S10) suggesting a correlation between intragenic cohesin binding and gene expres-sion. For the 22% of genes with intragenic cohesin sites, cohesin
preferentially binds to a narrowed region surrounding the TSSs or the TTSs with frequency at the TTSs only half of that at the TSSs. The 100-kb regions spanning upstream and downstream of the genes have only background levels of cohesin binding (Figure 3A and 3B). Among controls, the degree of cohesin binding within+/ 21 kb of the TSSs is greatest for those genes that are actively transcribed and especially in those genes that are differentially expressed in the NIPBL mutant cell lines, whereas the silent nontranscribed genes have the same, or lower level, of enrichment as the background level (Figure 4A). In addition, cohesin binding is enriched at the 59-UTRs only for actively transcribed genes, with no binding difference at exons, introns, or 39-UTRs between the actively transcribed and silent genes (Figure 4B). Identification of overrepresented cohesin binding near promoters suggests that cohesin may regulate gene expression as a transcription factor. In spite of this, the majority of the expressed genes (78%) do not harbor any cohesin binding sites in their intragenic regions, indicating most of the genes in the human genome may be regulated by cohesin independent pathways or cohesin is involved in their expression regulation through an alterative mechanism. We further evaluated 13 genomic loci based on their gene expression alterations to validate their cohesin binding status by the more sensitive method of ChIP-quantitative PCR (qPCR). Out of these 13 loci, two regions are equally bound by cohesin in both healthy and CdLS cells, two regions are not bound by cohesin in either healthy or CdLS cells, and the remaining nine loci demonstrated significant loss of cohesin binding in CdLS cells as compared to control cells. The ChIP-qPCR results are consistent with cohesin binding alterations detected by ChIP array studies (Figure S2A and S2B, Table S11).
Reduced Cohesin Binding Correlates with Transcription Dysregulation in CdLS
Figure 2. Classifier genes are identified for CdLS. Clear progression of discriminant score (DS) from low to high is correlated with the phenotype from unaffectedRmildRmoderateRseverely affected with CdLS.(A) The 23-gene classifier separates CdLS probands
withNIPBLmutations from the rest of the individuals. Healthy controls, probands with other genetic disorders, CdLS probands withSMC1Amutations, and CdLS probands with no gene mutation identified are distinctly separated from each other in a progressive manner correlated with phenotypic severity. (B) The ten-gene classifier differentially categorizes all CdLS probands from non-CdLS individuals and plots correlate to the severity of the CdLS probands. Healthy controls are labeled as ‘‘Control,’’ disease severity is described as ‘‘Mild,’’ ‘‘Moderate,’’ and ‘‘Severe’’ CdLS probands withNIPBL
mutations,SMC1Amutations or no identified gene mutation are labeled as ‘‘NIPBL,’’ ‘‘SMC1A,’’ or ‘‘No,’’ respectively. *, training samples; **, number of mild cases with anNIPBLmutation was reduced from 26 in (A) to 11 in (B) with the other 15 cases having been used as training samples. doi:10.1371/journal.pbio.1000119.g002
ranked for their differential expression in CdLS probands as described above. Cohesin enrichment was clearly identified in control cells for the top ranked genes and a dramatic decrease in binding is demonstrated in the CdLS cells, suggesting that the genes that harbor more cohesin sites around the promoter regions are more likely to be misexpressed in CdLS (Figure 4C). Moreover, this difference was even more remarkable if we narrowed the analyzed region to the +/2 100-bp central area surrounding TSSs (Figure S3).
To summarize, in control LCLs cohesin preferentially binds to transcribed genes at the TSSs as compared to the silent nontranscribed genes. The binding sites are even more enriched for the differentially expressed genes. In CdLS, cells tend to lose cohesin binding globally, however the cohesin sites at TSSs are
more likely to be lost, most notably for the differentially expressed genes where loss of cohesin binding at the TSSs results in a binding frequency approaching the background level. The preferential binding to promoter regions suggests cohesin may play a role as a transcription factor.
Recently cohesin has been functionally linked to CTCF, an insulator capable of blocking enhancers or preventing the spread of epigenetic signals [15]. In our study, the ion transporter protein ATP11A is significantly downregulated in CdLS (FDR = 0.027), although the fold change is small (21.24).ATP11Alocates within ENCODE region ENr132 on Chromosome 13 with four other genes. Therefore, the ENCODE datasets obtained from GM6990, a similar EBV-transformed human B cell line (http://genome.ucsc. edu/, http://www.sanger.ac.uk/PostGenomics/encode/data-access. shtml), were able to be adapted for our analysis [21]. There are six CTCF and two cohesin binding sites in this area, both cohesin sites overlap with CTCF sites. In controls, this area can be split into three chromatin regions according to multiple histone modification makers (Figure 5A and 5B) [22–24], and cohesin and CTCF colocalize at the border. Region 1 harbors only one geneC13orf35, which is not expressed in LCLs. Region 3 harbors three genes,MCF2L,F7, and F10, which are all expressed comparably in LCLs from both controls and probands. The ENCODE study has shown that chromatin-silencing marker H3K27me3 is enriched in region 3, but open chromatin markers H3K4 me1/me2/me3, H3K36me3, and H3K79me3, and DNaseI sensitive sequences are underrepresented, indicating chromatin in this region is condensed and transcription repressed [22–24]. In region 2, on the other hand, H3K4 is highly methylated, H3 tails are vastly acetylated, and multiple DNaseI sensitive sites appeared; meanwhile, H3K27 methylation level is quite low indicating region 2 is an active open chromatin domain. ATP11A is the only gene located in region 2 and differentially expressed in CdLS. Of note, the cohesin binding site between regions 2 and 3 at Chromosome 13: 112,645,000–112,645,600 is lost in CdLS (Figure 5A and 5B). ChIP-qPCR was then performed using specific primers to amplify this binding locus in an expanded sample set including three healthy controls and three CdLS probands (Figure 5C). Two of the three probands, PT2 and PT12, haveNIPBL truncating mutations with severely affected clinical features and have been included in the whole genome expression array studies as described above; the third proband CDL-017 has a mutation in the SMC1Agene and manifests a much milder phenotype (Tables S1 and S7). Cohesin binding site 1 (Chromosome 3: 79653256– 79653385), which was not lost in CdLS according to our qualitative array analysis was therefore used as a positive binding control. By quantitative PCR assays, the enrichment of cohesin bound to site 1 was not found to be changed between controls and the probands, which is consistent with the array findings. However, cohesin binding was dramatically reduced, within Chromosome 13: 112,645,000–112,645,600 among CdLS probands including the individual with theSMC1Amutation (Figure 5C). Although cohesin binding was not completely lost in CdLS by ChIP-qPCR, the result is consistent with the missing binding peak seen in the qualitative ChIP array analysis. Although this dataset is limited, it suggests that cohesin possesses a function as an insulator/boundary protein, in addition, functional NIPBL is required for this process. With disruption in theNIPBLmutated or cohesin subunitSMC1Amutated human cells, the silent chromatin signals from region 3 appear to be able to cross the boundary and migrate into region 2 to inhibit ATP11Atranscription. Cohesin and CTCF may function coopera-tively at this locus owing to their colocalization. In addition, both CTCF binding sites remained intact in CdLS, which may explain why the downregulation ofATP11Awas not dramatic (21.24). Figure 3. Cohesin binding analyzed in 15,162 unique
tran-scripts demonstrates preferential binding to TSSs and TTSs.(A) The frequency of cohesin binding has a sharp peak around TSS and falls to the background level upstream of this peak. (B) The frequency of cohesin binding has another peak around TTS. The height of this peak is about half that of the peak height seen at TSS. Similarly the regions downstream of this peak have a cohesin binding frequency close to the background level.
Data Mining, Gene Ontology, Function, and Pathway Analyses
Ingenuity Pathways Analysis (IPA) (Ingenuity Systems, Inc., http://www.ingenuity.com) was used to analyze the identified differentially expressed genes. Out of the 339 genes with FDR,0.01, 150 genes are documented in cancer, neurological, hematological, skeletal and muscular, and dermatological diseases; 150 genes are identified as major players in embryonic and tissue development, hematological and immune system development and functions; in addition, 153 genes have well established cellular and molecular functions in cell death, cell proliferation, and cell cycle regulation. We have further analyzed the biological functions and canonical pathways mediated by the 23- and 10-gene classifiers and the three biomarkers as validated by target array (Table S12). Interestingly, more than 60% (15 out of 23) of the identifier genes
harbor intragenic cohesin binding sites, which is much higher than the average genome level (22%). Moreover, some of these genes have completely lost their cohesin association in CdLS (Table S12). Both groups of classifier genes are tightly related to pathways of cell death, cellular development, and tissue morphology. 12 out of these 23 genes are involved in 47 known biological functions or disease conditions. Five of these 12 genes are also part of the 10-gene classifier, including two 10-genes,NFATC2andPAPSS2,which are the identified biomarkers for CdLS. The 23-gene classifier could differentiate CdLS probands with NIPBL mutations suggesting the expression of these 23 genes are tightly controlled by NIPBL; whereas the 10-gene classifier is less powerful and only able to identify CdLS probands without the ability to differentiate subgroups of probands with different gene mutations, suggesting that these ten genes are related to terminal events during CdLS Figure 4. Frequency of cohesin binding around the TSS as related to transcriptional status in LCLs.Group A (silver), nontranscribed silent genes in LCLs (4,784 unique Refseq mRNAs); group B (yellow), genes without expression alterations between controls and CdLS probands (9,199 unique RefSeq mRNAs); group C (red), genes differentially expressed in CdLS (FDR,0.05) (1,179 unique RefSeq mRNAs). (A) Frequency of cohesin binding at the TSS of group C genes is much lower in CdLS than in control. Group B genes have a moderate reduction, and group A genes have little change. Overall cohesin binding around the TSS is greatest for those genes that are actively transcribed in LCLs and especially in those genes that are misexpressed in CdLS. (B) Within the intragenic regions, 59-UTRs of the actively transcribed genes (groups B and C) have higher cohesin binding frequency in control than other intragenic regions whereas group A genes have frequency close to the background level in all regions. In CdLS, the frequency dropped in all three gene groups in CdLS and the difference between different gene groups and regions tends to diminish. (C) Cohesin binding within 2 kb around TSS is enriched in differentially expressed genes. The 10,378 unique genes expressed in LCLs are ranked by theirFscores. The reference enrichment is the percentage of genes having cohesin binding within 2 kb (+/21 kb) around TSS. The relative enrichment is calculated as the value of cohesin binding enrichment in top-ranked genes over the reference enrichment. The relative enrichment point is calculated for the total number of genes prior to the point on thex-axis. The numbers onx-axis denote the statistical ranks. The curves are smoothed by the LOWESS algorithm.
doi:10.1371/journal.pbio.1000119.g004
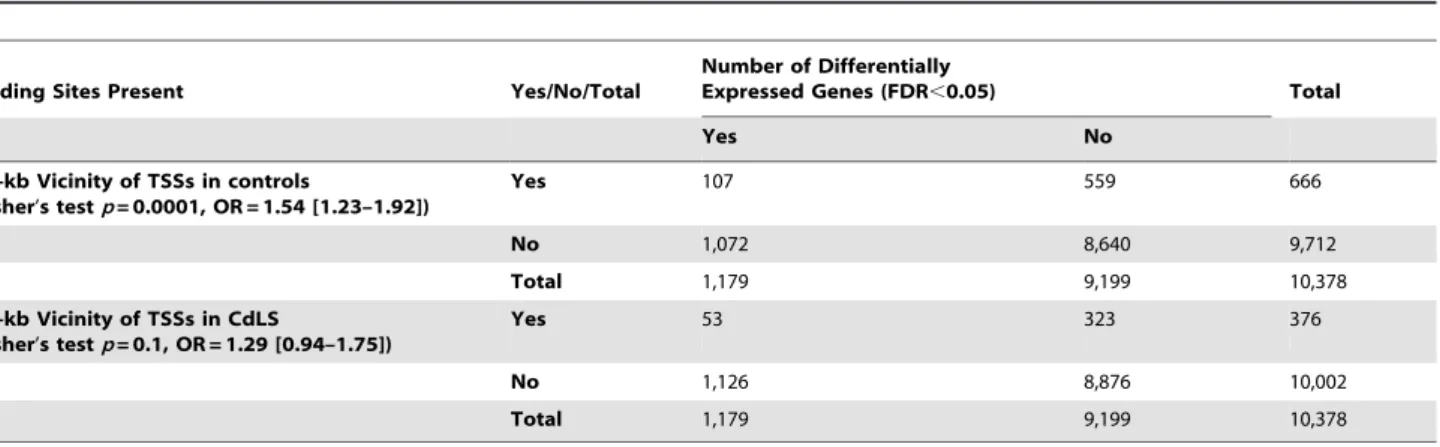
Table 2.Differentially expressed genes tend to lose their cohesin binding at TSSs in CdLS samples.
Binding Sites Present Yes/No/Total
Number of Differentially
Expressed Genes (FDR,0.05) Total
Yes No
61-kb Vicinity of TSSs in controls
(Fisher’s testp= 0.0001, OR = 1.54 [1.23–1.92])
Yes 107 559 666
No 1,072 8,640 9,712
Total 1,179 9,199 10,378
61-kb Vicinity of TSSs in CdLS
(Fisher’s testp= 0.1, OR = 1.29 [0.94–1.75])
Yes 53 323 376
No 1,126 8,876 10,002
Total 1,179 9,199 10,378
Cohesin preferentially binds to the TSSs among differentially expressed genes in healthy controls,p= 0.0001. Differentially expressed genes lose cohesin binding at their TSSs in CdLS. The frequency is reduced to the same level as the genes without differential expression,p= 0.1.
doi:10.1371/journal.pbio.1000119.t002
Table 1.Cohesin associated to the+/21-kb vicinities of TSSs among three different groups of genes in control and CdLS LCLs.
Group Expression Status in LCLs
Genes with Binding Sites Present at61-kb Region Surrounding TSS
Control Cells
CdLS Cells (FDR,0.05)
Unique RefSeq Genes (15,162 in Total)
Control Cells (792 in Total)
CdLS Cells (448 in Total)
A No No 4,784 126 72
B Yes No (FDR.0.05) 9,199 559 323
C Yes Yes (FDR,0.05) 1,179 107 53
pathogenesis. Therefore, the common five genes, PAPSS2, NFATC2, MAP3K5, LTB, and PHF16, which are involved in multiple reported events by IPA and are shared by the two classifiers, might be involved in cellular functions that are universally affected in CdLS. Presumably mutations in NIPBL, SMC1A, orSMC3, or as of yet unidentified CdLS causing gene mutations, will all result in alterations of the related biological functions controlled by these five genes. On the other hand, the seven unique genes with functional roles that were excluded from the 10-gene classifier,KIFAP3,AIM1,BBS9 (PTHB1),TSPAN12, TRERF, ARHGAP24, and ID3, probably represent cellular functions affected more specifically by NIPBL mutations. Four genes,PAPSS2,NFATC2,MAP3K5,ADCY1, were identified to be involved in 32 canonical pathways by IPA; they also regulate multiple biological functions as mentioned above. ADCY1is the single gene out of the above four genes that exists in the 23-gene classifier but is excluded from the 10-gene classifier; thus the specific canonical pathways regulated by ADCY1 (i.e. B cell receptor signaling, RAR activation, sulfur metabolism, and endoplasmic reticulum stress pathways), could largely depend on normal functions of NIPBL. Two out of the three biomarkers, NFATC2 and PAPSS2, are reported to be involved in multiple biological functions and canonical pathways by IPA analysis. The third biomarker ZNF608 is a novel protein with very minimal known functions. However, the zinc finger protein family members are known to be the major players in many molecular and cellular pathways.
One of the biomarkers, NFATC2, is involved in multiple signaling pathways during development and affecting skeletal myogenesis, chondrogenesis, axon growth, and guidance [25,26]. Two NFATC negative regulators both locate to the Down syndrome critical region of human Chromosome 21, Nfatc22/2 andNfatc42/2double-knockout mice have physical and cognitive features resembling human Down syndrome [27]. Dysregulation of NFATC2 in the postnatal nervous system may contribute to mental deficiency in CdLS. Another biomarker, PAPSS2, plays a pivotal role in the biosynthesis of sulfate donors for sulfotransferase reactions. Its activity is important for normal skeletal development; recessive mutations on PASS2 cause the genetic disorder spondyloepimetaphyseal dysplasia (SEMD), Pakistani type and degenerative osteoarthritis [28]. Papss22/2 knockout mice have shortened limbs, reduced axial skeletal length, and complex facial features. Its transcripts were also present in the heart and brain in mouse embryos [29].
Discussion
Cohesin consists of four major proteins SMC1A, SMC3, SCC1, and SCC3. NIPBL plays a role in shuttling cohesin onto and off the chromatin, although the exact mechanism of its action is poorly understood. All proteins in this pathway are evolutionally conserved from yeast to human [30]. Cell-cycle related sister
chromatid cohesion, DNA repair, and homologous rearrangement are well established roles for the cohesin apparatus. A role for cohesin in regulating gene expression has also been proposed and appears to be more sensitive to subtle dosage alterations of the cohesin apparatus and its regulators than its canonical function in sister chromatid cohesion [31]. In both yeast and Xenopus, the loading of cohesin onto chromatin in G1 phase is functionally
separable from the establishment of sister chromatid cohesion at S phase [32,33]. In Drosophila, Nipped-B mediates interactions between the promoter and remote enhancers for cut and Ultrabithorax; heterozygousNipped-B mutants diminish cut expres-sion in the emergent wing margin without showing coheexpres-sion defects indicating sister chromatid cohesion is independent from cohesin regulated gene expression [34]. In mice, Pds5b mutants have multiple CdLS-like defects without flawed sister chromatid cohesion [35].
In humans, CdLS is caused by heterozygous loss-of-function mutations in the NIPBL ortholog of Nipped-B and, in a smaller percent of cases, by mutations in theSMC1A orSMC3 cohesin subunit genes [17,18,36,37]. Given the constellation of develop-mental abnormalities present in individuals with CdLS, with only a subset showing minor cohesion defects [20,38], it is likely that the alterations of cohesin regulation and structure seen in these individuals result in gene expression dysregulation. We chose to use an easily accessible but a seemingly developmentally irrelevant tissue, LCLs, for these studies. We hypothesized that congenital genetic disorders might arise, in part, through dysregulation of expression of specific genes and that expression differences between affected and unaffected individuals might be present in tissues other than disease presenting tissues. These cells also provide an invaluable resource of naturally occurring mutant cohesin proteins (both structural and regulatory components of cohesin) that can be used to study the cellular processes regulated by this complex and specifically the impact on regulation of gene expression. Surprisingly these cells may also provide valuable insight into human developmental processes as well.
We have identified specific gene expression profiles for CdLS that are capable of classifying probands and tightly correlate with disease severity. Cohesin preferentially binds to promoter regions of the actively expressed genes suggesting a role as a general transcription factor. These binding sites are significantly reduced in NIPBL mutant CdLS samples. This result is likely due to NIPBL’s direct role in cohesin loading on chromatin, which in turn affects transcriptional regulation at specific loci and would contribute to the CdLS pathogenesis. Out of the 339 dysregulated genes with FDR,0.01, 202 were upregulated (59.6%) and 137 were downregulated (40.4%), more genes were reactivated than inhibited with mutations in NIPBL (59.6% versus 40.4%, p= 3.44e217) suggesting that NIPBL and cohesin can result in both negative (as transcriptional repression) and positive (as transcriptional activation) effects on expression. A similar percent-Figure 5. Cohesin and CTCF colocalize and separate the active chromatin region from the repressive chromatin region.The cohesin site at this position is lost in CdLS, thus the silencing epigenetic signal from region 3 is able to migrate into region 2, which harborsATP11Aand downregulates its transcription. (A) Screen shot of ENCODE ENr132 region from the UCSC genome browser is displaying histone methylation and acetylation status, CTCF binding sites, and DNaseI sensitivity sites on this region in GM06990 cells (from Sanger Institute and University of Washington databases, respectively). hSCC1-Control and hSCC1-CdLS are custom tracks. hSCC1-Control track indicates the results of whole genome cohesin binding analysis in LCLs from controls, whereas hSCC1-CdLS track indicates the results of whole genome cohesin binding analysis in LCLs from the CdLS proband; data on CTCF_Bcell2_8 track are adapted from Wendt et al. [10]. (B) Schematic of ENr132 locus as in (A). Five genes located in three regions are displayed. Two cohesin and six CTCF binding sites are shown. Cohesin and CTCF colocalize at Chromosome 13: 112,645,000– 112,645,600, which separates region 2 from region 3. Cohesin binding at this position was lost in CdLS proband. (C) ChIP-qPCR validation in three different healthy controls ‘‘Normal,’’ ‘‘N6,’’ and ‘‘N12’’ and three additional CdLS probands ‘‘PT2,’’ ‘‘PT12,’’ and ‘‘CDL-017.’’ Cohesin bound to this locus was dramatically reduced among CdLS probands including a proband with anSMC1Amutation (CDL-017). Sites 1 and 2 are positive controls, site 8 spans Chromosome 13: 112,645,000–112,645,600.
age of upregulated and downregulated genes was also observed among the 1,501 dysregulated genes with FDR,0.05. Moreover, 71 of the above 339 genes (20.9%) and 207 of the 1501 genes (13.8%) have fold changes larger than 1.5, whereas the highest fold changes are24.2 and+4.6, respectively. Although the majority of expression levels seemed only mildly perturbed, developmental deficits in CdLS are likely due to a cumulative change in multiple genes. Another reason for less remarkable expression differences could be the LCL tissue type used for this study, with bigger fold changes in more genes possibly present in more directly affected tissues of, e.g., brain or limb, and at specific times during embryonic development. However, it is also possible that the transcriptional dysregulation may be directly mediated byNIPBL through a yet uncharacterized mechanism and the reduced cohesin binding may be a secondary effect. In our study, a 30% reduction in NIPBL message was able to trigger a 29.7% (9,530 versus 13,560) reduction in cohesin binding sites in CdLS probands and further affects the transcription of specific genes.
The central components for sister chromatid cohesion,RAD21 (SCC1),SMC1A,SMC3,STAG2,ESCO1,ESCO2, andPDS5A(also known as SCC-112), are all expressed similarly between controls and CdLS probands with NIPBL mutations. However, STAG1, PDS5B (also known as APRIN), MAU2L (KIA0892), as well as several other genes with functions related to sister chromatid cohesion were significantly dysregulated in NIPBLmutant CdLS probands (FDR,0.05) (Table S13), suggesting that the cohesin pathway itself is affected by mutant NIPBL.MAU2 (KIAA0892)is the putative human homolog ofscc4inCaenorhabditis elegans[31,39]. It forms an essential loading complex with NIPBL that regulates cohesin-chromatin association, sister-chromatid pairing, and mitotic checkpoints in HeLa cells. Physical association between NIPBL and MAU2 is indispensable for their stability, as depletion of either of the two proteins would subsequently diminish the cellular level of the other one [39]. In our study, decreased NIBPL transcription (21.33, FDR = 0) was able to upregulate the transcription of MAU-2 (+1.11, FDR = 0.026), suggesting a functional compensation may exist for cohesin loading in CdLS. A cohesin-independent mechanism has also been suggested to exist. Condensin complexes [40], origin recognition complexes (ORCs) [41], centromere complexes [42], and DNA catenation [43] have each been reported to play a role in mediating cohesin-independent sister chromatid cohesion. Genes involved in these functions are also found to have dysregulated expression inNIPBL mutant individuals (Table S13). This finding indicates a subset of genes regulated by NIPBL are tightly involved in sister chromosome segregation events, but expression alteration may be required to pass a certain threshold in order to induce visible cohesion defects. This observation could explain why cell lines derived from CdLS probands did not demonstrate significant sister chromatid pairing problems. In contrast to CdLS, cohesion defects have been reported in three human developmental disorders: RBS (OMIM 268300) [19], Rothmund–Thomson syndrome (RTS, OMIM 268400) [44], and a-Thalassemia/mental retardation syndrome, X-linked (ATRX, OMIM 301040) [45]. Interestingly, although the expression of the RBS disease causative geneESCO2 was not dysregulated in CdLS cell lines, the other two disease genes, ATRXand RECQL4, both demonstrated dysregulation in NIPBLmutant cell lines (Table S13).
Several cohesin targets have been identified. Steroid hormone ecdysone receptor (EcR), which is theDrosophilahomolog of human NR1H3, was suggested to be regulated by Smc1, andRunx3was identified as a direct target of Rad21 in zebrafish [46,47]. The fact that both of these genes were also significantly dysregulated (FDR,0.05) in CdLS probands with NIBPLmutations indicates
that NIPBL may first affect cohesin proteins and subsequently dysregulate cohesin targets. Surprisingly, we did not find that cohesin directly binds to these two genes in the cell line studied, which raises the possibility that cohesin may regulate their expression over long distances. When comparing ChIP-on-chip results for Nipped-B and/or SMC1A binding sites in three different Drosophila cell types [48], homologs of 20 differentially expressed human genes in CdLS probands (FDR,0.05) were also found to be bound by NIPBL and cohesin (unpublished data). Eight of these 20 genes are also bound by cohesin in humans suggesting they may be cohesin targets in both Drosophila and humans. It also suggests that cohesin mediated transcription is a conserved biological event. Moreover, most of the binding sites were lost in CdLS cells indicating dysregulated gene expression correlates with loss of cohesin binding. Among the eight genes, KMO, ELL2, and ARHGAP17 have cohesin binding at TSSs; ROBO1, UBE2H, MED13L, RASA3, and PDPK1 had cohesin binding within intronic regions. One of these genes, ROBO1 (homolog oflea inDrosophila), is of particular interest as it was found to have a fold change of 4.6, which is the largest among all the genes on the array.ROBO1has been associated with dyslexia, a neurocognitive disorder of language and graphic processing that could be due to the abnormal migration and maturation of neurons during early development.
We have identified groups of 23, 10, and 3 genes as CdLS classifiers or biomarkers that are capable of differentiating CdLS from non-CdLS samples. The expression levels of these genes also correlate to the phenotypic severity of this disorder, although it is not clear at this time how the dysregulation of these particular genes might contribute to the phenotypes. More than 60% of the identifier genes harbor intragenic cohesin binding sites with some of them lost in CdLS proband. The obvious overrepresentation of genes carrying intragenic cohesin binding sites among the CdLS classifier genes further suggests that expression of the dysregulated genes is tightly related to the availability of cohesin binding. Overall, the majority of genes do not carry known cohesin binding sites, indicating that cohesin may play an upstream role in regulating human genes, or cohesin may enact regulation on some of the genes through distalcis- or trans-regulatory elements. The potential role for cohesin independent NIPBL regulation can not be excluded.
Cohesin has recently been found to be physically and functionally associated with the vertebrate insulator protein CTCF. In our study cohesin binds to only ,20% of genes
sites. Additional quantitative analysis or ChIP-qPCR to study more genomic loci will delineate a clearer picture of cohesin and CTCF effects on transcriptional regulation. The role cohesin plays in imprinting and X inactivation remains unclear [53].
In summary, we have undertaken a genome-wide approach to study gene expression and cohesin binding in NIPBL mutant human samples. On the basis of our data and previously reported studies, we propose that NIPBL may be involved in modulating cohesin function through various mechanisms. Besides its canonical role in regulating sister chromatid segregation proposed by Haering et al. [54] (Figure 6A), cohesin may also regulate transcription (1) as an insulator protein by acting alone or with CTCF, or (2) as a transcription factor by binding to promoter elements. While regulating transcription, NIPBL may also serve as a cohesin shuttle to chromatin that leads to decreased cohesin binding when NIPBL is mutated. Data from this study are quite consistent with this role. Whether this loading mechanism either partially overlaps with, or is completely independent from NIPBL-mediated sister chromatid cohesion remains unknown (Figure 6B). NIPBL and cohesin may very well form one protein complex binding to regulatory elements of target genes, with NIPBL mutations affecting the regulatory capacity of this complex (Figure 6C). The colocalization of NIPBL and cohesin seen in Drosophilastudies could be consistent with this model [9]. A third possibility is that NIPBL is able to maintain an accessible chromatin structure for cohesin binding whereas defective NIPBL leads to reduced accessibility for cohesin at specific chromosomal loci (Figure 6D).
Materials and Methods
Ethics Statement
This study was conducted according to the principles expressed in the Declaration of Helsinki. The study was approved by the Institutional Review Board of The Children’s Hospital of Philadelphia and Misakaenosono Mutsumi Developmental, Med-ical, and Welfare Center. All patients provided written informed consent for the collection of samples and subsequent analysis.
Sample Collection
All participants were evaluated by one or more experienced clinicians. Gene mutations were confirmed by sequencing, and most of the cases have been previously reported by our laboratories [17,55,56].
Cell Lines and Culture Condition
LCLs were grown uniformly in RPMI 1640 with 20% fetal bovine serum (FBS), 100 U penicillin/ml, 100mg streptomycin/ ml sulfate, and 1% L-glutamine. To identify differentially expressed genes between CdLS probands and controls, age and gender matched samples from 16 normal controls of European descent and 17 clinically severely affected probands of European descent with NIPBL protein-truncating mutations (nonsense or frameshift) were chosen as the training set for the discriminate analysis. To validate the expression pattern obtained from the training set, six samples including one healthy control, one Egyptian CdLS proband, two Roberts syndrome probands, and two Alagille probands were used as the testing set. All 39 cell lines were grown anonymously and the processing of these 39 cell lines were randomized by genotypes to eliminate batch effects that may contribute to genotype-specific gene expression. Samples are listed in Table S1A and S1B with detailed description. For custom array analysis, detailed information of these samples is listed in Table S7. Out of these 101 samples of
European descent, the training set included 17 healthy controls and 14 severely affected CdLS probands with NIPBL protein-truncating mutations. All 31 samples were also used for the training in Affymatrix array analysis. For the testing set, all new samples were selected, which included four healthy controls, six severely affected probands, 13 moderately affected probands (nine haveNIPBLmutations and four do not have an identifiable mutation), and 34 mildly affected probands (26 have NIPBL mutations and eight do not have an identifiable mutation). We have also included nine CdLS probands withSMC1Amutations, as well as four samples with different genetic diagnoses (two AGS, one Roberts syndrome, and one unknown multisystem genetic disorder). As above, samples were processed anonymous-ly and randomanonymous-ly.
56106exponentially growing cells were seeded in 15 ml media in a 75-ml Falcon flask, and fed exactly after 24 h. After an additional 24 h on day 3, 8 ml of the media was removed and cells were pelleted by centrifuge and RNA extraction was performed immediately.
RNA Isolation and Affymatrix Expression Array Hybridization
Total RNA from each sample was extracted with the RNeasy Mini-kit (Qiagen), synthesis of double-stranded cDNA was performed using SuperScript Double-Stranded cDNA Synthesis kit (Invitrogen), and cleaned up with GeneChip Sample Cleanup module (Affymetrix). The resulting products were then used to synthesize biotin-labeled cRNA with Enzo Bioarray High Yield RNA Transcript Labeling kit (Enzo Life Sciences) and further fragmented to 35–200-bp oligos. All procedures were done according to manufacturer’s instructions. 30ml fragmented cRNA at the concentration of 500 ng/ml was sent for hybridization in the microarray facility at The Children’s Hospital of Philadelphia. Microarray hybridizations were performed by using HG-U133 plus 2.0 GeneChips (Affymetrix). The HG-U133 plus 2.0 contains
,54,000 25-mer probe sets that covers approximately 47,000
transcripts and variants out of which 38,500 are well-characterized human genes. After hybridization and washes, arrays were scanned and analyzed both for genes that were present and for expression level using Microarray Analysis suite (MAS) 5.0 using default settings according to manufacturer’s instructions.
Custom-Built Target Array Hybridization
auto-Figure 6. Proposed working models for cohesin and NIPBL.(A) Cohesin’s canonical role in regulating sister chromatid cohesion with NIPBL acting to facilitate the loading and unloading of the cohesin complex onto the chromosomes. It is not known if NIPBL directly interacts with chromatin. This model was described by Haering et al. [54]. (B) Cohesin loading model: NIPBL loads cohesin onto chromatin at the promoters orcis -regulatory elements after which cohesin regulates transcription without the direct involvement of NIPBL. (C) Cohesin and NIPBL collaborative model: Cohesin and NIPBL form a protein complex that binds to promoters orcis-regulatory elements. The functional integrity of this complex is required for transcriptional regulation of target genes. (D) NIPBL chromatin remodeling model: NIPBL may affect the accessibility for cohesin, e.g., by changing chromatin structures, to bind to chromatin elements through yet unknown pathways. Transcriptional regulation through cohesin is secondarily affected.
doi:10.1371/journal.pbio.1000119.g006
matically quantified spot intensities and reported background subtracted expression values. The Ziplex software automatically evaluated attributes of each spot to identify spots that did not conform to quality control criteria and reported the mean value of the duplicate spots of each probe that passed quality control.
ChIP Microarray Analysis
Two healthy controls and one severely affected CdLS proband with anNIPBLprotein-truncating mutation (G5483A) were used. Cells were crosslinked with 1% formadehyde at 70%–80% confluency for 10 min, chromatin was then prepared after quenching with 125 mM glycine and ChIP was performed as described [57] using anti-hRAD21 polyclonal antibodies (Abcam, ab992). In brief, lysates from crosslinked cells were incubated with the antibodies and preabsorbed protein A Affiprep beads (Bio-Rad) for 14 h at 4uC and for 2 h at 4uC, respectively. After washing, the beads were incubated in the elution buffer (50 mM Tris, 10 mM EDTA, 1% SDS) for 20 min at 65uC. The elutes were treated with proteinase K for 1 h at 37uC and followed by 65uC overnight incubation for crosslink reversal. The samples were then treated with RNase and phenol-chloroform purified for one time, and further purified using PCR purification kit (Qiagen) with 80ml water used for the final elution.
The eluted chromatin was amplified and labeled with biotin then hybridized to high-density oligonucleotide tiling arrays (Human tilling 2.0R array, Affymetrix) as described [58]. A sample of DNA prepared from whole cell extract (WCE) was prepared in the same way. ChIP and WCE samples were hybridized on arrays according to the manufacturer’s instructions, two technique replicates were used for each sample. After scanning and data extraction, enrichment values (ChIP/WCE) were calculated by using the MAT algorithm [59]. MAT is designed for high-density oligonucleotide tiling-array analyses in higher eukaryotes that could reduce probe-specificity biases because of genome complexity or high GC content. The resulting MAT scores are proportional to the logarithm transformed value of the fold-enrichment of the ChIP-chip samples [59]. We mapped MAT scores to positions in human genome assembly Hg 18 (NCBI Build 36). Bandwidth, MaxGap, and MinProbe parameters were set to 250, 1,000, and 12, respectively. The cutoff threshold ofp-values was set to 161026, which was equivalent to MAT scores higher than 4.85. FDRs were also calculated with every experiment less than 1% (Figure S4A and S4B). BED files were created, data were visualized in the Integrated Genome Browser (IGB) (http://www. affymetrix.com/support/developer/tools/download_igb.affx) and University of California Santa Cruz (UCSC) genome browser custom track (http://genome.ucsc.edu/).
ChIP-qPCR
ChIP was performed as described above using hRAD21 and control antibodies. ChIP-qPCR analysis was performed as previously described [10]. ChIP samples (2ml) were used for one 25-ml PCR reaction. Analyses by qPCR were performed using a Platinum SYBR Green qPCR SuperMix UDG (Invitrogen) on an ABI 7500 cycler. The results were presented as fold-enrichment over control ChIP.
Statistical Analysis
Gene expression microarray data were processed by DNA-Chip Analyzer (dChip) (http://www.dchip.org) using PM-only back-ground subtraction and invariant set normalization. Differential gene expression between controls and CdLS probands was ranked by the ratio of between- and within-group variance (F statistic). During nearest centroid classification, distance of testing samples
to training group centroids was measured as their Pearson’s correlation coefficient. Statistical analyses were performed within R software environment (http://www.r-project.org). PCA and heatmap plots were generated by Spotfire DecisionSite version 9.1.1 (Spotfire, Inc.). More details about data analysis are provided in Text S1.
Accession Numbers
Genomic sequences reported in this manuscript have been submitted to NCBI GEO (http://www.ncbi.nlm.nih.gov/geo): gene expression data are under accession number GSE 12408 and ChIP-chip data are under accession number GSE 12603.
Supporting Information
Figure S1 Expression level of three genes (NFATC2, PAPSS2, andZNP608) for controls and probands. (A) 17 healthy controls and 14 severely affected CdLS probands with NIPBL protein truncating mutations, and (B) 101-sample cohort used for target array analysis including the same individuals as in (A). Three axes represent expression of the three genes, blue dots represent controls, including healthy participants and individuals with other genetic diagnoses; red dots represent CdLS probands.
Found at: doi:10.1371/journal.pbio.1000119.s001 (0.26 MB PDF)
Figure S2 ChIP-qPCR validation of 13 cohesin binding sites identified by ChIP array. RAD21 ChIP samples were obtained from the CdLS proband and the control in the ChIP array studies and were analyzed by qPCR for the presence of 13 different cohesin binding sites with site-specific primers (mean ofn= 3; error bars+/2 standard deviation [SD]) (see Table S11 for genomic addresses of the 13 sites and primer sequences). The results were presented as fold-enrichment over control ChIP (nonantibody). (A) The presence of cohesin binding at 13 examined genomic sites, sites 1 and 2 were bound equally by cohesin in both probands and control in the array studies and served as positive controls here; sites 3 and 4 did not demonstrate cohesin binding in either proband or control in the array studies and served as negative controls here; sites 5–13 are nine genomic sites where cohesin binding was lost in the CdLS cells by qualitative analysis in the array studies. Quantitative PCR has revealed the amount of cohesin bound to these sites is significantly reduced at all of the examined loci. (B) Quantitative analysis of average amount of cohesin bound to the nine examined sites revealed at least half of cohesin binding is lost in the CdLS cells.
Found at: doi:10.1371/journal.pbio.1000119.s002 (0.36 MB PDF)
Figure S3 Cohesin binding within+/2100 bp around TSSs is enriched in differentially expressed genes. The 10,378 unique genes expressed in LCLs are ranked by their F scores. The reference enrichment is the overall percentage of genes having cohesin binding within 200 bp (+/2100 bp) around TSSs. The relative enrichment is calculated as the value of cohesin binding enrichment in top-ranked genes over the reference enrichment. The relative enrichment point is calculated for the total number of genes prior to the point on the x-axis. The numbers on x-axis denote the number of top-ranked genes. The curves are smoothed by the LOWESS algorithm.
Found at: doi:10.1371/journal.pbio.1000119.s003 (0.23 MB PDF)
Table S1 39 training and testing samples were used for the whole genome expression array analyses. (A) 16 LCL samples from severely affected CdLS probands with identified protein-truncat-ing mutations ofNIPBLwere used for the training set. (B) 17 LCL samples from healthy controls were also included in the training set for expression array analyses. An additional six samples were used as a testing set.
Found at: doi:10.1371/journal.pbio.1000119.s005 (0.23 MB PDF)
Table S2 1,915 probe sets representing 1,501 unique genes (FDR,0.05) are differentially expressed in CdLS.
Found at: doi:10.1371/journal.pbio.1000119.s006 (0.35 MB PDF)
Table S3 339 nonredundant genes represented by 420 probe sets (FDR,0.01) are differentially expressed in CdLS.
Found at: doi:10.1371/journal.pbio.1000119.s007 (0.24 MB PDF)
Table S4 Evaluation of Leave-One-Out cross-validation for the 33 samples in the training set. Two healthy controls and one proband were misclassified.
Found at: doi:10.1371/journal.pbio.1000119.s008 (0.22 MB PDF)
Table S5 Five functional independent gene clusters identified among the 339 genes (FDR,0.01) using GSEA online program and R code.
Found at: doi:10.1371/journal.pbio.1000119.s009 (0.24 MB PDF)
Table S6 32 genes chosen by clustering-based feature selection for custom array analysis.
Found at: doi:10.1371/journal.pbio.1000119.s010 (0.23 MB PDF)
Table S7 Cohort of 101 individuals of European descent selected for custom array validation. Clinical evaluation and gene mutations of this cohort are listed.
Found at: doi:10.1371/journal.pbio.1000119.s011 (0.27 MB PDF)
Table S8 56 probes designed for the 32 selected genes for the custom array.
Found at: doi:10.1371/journal.pbio.1000119.s012 (0.22 MB PDF)
Table S9 Step wise method to select the 23- and ten-gene classifiers and the three-gene biomarkers.
Found at: doi:10.1371/journal.pbio.1000119.s013 (0.23 MB PDF)
Table S10 Intragenic cohesin binding in mapped human RefSeq genes. The total number of mapped human RefSeq transcripts is 15,162, whereas 4,784 genes are not transcribed in LCLs (group A); 9,199 genes are transcribed but not differentially expressed in CdLS (group B); and 1,179 genes are both transcribed and differentially expressed in CdLS (group C). (A) Cohesin binding is reduced in group A genes (18.9% of 4,784 genes) but increased in group C genes (27.0% of 1,179 genes) as compared to all the mapped transcripts (22.0% of 15,162 genes). Group B genes demonstrate little change (22.9% of 9,199 genes) as compared to all mapped transcripts. In CdLS, the number of genes bound by cohesin in all the groups is significantly reduced (all transcripts, 22.0%R16.0%; group A genes, 18.9%R13.8%; group B genes, 22.9% R 16.8%; group C genes, 27.0% R 18.5%). (B) In both control and CdLS, when compared to the number of genes bound by cohesin in all the mapped transcripts
(22.0% in control and 16.0% in CdLS), group A has a significantly reduced percentage of genes bound by cohesin (p#7.2e26 in control and p#0.000187 in CdLS), whereas group C has a significantly increased percentage of genes bound by cohesin (p#7.44e25 in control andp#0.0249 in CdLS), and group B does not demonstrate a statistically significant change in cohesin binding (p#0.0864 in control and p#0.0836 in CdLS). *p, binomial proportions comparing intragenic cohesin binding between control and CdLS; **p, binomial proportions comparing intragenic cohesin binding between individual group (A, B, or C) and all the mapped transcripts.
Found at: doi:10.1371/journal.pbio.1000119.s014 (0.27 MB PDF)
Table S11 Specific primer pairs used for ChIP-qPCR valida-tion. Primer pair 1 and 2 amplify regions that are bound by cohesin equally in healthy and CdLS cells, and served here as positive controls. Primer pair 3 and 4 amplify regions that are not bound by cohesin in either healthy or CdLS cells, and served as negative controls. Primer pair 5 to 13 amplify regions that were identified as having lost cohesin binding in CdLS cells by the qualitative ChIP array studies.
Found at: doi:10.1371/journal.pbio.1000119.s015 (0.22 MB PDF)
Table S12 Intragenic cohesin binding in the classifier genes and the gene ontology analysis. The appearance of a cohesin binding site is described as ‘‘+,’’ binding in both CdLS proband and control cells is shown. The involvements of multiple bio-functions and canonical pathways of each gene are also listed based on the IPA analysis. The 10-gene classifier and the three biomarkers are part of the 23-gene classifier.
Found at: doi:10.1371/journal.pbio.1000119.s016 (0.27 MB PDF)
Table S13 Dysregulated genes (FDR,0.05) identified in CdLS probands withNIPBL mutations that are functionally related to cohesion pathways. Genes that have FDR between 0.05 and 0.1 are highlighted in red.
Found at: doi:10.1371/journal.pbio.1000119.s017 (0.23 MB PDF)
Text S1 Supporting methods and statistical analysis.
Found at: doi:10.1371/journal.pbio.1000119.s018 (1.31 MB PDF)
Acknowledgments
We are grateful for the participation of the children and families with CdLS and to the CdLS Foundation for their support. We thank Michael Morrow, Dan Wilson, and Dave Englert from Xceed Molecular Inc. for helping in the design of and sample processing for the custom arrays. We also thank Keiko Nakagawa and Yuuichi Ishikawa for technical support, and Vivian Cheung, Dale Dorsett, Arthur Lander, and Anne Calof for helpful discussions.
Author Contributions
The author(s) have made the following declarations about their contributions: Conceived and designed the experiments: KS IDK. Performed the experiments: JL MB TI. Analyzed the data: JL ZZ MB. Contributed reagents/materials/analysis tools: MAD DC MK ST TK ER NBS HV LGJ. Wrote the paper: JL ZZ IDK. Figure preparation: ZZ JL KS IDK.
References
1. Hirano T (2006) At the heart of the chromosome: SMC proteins in action. Nat Rev Mol Cell Biol 7: 311–322.
2. Moldovan GL, Pfander B, Jentsch S (2006) PCNA controls establishment of sister chromatid cohesion during S phase. Mol Cell 23: 723– 732.
3. Haering CH, Schoffnegger D, Nishino T, Helmhart W, Nasmyth K, et al. (2004) Structure and stability of cohesin’s Smc1-kleisin interaction. Mol Cell 15: 951–964.
4. Chang CR, Wu CS, Hom Y, Gartenberg MR (2005) Targeting of cohesin by transcriptionally silent chromatin. Genes Dev 19: 3031–3042.
5. Unal E, Arbel-Eden A, Sattler U, Shroff R, Lichten M, et al. (2004) DNA damage response pathway uses histone modification to assemble a double-strand break-specific cohesin domain. Mol Cell 16: 991–1002.
6. Sumara I, Vorlaufer E, Gieffers C, Peters BH, Peters JM (2000) Characteriza-tion of vertebrate cohesin complexes and their regulaCharacteriza-tion in prophase. J Cell Biol 151: 749–762.
7. Waizenegger IC, Hauf S, Meinke A, Peters JM (2000) Two distinct pathways remove mammalian cohesin from chromosome arms in prophase and from centromeres in anaphase. Cell 103: 399–410.
8. Nakajima M, Kumada K, Hatakeyama K, Noda T, Peters JM, et al. (2007) The complete removal of cohesin from chromosome arms depends on separase. J Cell Sci 120: 4188–4196.
9. Dorsett D (2007) Roles of the sister chromatid cohesion apparatus in gene expression, development, and human syndromes. Chromosoma 116: 1– 13.
10. Wendt KS, Yoshida K, Itoh T, Bando M, Koch B, et al. (2008) Cohesin mediates transcriptional insulation by CCCTC-binding factor. Nature 451: 796–801.
11. Parelho V, Hadjur S, Spivakov M, Leleu M, Sauer S, et al. (2008) Cohesins functionally associate with CTCF on mammalian chromosome arms. Cell 132: 422–433.
12. Filippova GN, Fagerlie S, Klenova EM, Myers C, Dehner Y, et al. (1996) An exceptionally conserved transcriptional repressor, CTCF, employs different combinations of zinc fingers to bind diverged promoter sequences of avian and mammalian c-myc oncogenes. Mol Cell Biol 16: 2802–2813.
13. Ling JQ, Li T, Hu JF, Vu TH, Chen HL, et al. (2006) CTCF mediates interchromosomal colocalization between Igf2/H19 and Wsb1/Nf1. Science 312: 269–272.
14. Splinter E, Heath H, Kooren J, Palstra RJ, Klous P, et al. (2006) CTCF mediates long-range chromatin looping and local histone modification in the beta-globin locus. Genes Dev 20: 2349–2354.
15. Filippova GN (2008) Genetics and epigenetics of the multifunctional protein CTCF. Curr Top Dev Biol 80: 337–360.
16. Kim TH, Abdullaev ZK, Smith AD, Ching KA, Loukinov DI, et al. (2007) Analysis of the vertebrate insulator protein CTCF-binding sites in the human genome. Cell 128: 1231–1245.
17. Krantz ID, McCallum J, DeScipio C, Kaur M, Gillis LA, et al. (2004) Cornelia de Lange syndrome is caused by mutations in NIPBL, the human homolog of Drosophila melanogaster Nipped-B. Nat Genet 36: 631–635.
18. Deardorff MA, Kaur M, Yaeger D, Rampuria A, Korolev S, et al. (2007) Mutations in cohesin complex members SMC3 and SMC1A cause a mild variant of cornelia de Lange syndrome with predominant mental retardation. Am J Hum Genet 80: 485–494.
19. Vega H, Waisfisz Q, Gordillo M, Sakai N, Yanagihara I, et al. (2005) Roberts syndrome is caused by mutations in ESCO2, a human homolog of yeast ECO1 that is essential for the establishment of sister chromatid cohesion. Nat Genet 37: 468–470.
20. Kaur M, DeScipio C, McCallum J, Yaeger D, Devoto M, et al. (2005) Precocious sister chromatid separation (PSCS) in Cornelia de Lange syndrome. Am J Med Genet A 138: 27–31.
21. Birney E, Stamatoyannopoulos JA, Dutta A, Guigo R, Gingeras TR, et al. (2007) Identification and analysis of functional elements in 1% of the human genome by the ENCODE pilot project. Nature 447: 799–816.
22. Koch CM, Andrews RM, Flicek P, Dillon SC, Karaoz U, et al. (2007) The landscape of histone modifications across 1% of the human genome in five human cell lines. Genome Res 17: 691–707.
23. Barski A, Cuddapah S, Cui K, Roh TY, Schones DE, et al. (2007) High-resolution profiling of histone methylations in the human genome. Cell 129: 823–837.
24. Sabo PJ, Kuehn MS, Thurman R, Johnson BE, Johnson EM, et al. (2006) Genome-scale mapping of DNase I sensitivity in vivo using tiling DNA microarrays. Nat Methods 3: 511–518.
25. Nguyen T, Di Giovanni S (2008) NFAT signaling in neural development and axon growth. Int J Dev Neurosci 26: 141–145.
26. Horsley V, Pavlath GK (2002) NFAT: ubiquitous regulator of cell differentiation and adaptation. J Cell Biol 156: 771–774.
27. Arron JR, Winslow MM, Polleri A, Chang CP, Wu H, et al. (2006) NFAT dysregulation by increased dosage of DSCR1 and DYRK1A on chromosome 21. Nature 441: 595–600.
28. Venkatachalam KV (2003) Human 39-phosphoadenosine 59-phosphosulfate (PAPS) synthase: biochemistry, molecular biology and genetic deficiency. IUBMB Life 55: 1–11.
29. Stelzer C, Brimmer A, Hermanns P, Zabel B, Dietz UH (2007) Expression profile of Papss2 (39-phosphoadenosine 59-phosphosulfate synthase 2) during cartilage formation and skeletal development in the mouse embryo. Dev Dyn 236: 1313–1318.
30. Nasmyth K (2005) How might cohesin hold sister chromatids together? Philos Trans R Soc Lond B Biol Sci 360: 483–496.
31. Seitan VC, Banks P, Laval S, Majid NA, Dorsett D, et al. (2006) Metazoan Scc4 homologs link sister chromatid cohesion to cell and axon migration guidance. PLoS Biol 4: e242. doi:10.1371/journal.pbio.0040242.
32. Losada A, Hirano M, Hirano T (1998) Identification of Xenopus SMC protein complexes required for sister chromatid cohesion. Genes Dev 12: 1986–1997.
33. Uhlmann F, Nasmyth K (1998) Cohesion between sister chromatids must be established during DNA replication. Curr Biol 8: 1095–1101.
34. Dorsett D, Eissenberg JC, Misulovin Z, Martens A, Redding B, et al. (2005) Effects of sister chromatid cohesion proteins on cut gene expression during wing development in Drosophila. Development 132: 4743–4753.
35. Zhang B, Jain S, Song H, Fu M, Heuckeroth RO, et al. (2007) Mice lacking sister chromatid cohesion protein PDS5B exhibit developmental abnormalities reminiscent of Cornelia de Lange syndrome. Development 134: 3191–3201. 36. Musio A, Selicorni A, Focarelli ML, Gervasini C, Milani D, et al. (2006)
X-linked Cornelia de Lange syndrome owing to SMC1L1 mutations. Nat Genet 38: 528–530.
37. Tonkin ET, Wang TJ, Lisgo S, Bamshad MJ, Strachan T (2004) NIPBL, encoding a homolog of fungal Scc2-type sister chromatid cohesion proteins and fly Nipped-B, is mutated in Cornelia de Lange syndrome. Nat Genet 36: 636–641.
38. Vrouwe MG, Elghalbzouri-Maghrani E, Meijers M, Schouten P, Godthelp BC, et al. (2007) Increased DNA damage sensitivity of Cornelia de Lange syndrome cells: evidence for impaired recombinational repair. Hum Mol Genet 16: 1478–1487.
39. Watrin E, Schleiffer A, Tanaka K, Eisenhaber F, Nasmyth K, et al. (2006) Human Scc4 is required for cohesin binding to chromatin, sister-chromatid cohesion, and mitotic progression. Curr Biol 16: 863–874.
40. Lam WW, Peterson EA, Yeung M, Lavoie BD (2006) Condensin is required for chromosome arm cohesion during mitosis. Genes Dev 20: 2973–2984. 41. Shimada K, Gasser SM (2007) The origin recognition complex functions in
sister-chromatid cohesion in Saccharomyces cerevisiae. Cell 128: 85–99. 42. Monje-Casas F, Prabhu VR, Lee BH, Boselli M, Amon A (2007) Kinetochore
orientation during meiosis is controlled by Aurora B and the monopolin complex. Cell 128: 477–490.
43. Diaz-Martinez LA, Abian JF, Azuma Y, Guacci V, Gimenez-Martin G, et al. (2006) PIASgamma is required for faithful chromosome segregation in human cells. PLoS ONE 1: e53. doi:10.1371/journal.pone. 0000053.
44. Mann MB, Hodges CA, Barnes E, Vogel H, Hassold TJ, et al. (2005) Defective sister-chromatid cohesion, aneuploidy and cancer predisposition in a mouse model of type II Rothmund-Thomson syndrome. Hum Mol Genet 14: 813–825. 45. Ritchie K, Seah C, Moulin J, Isaac C, Dick F, et al. (2008) Loss of ATRX leads to chromosome cohesion and congression defects. J Cell Biol 180: 315–324. 46. Schuldiner O, Berdnik D, Levy JM, Wu JS, Luginbuhl D, et al. (2008)
piggyBac-based mosaic screen identifies a postmitotic function for cohesin in regulating developmental axon pruning. Dev Cell 14: 227–238.
47. Horsfield JA, Anagnostou SH, Hu JK, Cho KH, Geisler R, et al. (2007) Cohesin-dependent regulation of Runx genes. Development 134: 2639–2649. 48. Misulovin Z, Schwartz YB, Li XY, Kahn TG, Gause M, et al. (2008) Association
of cohesin and Nipped-B with transcriptionally active regions of the Drosophila melanogaster genome. Chromosoma 117: 89–102.
49. Gombert WM, Farris SD, Rubio ED, Morey-Rosler KM, Schubach WH, et al. (2003) The myc insulator element and matrix attachment regions define the c-myc chromosomal domain. Mol Cell Biol 23: 9338–9348.
50. Ohlsson R, Renkawitz R, Lobanenkov V (2001) CTCF is a uniquely versatile transcription regulator linked to epigenetics and disease. Trends Genet 17: 520–527.
51. Vostrov AA, Quitschke WW (1997) The zinc finger protein CTCF binds to the APBbeta domain of the amyloid beta-protein precursor promoter. Evidence for a role in transcriptional activation. J Biol Chem 272: 33353–33359. 52. Butcher DT, Mancini-DiNardo DN, Archer TK, Rodenhiser DI (2004) DNA
binding sites for putative methylation boundaries in the unmethylated region of the BRCA1 promoter. Int J Cancer 111: 669–678.
53. Horsthemke B, Buiting K (2006) Imprinting defects on human chromosome 15. Cytogenet Genome Res 113: 292–299.
54. Haering CH, Lowe J, Hochwagen A, Nasmyth K (2002) Molecular architecture of SMC proteins and the yeast cohesin complex. Mol Cell 9: 773–788. 55. Gillis LA, McCallum J, Kaur M, DeScipio C, Yaeger D, et al. (2004) NIPBL
mutational analysis in 120 individuals with Cornelia de Lange syndrome and evaluation of genotype-phenotype correlations. Am J Hum Genet 75: 610–623. 56. Miyake N, Visser R, Kinoshita A, Yoshiura K, Niikawa N, et al. (2005) Four novel NIPBL mutations in Japanese patients with Cornelia de Lange syndrome. Am J Med Genet A 135: 103–105.
57. Kim TH, Barrera LO, Zheng M, Qu C, Singer MA, et al. (2005) A high-resolution map of active promoters in the human genome. Nature 436: 876–880. 58. Liu CL, Schreiber SL, Bernstein BE (2003) Development and validation of a T7
based linear amplification for genomic DNA. BMC Genomics 4: 19. 59. Johnson WE, Li W, Meyer CA, Gottardo R, Carroll JS, et al. (2006)