University of São Paulo
“Luiz de Queiroz” College of
Agriculture
Soil quality response to land-use change for sugarcane expansion in Brazil
Maurício Roberto Cherubin
Thesis presented to obtain the degree of Doctor in Science: Area: Soils and Plant Nutrition
Agronomist
Soil quality response to land-use change for sugarcane expansion in Brazil
Advisor:
Prof. Dr. CARLOS CLEMENTE CERRI
Thesis presented to obtain the degree of Doctor in Science: Area: Soils and Plant Nutrition
Dados Internacionais de Catalogação na Publicação DIVISÃO DE BIBLIOTECA - DIBD/ESALQ/USP
Cherubin, Maurício Roberto
Soil quality response to land-use change for sugarcane expansion in Brazil / Maurício Roberto Cherubin. - - Piracicaba, 2016.
199 p. : il.
Tese (Doutorado) - - Escola Superior de Agricultura “Luiz de Queiroz”.
1. Produção de etanol 2. Indicadores do solo 3. Índice de qualidade do solo 4. SMAF I. Título
CDD 633.61 C523s
ACKNOWLEDGMENTS
I would like to thank the following people and institutions who significantly contributed to the success of this thesis:
- University of São Paulo - “Luiz de Queiroz” College of Agriculture (USP-ESALQ) and to Graduate Program in Soil and Plant Nutrition for providing the opportunity to get my Doctor in Science degree.
- My adviser prof. Dr. Carlos C. Cerri for accepting me to be part of his research team. Thank you for encouraging and supporting my ideas throughout my doctorate. You are an inspiration for me as a scientist, professor and person.
- Prof. Dr. Carlos P.E. Cerri for your valuable and tireless support of my research. I really appreciate the uncountable hours that you spent discussing my project and reviewing my manuscripts. Also, I want to thank prof. Dr. Brigitte J. Feigl for your friendship and willingness to help me during my doctorate.
- The United States Department of Agriculture - Agricultural Research Service (USDA-ARS), National Laboratory for Agriculture and the Environment (NLAE) for providing infrastructural support during my research internship.
- My supervisor Dr. Douglas L. Karlen for accepting me as a visiting scholar in your research team. I am very thankful for your hospitality, patience, friendship and valuable mentorship in my research. I would also like thank the NLAE’s staff, especially Lawrence S. Pellack, Gary A. Radke and Melanie Moore for helping a lot throughout my research internship in Ames, IA, USA.
- My professors of the Graduate Program in Soil and Plant Nutrition for your contributions in my academic formation. I would also like to thank my graduate colleagues for your friendship, especially to Dener M.S. Oliveira, Hélio H.S. Franco and Renato P. Lima for your help in my research and all relaxing and funny conversations.
- Colleagues of the Environmental Biogeochemistry Laboratory (LBA) - Center for Nuclear Energy in Agriculture, especially to André L.C. Franco for your active contribution in all steps of my research, making me grow up scientifically. Thanks a lot my friend!
- The LBA’s staff Ralf V. de Araújo, Lilian A.C. Duarte, Sandra M.G. Nicolete, Dagmar G.M. Vasca and Admilson R. Margato and José V. de Souto for helping me throughout my doctorate course.
- Felipe B. da Luz and Juliano Berghetti for assisting us during the field work.
- The São Paulo Research Foundation - FAPESP for my doctorate and research internship abroad (BEPE) scholarships granted (processes # 2013/17581-6 and 2014/16612-8). Also, I thank to the Brazilian Federal Agency for the Support and Evaluation of Graduate Education (CAPES) for the scholarship granted in the beginning of my doctorate.
- The Shell Global Solutions, especially to Dr. Christian A. Davies for the financial support, as well as I want to thank the Raízen Company for supporting us during the field work.
- My friends Mateus T. Eitelwein and Renes R. Pinheiro for our strong friendship and for all enjoyable moments shared during our stay in Piracicaba.
- Prof. Dr. Cássio A. Tormena and his family for everything that you did for us in Ames. I am thankful for meeting you and sharing the office (lab and field) with you. You have no idea how much I have learned in this time that we spent together.
- My parents Antonio and Odila Cherubin for you lovely unconditional support in my life. You are my strong foundation and my eternal “professors”! I am very proud of you.
- My brothers Giovani and André Cherubin, and their respective wives, Neila and Elisandra for always supporting my decisions.
- Tamires’ family (Arlindo, Italina and Rafaela Souza) for your trusting, understanding and unrestricted support throughout my career. I am very happy and thankful to be part of your lives.
- My love Tamires P. Souza, for understanding, encouraging and supporting my decisions. I really appreciate your confidence in my potential even in the hardest moments. You are my love, friend, confidant and source of motivation! I am so thankful for you putting our life together above of everything. This thesis is dedicated to you! I love you!!!
“Take care of the soil so it can take care of us”
CONTENTS
RESUMO ... 11
ABSTRACT ... 13
1 INTRODUCTION ... 15
References ... 20
2 SUGARCANE EXPANSION IN BRAZILIAN TROPICAL SOILS - EFFECTS OF LAND-USE CHANGE ON SOIL CHEMICAL ATTRIBUTES ... 23
Abstract ... 23
2.1 Introduction ... 23
2.2 Material and Methods ... 25
2.2.1 Study sites ... 25
2.2.2 Land-use change sequence ... 30
2.2.3 Sampling and soil chemical attributes ... 32
2.2.4 Data analyses ... 32
2.3 Results ... 33
2.3.1 Soil organic carbon and total nitrogen ... 33
2.3.2 Soil acidity attributes and CECpH7 ... 35
2.3.3 Soil macro- and micro-nutrients ... 36
2.3.4 Correlation among soil chemical attributes ... 40
2.4 Discussion ... 42
2.4.1 Land-use change effects on soil organic carbon and total nitrogen ... 42
2.4.2 Land-use change effects on acidity attributes and CECpH7 ... 43
2.4.3 Land-use change effects on macro- and micro- nutrients... 44
2.4.4 Soil chemical quality and its implications for sugarcane expansion ... 46
2.5 Conclusions ... 47
References ... 48
3 PHOSPHORUS POOLS RESPONSES TO LAND-USE CHANGE FOR SUGARCANE EXPANSION IN WEATHERED BRAZILIAN SOILS ... 55
Abstract ... 55
3.1 Introduction ... 55
3.2 Material and Methods ... 57
3.2.1 Study sites and experimental design ... 57
3.2.2 Soil sampling and phosphorus fractionation ... 57
3.2.3 Soil attributes and macrofauna variables ... 58
3.2.4 Data analyses ... 59
3.3 Results ... 60
3.3.1 Dynamic of P fraction levels under land-use change ... 60
3.3.2 Labile, moderately labile and non-labile P pool stocks ... 62
3.3.3 Biological, geochemical and total P pool stocks ... 65
3.3.4 Relationship among P pools, soil chamical attributes and clay content ... 67
3.3.5 Relationship between P pools and macrofauna ... 68
3.4.1 Sugarcane expansion and its implications on P dynamic ... 69
3.4.2 Implications of macrofauna on P cycling ... 73
3.4.3 Phosphorus pools as soil quality indicators ... 74
3.5 Conclusions ... 75
References ... 76
4 SOIL PHYSICAL QUALITY RESPONSE TO SUGARCANE EXPANSION IN BRAZIL ... 83
Abstract ... 83
4.1 Introduction ... 83
4.2 Material and Methods ... 85
4.2.1 Study sites and experimental design ... 85
4.2.2 Sampling and soil physical measurements ... 85
4.2.3 Soil Physical Quality Index calculation ... 87
4.2.4 Data analyses... 88
4.3 Results ... 89
4.3.1 Bulk density (BD) and soil degree of compactness (SDC) ... 89
4.3.2 Soil porosity ... 90
4.3.3 Soil water storage capacity (SWSC) and soil aeration capacity (SAC) ... 92
4.3.4 Field-satured hydraulic conductivity (Kfs) ... 94
4.3.5 Soil resistance to penetration (SRP) ... 95
4.3.6 Soil Stability Structural Index (SSI) ... 96
4.3.7 Correlation between soil physical properties and SOC ... 96
4.3.8 Soil physical quality assessement ... 98
4.4 Discussion ... 100
4.4.1 Impacts of the LUC from native vegetation to pasture on soil physical attributes ... 100
4.4.2 Impacts of the LUC from pasture to sugarcane on soil physical attributes ... 102
4.4.3 Sugarcane expansion versus soil physical quality ... 103
4.5 Conclusions ... 106
References ... 106
5 ASSESSING SOIL STRUCTURAL QUALITY UNDER BRAZILIAN SUGARCANE EXPANSION AREAS USING VISUAL EVALUATION OF SOIL STRUCTURE (VESS) ... 113
Abstract ... 113
5.1 Introduction ... 113
5.2 Material and Methods ... 116
5.2.1 Study sites and experimental design ... 116
5.2.2 Sampling and VESS measurements ... 116
5.2.3 Relationship among VESS scores and quantitative soil physical properties ... 117
5.2.4 Data analyses... 118
5.3 Results and Discussion... 118
5.3.1 VESS sensitivity to detect LUC effects on soil structural quality ... 118
5.3.2 VESS score as an integrative soil structural quality indicator ... 127
5.4 Conclusions ... 130
6 A SOIL MANAGEMENT ASSESSMENT FRAMEWORK (SMAF) EVALUATION OF
BRAZILIAN SUGARCANE EXPANSION ON SOIL QUALITY ... 135
Abstract ... 135
6.1 Introduction ... 135
6.2 Material and Methods ... 138
6.2.1 Study sites and experimental design ... 138
6.2.2 Soil sampling and laboratory analyses ... 138
6.2.3 Soil Management Assessment Framework... 140
6.2.4 Data analyses ... 141
6.3 Results and Discussion ... 142
6.3.1 Soil chemical indicators... 142
6.3.2 Soil physical indicators ... 145
6.3.3 Soil biological indicators ... 146
6.3.4 Overall Soil Quality Index and scores ... 148
6.3.4 Overall Soil Quality Index versus SOC stocks and VESS scores ... 151
6.4 Conclusions ... 154
References ... 154
7 SOIL QUALITY INDEXING STRATEGIES FOR EVALUATING SUGARCANE EXPANSION IN BRAZIL ... 161
Abstract ... 161
7.1 Introduction ... 161
7.2 Material and Methods ... 164
7.2.1 Study sites and experimental design ... 164
7.2.2 Soil sampling and analyses ... 164
7.2.3 Developing the soil quality indexes... 166
7.2.4 Data analyses ... 173
7.3 Results and Discussion ... 173
7.3.1 Soil quality indicators ... 173
7.3.2 Soil quality indexing ... 176
7.3.3 What is the best indexing strategy for assessing sugarcane expansion impacts on soil quality? ... 186
7.4 Conclusions ... 188
References ... 189
RESUMO
Alterações na qualidade do solo devido a mudança de uso da terra para expansão da cana-de-açúcar no Brasil
Globalmente, o aumento da demanda de biocombustíveis têm intensificado a taxa de mudança de uso da terra (MUT) para expansão da produção de culturas para fins energéticos. No Brasil, a área de cana-de-açúcar aumentou 35% (3,2 Mha) na última década. A expansão do cultivo de cana-de-açúcar tem resultado em pastagens extensivas sendo submetidas a intensiva mecanização e ao uso de agroquímicos, implicando diretamente na qualidade do solo (QS). A hipótese testada nesse estudo foi que a MUT resulta na degradação da QS. Para tanto foi conduzido um estudo em três locais na região centro-sul, com objetivo de avaliar as modificações na QS devido a principal sequência de MUT (vegetação nativa - pastagem - cana-de-açúcar) associada a expansão do cultivo de cana-de-açúcar no Brasil. Em cada uso da terra, amostras indeformadas e deformadas de solo foram coletadas nas profundidades de 0-10, 10-20 e 20-30 cm. Os atributos químicos e físicos do solo foram mensurados através de análises laboratoriais e à campo. Dados de atributos biológicos também foram incluídos no estudo. Inicialmente, os efeitos da MUT foram quantificados individualmente para cada um dos atributos do solo, e em seguida as alterações na QS global foram avaliadas através da Soil Management Assessment Framework (SMAF) e de seis índices de QS (IQS), desenvolvidos usando métodos com complexidade crescente. Os resultados demonstraram que a conversão da vegetação nativa em pastagem extensiva resultou na acidificação do solo, redução dos teores de carbono orgânico (COS) e macronutrientes (especialmente P), e severa compactação do solo, desequilibrando a relação entre ar e água e aumentando a resistência mecânica do solo ao crescimento radicular. Conversão da pastagem em cana-de-açúcar melhorou a qualidade química do solo através da correção da acidez e aumento dos macronutrientes. Apesar dessas melhorias, prolongado período de cultivo de cana-de-açúcar reduziu os teores de COS; e a maioria do P adicionado via fertilizantes acumulou em formas menos lábeis, confirmando o importante papel do P orgânico no fornecimento de P disponível às plantas em solos brasileiros. O cultivo de cana-de-açúcar teve impactos negativos nos atributos físicos do solo menos intensos do que aqueles gerados pelo uso com pastagem. Embora o preparo do solo para plantio e reforma da cana-de-açúcar reduziu a compactação do solo, os dados sugeriram que estes efeitos são de curta duração, ocorrendo a reconsolidação do solo e o aumento dos riscos de erosão ao longo do tempo. As alterações físicas do solo induzidas pela MUT foram detectadas tanto por meio de atributos quantitativos quanto por meio de avaliação visual da estrutura do solo (VESS), um método simples e diretamente aplicado no campo. A SMAF detectou eficientemente as alterações na QS devido a MUT. Além disso, todos os IQS desenvolvidos permitiram ranquear corretamente a QS entre os usos da terra. Assim, recomendamos que IQS mais simples e com melhor relação custo-benefício usando poucos indicadores chaves, tais como: pH, P, K, VESS e COS com ponderação proporcional entre os setores do solo (químico, físico e biológico) sejam usados como protocolo para avaliar a QS nas áreas de produção de cana-de-açúcar. Os resultados obtidos usando a SMAF e os IQS sugeriram que a conversão da vegetação nativa em pastagem extensiva reduziu a QS, degradando indicadores químicos, físicos e biológicos. Por outro lado, a conversão de pastagem em cana-de-açúcar não teve impactos na QS global, uma vez que a melhoria dos atributos químicos compensou os impactos negativos nos indicatores físicos e biológicos. Desta forma, esses resultados poderão ser utilizados como base científica pelos produtores, extencionistas e políticos para orientar estratégias de manejo que mantenham e/ou melhorem a QS e consequentemente a sustentabilidade da produção de cana-de-açúcar no Brasil.
ABSTRACT
Soil quality responses to land-use change for sugarcane expansion in Brazil
Globally, increasing demands for biofuels have intensified the rate of land-use change (LUC) for expansion of bioenergy crops. In Brazil, the world’s largest sugarcane-ethanol producer, sugarcane area has expanded by 35% (3.2 Mha) in the last decade. Sugarcane expansion has resulted in extensive pastures being subjected to intensive mechanization and large inputs of agrochemicals, which have direct implications on soil quality (SQ). We hypothesized that LUC to support sugarcane expansion leads to overall SQ degradation. To test this hypothesis we conducted a field-study at three sites in the central-southern region, to assess the SQ response to the primary LUC sequence (i.e., native vegetation to pasture to sugarcane) associated to sugarcane expansion in Brazil. At each land use site undisturbed and disturbed soil samples were collected from the 0-10, 10-20 and 20-30 cm depths. Soil chemical and physical attributes were measured through on-farm and laboratory analyses. A dataset of soil biological attributes was also included in this study. Initially, the LUC effects on each individual soil indicator were quantified. Afterward, the LUC effects on overall SQ were assessed using the Soil Management Assessment Framework (SMAF). Furthermore, six SQ indexes (SQI) were developed using approaches with increasing complexity. Our results showed that long-term conversion from native vegetation to extensive pasture led to soil acidification, significant depletion of soil organic carbon (SOC) and macronutrients [especially phosphorus (P)] and severe soil compaction, which creates an unbalanced ratio between water- and air-filled pore space within the soil and increases mechanical resistance to root growth. Conversion from pasture to sugarcane improved soil chemical quality by correcting for acidity and increasing macronutrient levels. Despite those improvements, most of the P added by fertilizer accumulated in less plant-available P forms, confirming the key role of organic P has in providing available P to plants in Brazilian soils. Long-term sugarcane production subsequently led to further SOC depletions. Sugarcane production had slight negative impacts on soil physical attributes compared to pasture land. Although tillage performed for sugarcane planting and replanting alleviates soil compaction, our data suggested that the effects are short-term with persistent, reoccurring soil consolidation that increases erosion risk over time. These soil physical changes, induced by LUC, were detected by quantitative soil physical properties as well as by visual evaluation of soil structure (VESS), an on-farm and user-friendly method for evaluating SQ. The SMAF efficiently detected overall SQ response to LUC and it could be reliably used under Brazilian soil conditions. Furthermore, since all of the SQI values developed in this study were able to rank SQ among land uses. We recommend that simpler and more cost-effective SQI strategies using a small number of carefully chosen soil indicators, such as: pH, P, K, VESS and SOC, and proportional weighting within of each soil sectors (chemical, physical and biological) be used as a protocol for SQ assessments in Brazilian sugarcane areas. The SMAF and SQI scores suggested that long-term conversion from native vegetation to extensive pasture depleted overall SQ, driven by decreases in chemical, physical and biological indicators. In contrast, conversion from pasture to sugarcane had no negative impacts on overall SQ, mainly because chemical improvements offset negative impacts on biological and physical indicators. Therefore, our findings can be used as scientific base by farmers, extension agents and public policy makers to adopt and develop management strategies that sustain and/or improving SQ and the sustainability of sugarcane production in Brazil.
1 INTRODUCTION
Land-use change (LUC) processes have transformed a large portion of the planet’s
land surface, affecting directly the land capacity for provisioning ecosystem services (FOLEY et al., 2005). Increasing global demand to support bioenergy feedstock production has intensified LUC worldwide [(e.g., South America (LAPOLA et al., 2010; GODEMBERG et al., 2014), North America (WRIGHT; WIMBERLY, 2013), Europe (FISCHER et al., 2010), Asia (MUKHERJEE; SOVACOOL, 2014), Africa (GASPARATOS et al., 2015), Australia (GRUNDY et al., 2016)]. Globally, a gross land demand for bioenergy ranging from 50 to 200 Mha by 2050 was projected by Woods et al. (2015). Direct LUC refers to changes in land use that occur where bioenergy feedstock production becomes established, and generally includes both conversion from food or fiber production (including crop rotation patterns, conversion of pasture land, and changes in forest management) and conversion of natural ecosystems (KARP et al., 2015). Current LUC, especially forest conversion to agricultural land, has been and still is the primary driver of global deforestation and forest degradation in many countries, especially in the tropics (KARP et al., 2015). Therefore, to minimize environmental impact, expansion of biofuel crop production on non-cultivated land or marginal/degraded lands, such as extensive pasturelands, is currently being promoted.
Figure 1 - Evolution of sugarcane, sugar and ethanol production (A) and sugarcane cropped area (B) in Brazil (UNIÃO DA INDÚSTRIA DE CANA-DE-AÇÚCAR, 2016)
Current preditions indicate that an additional of 6.4 Mha of sugarcane land will be required to meet the Brazilian demand for ethanol by 2021 (GOLDEMBERG et al., 2014). The accelerated pace of recent and projected sugarcane expansion, through which extensive pasture land has been subjected to intensive mechanization and agrochemical inputs has raised concerns regarding potential ecosystem impacts of LUC in Brazil. It is expected that maximizing the use of one ecosystem service (e.g., provision of biofuel and air quality) often leads to a sharp decline of other ecosystem services, particularly regulating services (e.g., C sequestration, soil retention, and water resource conservation) (FU et al., 2015). Thus,
0 5 10 15 20 25 30 35 40 45 0 100 200 300 400 500 600 700 M M g o f s ug ar / M m -3 o f et ha no l M M g of s ug arc ane
Sugarcane Sugar Ethanol
A 0 2 4 6 8 10 12 M ha o f sug arc ane
Brazil North-Northeast Central-South
identifying feasible and sensitive indicators for assessing trade-offs among various ecosystems services has become a challenge to the scientific community and stakeholders.
Soil quality (SQ) has been identified as a key component to assess the environmental sustainability of natural and anthropogenic ecosystems. Karlen et al. (1997) conceptualized SQ as the capacity of a specific kind of soil to function, within natural or managed ecosystem boundaries, to sustain plant and animal productivity, maintain or enhance water and air quality, and support human health and habitation. It is a complex functional concept and cannot be measured directly in the field or laboratory; but can be indirectly inferred by soil indicators. Indicators of SQ are those measurable soil properties and processes that have greatest sensitivity to changes in soil function and its ecosystem services (ANDREWS; KARLEN; CAMBARDELLA, 2004; ZORNOZA et al., 2015).
Assessment of SQ involves a three-step conceptual framework (Figure 2), including (i) indicator selection (chemical, physical and biological); (ii) indicator interpretation (linear or non-linear scoring curves); and (iii) integration into an overall SQ index (SQI) (KARLEN; DITZLER; ANDREWS, 2003). Assessment values are generally expressed as a fraction or percentage of full performance for soil functions such as crop productivity, nutrient cycling, or environmental protection (ANDREWS; KARLEN; CAMBARDELLA, 2004).
Figure 2 - Conceptual framework for the soil quality assessment (Adapted from Karlen, Ditzler and Andrews 2003)
Minimum Dataset
Chemical Indicators
Physical Indicators
Biological Indicators Step I -
Indicator selection
Step II - Indicator interpretation
Step III- Indicator integration
SOIL QUALITY INDEX
Although this conceptual framework is broadly used for SQ assessments worldwide, different approaches have been tested to perform each one of the three steps (e.g., ANDREWS; KARLEN; MITCHELL, 2002; ANDREWS; KARLEN; CAMBARDELLA, 2004; MUKHERJEE; LAL, 2014). Soil quality indicators can be selected based on expert opinion, statistical procedures, decision rules, etc. Linear and non-linear curves can be used for scoring measured indicator values. Finally, scored values can be integrated into an overall index using simple additives or weighted additive methodologies. Each approach has advantages and disadvantages, and its performance dependent of the assessment’s goals. Therefore, since there is no a universal method that can be used across multiple natural and anthropogenic ecosystems, many SQ assessment strategies have been developed and tested for specific purposes under particular environmental conditions worldwide. A distinguished example of the existing approaches is the Soil Management Assessment Framework (SMAF), which was initially developed and used by researchers in the USA on North American soils (ANDREWS; KARLEN; CAMBARDELLA, 2004); but it has been constantly enhanced by international collaborations, enabling to extend its use to other countries around world.
However, to our knowledge there is no any protocol or published studies evaluating SQ changes induced by the LUC for sugarcane expansion in Brazil. Therefore, we conducted a field study in central-southern Brazil, the largest sugarcane-producing regions of the world, for assessing SQ responses to the primary LUC sequence (i.e., native vegetation to pasture to sugarcane) associated with sugarcane expansion. For that, the specific objectives were to: i) evaluate the LUC impacts on soil chemical attributes; ii) investigate soil physical and structural changes induced by the LUC impacts; iii) integrate soil chemical, physical and biological responses to LUC into an overall SQ assessment using different approaches and frameworks; iv) establish a protocol for assessing SQ changes in Brazilian sugarcane areas. We tested the main hypothesis that the LUC sequence induces alteration on dynamic of soil chemical, physical and biological indicators, leading to overall SQ degradation and its impacts can detected by SQ indexing strategies.
Visual Evaluation of Soil Structure (VESS) method for detecting soil structure quality changes due to sugarcane expansion. The sixth provides the results of the first application of Soil Management Assessment Framework (SMAF) for evaluating overall SQ changes in Brazil. The seventh one investigates SQ changes induced by sugarcane expansion through six indexing strategies and provides a protocol for SQ assessment in Brazilian sugarcane areas. Finally, the eigth one provides the final considerations of this study.
The principal findings obtained in this thesis have resulted in the following scientific manuscripts:
CHERUBIN, M.R.; FRANCO, A.L.C.; CERRI, C.E.P.; OLIVEIRA, D.M.S.; DAVIES, C.A.; CERRI, C.C. Sugarcane expansion in Brazilian tropical soils - Effects of land-use change on soil chemical attributes. Agriculture Ecosystem & Environment, Amsterdam, v. 211, p. 173-184, 2015. doi:10.1016/j.agee.2015.06.006
CHERUBIN, M.R.; FRANCO, A.L.C.; CERRI, C.E.P.; KARLEN, D.L.; PAVINATO, P.S.; RODRIGUES, M.; DAVIES, C.A.; CERRI, C.C. Phosphorus pools responses to land-use
change for sugarcane expansion in weathered Brazilian soils. Geoderma, Amsterdam, v. 265, p. 27-38, 2016. doi:10.1016/j.geoderma.2015.11.017
CHERUBIN, M.R.; KARLEN, D.L.; FRANCO, A.L.C.; TORMENA, C.A.; CERRI, C.E.P.; DAVIES, C. A.; CERRI, C.C. Soil physical quality response to sugarcane expansion in Brazil. Geoderma, Amsterdam, v. 267, p. 156-168, 2016. doi:
10.1016/j.geoderma.2016.01.004
CHERUBIN, M.R.; FRANCO, A.L.C.; GUIMARÃES, R.M.L.; TORMENA, C.A.; CERRI, C.E.P.; KARLEN, D.L.; CERRI, C.C. Assessing soil structural quality under Brazilian sugarcane expansion areas using Visual Evaluation of Soil Structure (VESS). Soil & Tillage Research, Amsterdam, 2016. (Submitted)
CHERUBIN, M.R.; KARLEN, D.L.; FRANCO, A.L.C.; CERRI, C.E.P.; TORMENA, C.A.; CERRI, C.C. A Soil Management Assessment Framework (SMAF) Evaluation of Brazilian Sugarcane Expansion on Soil Quality. Soil Science Society of America Journal, Madison, 2016. doi:10.2136/sssaj2015.09.0328
References
ADAMI, M.; RUDORFF, B.F.T.; FREITAS, R.M.; AGUIAR, D.A., SUGAWARA, M.; MELLO, M.P. Remote sensing time series to evaluate direct land use change of recent expanded sugarcane crop in Brazil. Sustainability, Basel, v. 4, n. 4, p. 574-585, 2012. ANDREWS, S.S.; KARLEN, D.L.; CAMBARDELLA, C.A. The Soil Management Assessment Framework: A Quantitative Soil Quality Evaluation Method. Soil Science Society of America Journal, Madison, v. 68, n. 6, p. 1945-1962, 2004.
ANDREWS, S.S.; KARLEN, D.L.; MITCHELL, J.P. A comparison of soil quality indexing methods for vegetable production systems in Northern California. Agriculture, Ecosystems & Environment, Amsterdam, v. 90, p. 25-45, 2002.
COMPANHIA NACIONAL DE ABASTECIMENTO - CONAB. Acompanhamento da safra brasileira de cana-de-açúcar. Terceiro Levantamento - Safra 2015/16, Brasília, v. 2, n. 3, p. 1-65, 2016. Available at: <http://www.conab.gov.br/OlalaCMS/uploads/arquivos/15_12_ 17_09_03_29_boletim_cana_portugues_-_3o_lev_-_15-16.pdf >. Accessed on: 04 Jan. 2016. FISCHER, G.; PRIELER, S.; van VELTHUIZEN, H.; BERNDES, G.; FAAIJ, A.; LONDO, M.; WIT, M. Biofuel production potentials in Europe: Sustainable use of cultivated land and pastures, Part II: Land use scenarios. Biomass and Bioenergy, Amsterdam, v. 34, p. 173-187, 2010.
FOLEY, J.A.; DEFRIES, R.; ASNER, G.P.; BARFORD, C.; BONAN, G.; CARPENTER, S.R.; CHAPIN, F.S.; COE, M.T.; DAILY, G.C.; GIBBS, H.K.; HELKOWSKI, J.H.; HOLLOWAY, T.; HOWARD, E.A.; KUCHARIK, C.J.; MONFREDA, C.; PATZ, J.A.; PRENTICE, C.; RAMANKUTTY, N.; SNYDER, P.K. Global consequences of land use. Science, Washington, DC, v. 309, p. 570-574, 2005.
FU, B.; ZHANG, L.; XU, Z.; ZHAO, Y.; WEI, Y.; SKINNER, D. Ecosystem services in changing land use. Journal of Soils and Sediments, Heidelberg, v. 15, p. 833-843, 2015. GASPARATOS, A.; von MALTITZ, G.P.; JOHNSON, F.X.; LEE, L.; MATHAI, M.; PUPPIM de OLIVEIRA, J.A; WILLIS, K.J. Biofuels in sub-Sahara Africa: Drivers, impacts and priority policy areas. Renewable & Sustainable Energy Reviews, Amsterdam, v. 45, p. 879-901, 2015.
GOLDEMBERG, J.; MELLO, F.F.C.; CERRI, C.E.P.; DAVIES, C.A.; CERRI, C.C. Meeting the global demand for biofuels in 2021 through sustainable land-use change policy. Energy Policy, Amsterdam, v. 69, p.14-18, 2014.
GRUNDY, M.J.; BRYAN, B.A.; NOLAN, M.; BATTAGLIA, M.; FATFIELD-DODDS, S.; CONNOR, J.D.; KEATING, B.A. Scenarios for Australian agricultural production and land use to 2050. Agricyltural Systems, Amsterdam, v.142, p. 70-83, 2016.
KARLEN, D.L.; DITZLER, C.A.; ANDREWS, S.S. Soil quality: why and how? Geoderma, Amsterdam, v. 114, p. 145-156, 2003.
KARLEN, D.L.; MAUSBACH, M.J.; DORAN, J.W.; CLINE, R.G.; HARRIS, R.F.; SCHUMAN, G.E. Soil quality: A concept, definition, and framework for evaluation. Soil Science Society of America Journal, Madison, v. 61, p. 4-10, 1997.
KARP, A.; NETTO, P.E.A.; BEMDES, G.; CANTARELLA, H.; EL-LAKANY, H.; ESTRADA, T.E.M.D.; FAAIJ, A.; FINCHER, G.M.; HUNTLEY, B.; RAVINDRANATH, N.H.; SLUYS, M.V.; VERDADE, L.M.; YOUNGS, H. Environmental and Climate Security. In: SOUZA, G.M.; VICTORIA, R.L.; JOLY, C.A.; VEERDADE, L.M. Bioenergy &
Sustainability: bridging the gaps. Paris, France: Scientific Committee on Problems of the Environment - SCOPE, p. 138-183, 2015.
LAPOLA, D.M.; SCHALDACHA, R.; ALCAMOA, J.; BONDEAUD, A.; KOCHA, J.; KOELKINGA, C.; PRIESS, J.A. Indirect land-use changes can overcome carbon savings from biofuels in Brazil. Proceedings of the National Academy of Sciences, Washington, DC, v. 107, p. 3388-3393, 2010.
MUKHERJEE, A.; LAL, R. Comparison of Soil Quality Index Using Three Methods. PLOS ONE, San Francisco, v. 9, p. e105981, 2014.
MUKHERJEE, I.; SOVACOOL, B.K. Palm oil-based biofuels and sustainability in southeast Asia: A review of Indonesia, Malaysia, and Thailand. Renewable & Sustainable Energy Reviews, Amsterdam, v. 37, p. 1-12, 2014.
STRASSBURG, B.B.N.; LATAWIEC, A.E.; BARIONI, L.G.; NOBRE, C.A.; DA SILVA, V.P.; VALENTIM, J.F.; VIANNA, M.; ASSAD, E.D. When enough should be enough: Improving the use of current agricultural lands could meet production demands and spare natural habitats in Brazil. Global Environmental Changes, Amsterdam, v. 28, p. 84-97, 2014.
UNIÃO DA INDÚSTRIA DE CANA-DE-AÇÚCAR - UNICA. Unicadata. Available at: http://www.unicadata.com.br/. Accessed on: 04 Jan. 2016
WRIGHT, C.K.; WIMBERLY, M.C. Recent land use change in the Western Corn Belt threatens grasslands and wetlands. Proceedings of the National Academy of Sciences, Washington, DC, v. 10, p. 4134-4139, 2013.
WOODS, J.; LYND, L.R.; LASER, M.; BATISTELLA, M; VICTORIA, D.C; KLINE, K.; FAAIJ, A. Land and Bioenergy. In: SOUZA, G.M.; VICTORIA, R.L.; JOLY, C.A.;
VEERDADE, L.M. Bioenergy & Sustainability: bridging the gaps. Paris, France: Scientific Committee on Problems of the Environment - SCOPE, p. 258-301, 2015.
2 SUGARCANE EXPANSION IN BRAZILIAN TROPICAL SOILS - EFFECTS OF LAND-USE CHANGE ON SOIL CHEMICAL ATTRIBUTES
Abstract
Land-use change (LUC) for sugarcane ethanol production has raised concerns about its potential environmental impacts in Brazil. Soil quality is a key indicator to infer about the environmental sustainability of Brazilian ethanol production. Our objective was to quantify the effects of the most common LUC sequence associated with sugarcane expansion (i.e., native vegetation to pasture to sugarcane) on chemical attributes in tropical soils. Soil sampling was carried out in three study sites located in central-southern Brazil, primary sugarcane region of production and expansion of the world. Overall, long-term conversion from native vegetation to extensive pasture decreased soil organic carbon (SOC), total nitrogen (TN), available phosphorus, sulfur, calcium, magnesium and boron contents. In addition, the LUC led to soil acidification and decreased CECpH7, indicating that pasturelands had poor soil chemical quality. The LUC from pasture to sugarcane increased soil nutrient levels and reduced the soil acidity due to inputs of lime and fertilizers. Despite that, increments of available P and base saturation are necessary to achieve ideal soil chemical conditions to sugarcane growth. Short-time (<5 years) conversion from pasture to sugarcane had no significant impacts on SOC and NT contents; however, after 20 years of sugarcane production significant losses were quantified. Overall, our findings suggest that sugarcane expansion in Brazil replacing pasturelands will promote improvements on soil chemical quality. Nevertheless, sugarcane expansion can be associated with management strategies to increase soil organic matter and improve the soil fertility, reducing the environmental and economic costs associated with ethanol production in Brazil.
Keywords: Soil chemical quality; Biofuel crops; Ethanol production; Environmental impacts; Soil fertility
2.1 Introduction
Land use activities whether converting natural landscapes for human use or changing management practices on human-dominated lands have transformed a large proportion of the
planet’s land surface (FOLEY et al., 2005), with large short and long term environmental
implications (LAMBIN; MEYFROIDT, 2011; TILMAN et al., 2011). The environmental impacts of agriculture include those caused by expansion (when croplands and pastures extend into new areas, replacing natural ecosystems) and those caused by intensification (when existing lands are managed to be more productive) (FOLEY et al., 2011).
in the central-southern region (LAPOLA et al., 2010; 2014; GOLDEMBERG et al., 2014; WALTER et al., 2014).
Brazil is currently the world’s largest sugarcane producer, accounting for one-third of global harvest. An area of 9.0 Mha was cultivated during the 2015/2016 season (COMPANHIA NACIONAL DE ABASTECIMENTO, 2015), with 90% of the sugarcane cultivated in Brazil concentrated within the central-southern region under tropical soils, especially Oxisols and Ultisols. Although Brazilian sugarcane production is significant, an additional 6.4 Mha of sugarcane area would be required to meet the projected internal demand of ethanol by 2021 (61.6 billion L) (GOLDEMBERG et al., 2014). In central-southern Brazil, sugarcane expanded primarily onto pasturelands and annual croplands, with limited expansion into areas of native vegetation (ADAMI et al., 2012; EGESKOG et al., 2014). In the near future, sugarcane expansion is most likely to occur in areas previously used as extensive pasture (LAPOLA et al., 2010; ADAMI et al., 2012; EGESKOG et al., 2014; GOLDEMBERG et al., 2014).
This recent expansion in production to meet ethanol demand, in combination with the projected future expansion, has raised concerns about the potential environmental impacts of LUC in Brazil (HERNANDES; BUFON; SEABRA, 2014). Therefore, it is necessary investigate the LUC effects to assess of sustainability of expanding ethanol production. The greatest challenge is to define sensitive indicators that reflect local specificities of the environmental implications from LUC (GASPARATOS; STROMBERG; TAKEUCHI, 2011; EFROYMSON et al., 2013; FU et al., 2015).
The soil quality is identified as key component to assess the environmental sustainability of natural and anthropogenic ecosystems (KARLEN et al., 1997) and it has been proposed into current protocols such as the one elaborate by Better Sugar Cane Initiative
“Bonsucro®” certification (BETTER SUGAR CANE INITIATIVE, 2011) and the “Global
Bioenergy Partnership” by FAO (GLOBAL BIOENERGY PARTNERSHIP, 2011). To
evaluate the effects of land use and soil managements on soil quality, soil chemical attributes can be used as potential indicators, such as: available macro- and micronutrients, acidity attributes, cation exchange capacity and soil organic carbon (SOC) (DORAN; PARKIN, 1994; VEZZANI; MIELNICZUK, 2011; CARDOSO et al., 2013; ZORNOZA et al., 2015)
from native vegetation to pastures and then from pasture to sugarcane (MELLO et al., 2014). However, C stocks increases were found where cropland was converted to sugarcane (MELLO et al., 2014). On the other hand, Carvalho et al. (2009) showed the conversion from
Brazilian’s Cerrado into cropland under conservative management in an Oxisol increased
SOC and nutrients (P, K, Ca, Mg) and reduced soil acidity. In this case, it was driven mainly by fertilizer application and liming to reduce soil acidity. Geissen et al. (2009) under Peruvian highland jungle (Amazon forest) region and Lindel, Åström and Öberg (2010) under different soils in tropical Southeast Mexico, concluded that the LUC did not lead to significant changes in soil chemical attributes, although, Geissen et al. (2009) observed that soils used as pastureland became acidified.
Therefore, our objective was to quantify effects of the most common LUC sequence associated with sugarcane expansion (i.e., native vegetation to pasture to sugarcane) on chemical attributes in tropical soils of central-southern Brazil. We hypothesized that i) LUC from native vegetation to extensive pasture leads to significant depletions of SOC and macronutrients and increase soil acidification; ii) sugarcane cultivation replacing extensive pasturelands can recover soil fertility; iii) pasturelands have lower soil chemical quality than sugarcane fields, constituting hotspots for sugarcane expansion in Brazil.
2.2 Material and Methods
2.2.1 Study sites
The study was carried out in central-southern Brazil, the largest sugarcane-producing region of the world (Figure 1). Three strategic and representative sites were chosen along a transect of approximately 1,000 km across this region: (i) Lat_17S: located near Jataí city in
the southwestern region of the Goiás state (Lat.: 17º56 16 S; Long.: 51º38 31 W) with a mean
altitude of 800 m; (ii) Lat_21S: located near Valparaíso city in the west region of the São
Paulo state (Lat.: 21º14 48 S; Long.: 50º47 04 W) with a mean altitude of 425 m. (iii) Lat_23S: located near Ipaussu city in the south-central region of the São Paulo state (Lat.:
Figure 1 - Geographic location of study sites in central-southern Brazil
Figure 2 - Mean monthly temperature (maximum, mean and minimum) (°C) and mean annual precipitation (mm) in the region studied, where: A) Lat_17S (Jataí - GO); B) Lat_21S (Valparaíso - SP); C) Lat_23S (Ipaussu - SP). Sources: CIIAGRO (http://www.ciiagro.sp.gov.br) and CEPAGRI (http://www.cpa.unicamp.br)
0 50 100 150 200 250 300 350 0 5 10 15 20 25 30 35
JAN FEB MAR APR MAY JUN JUL AUG SEP OCT NOV DEC
Pre ci pi tat io n (m m ) T em per at ur e (C º)
Precipitation T_min T_max T_mean
0 50 100 150 200 250 300 350 0 5 10 15 20 25 30 35
JAN FEB MAR APR MAY JUN JUL AUG SEP OCT NOV DEC
Pre ci pi tat io n (m m ) T em per at ue (C º) 0 50 100 150 200 250 300 350 0 5 10 15 20 25 30 35
JAN FEB MAR APR MAY JUN JUL AUG SEP OCT NOV DEC
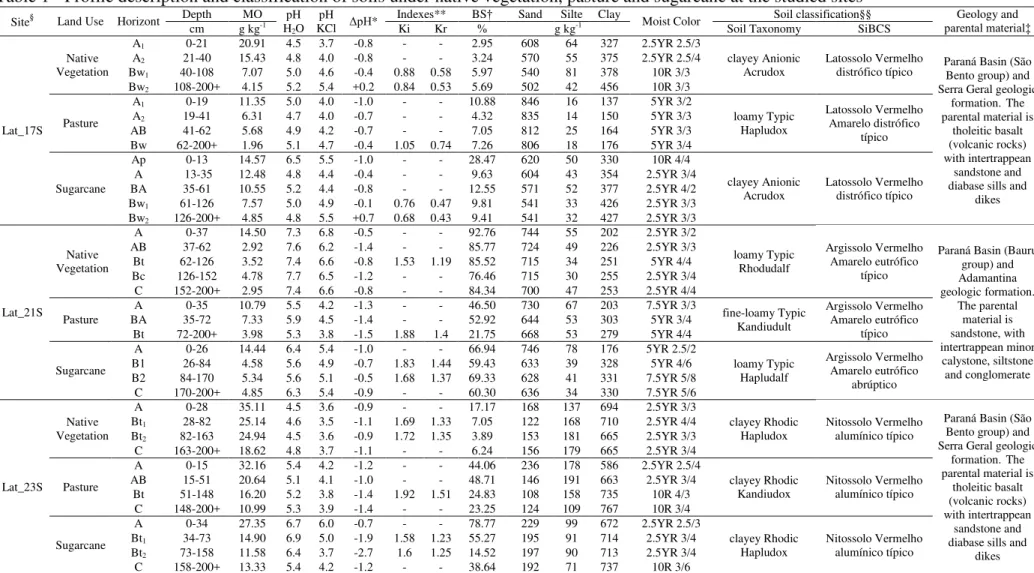
The soils at all three sites, classified as Oxisols, Ultisols and Alfisols, are characterized by highly weathered minerals (Ki and Kr weathering indexes have values < 2.0), typical of Brazilian tropical soils. A morphological description of 2-m deep soil profiles was carried out in January 2014, to classify the soils at each field site. From each soil horizon we collected samples for chemical, mineralogical and particle-size analyses. Overall, the soils have predominance of 1:1 minerals (kaolinite), Fe oxides (goethite, hematite) and Al oxide (gibbsite) (Figure 3).The profile description and the soils classification using criteria outlined by the USDA Soil Taxonomy (SOIL SURVEY STAFF, 2014) and Brazilian Classification System (SANTOS et al., 2013) as well as the parental material are presented in Table 1.
Figure 3 - Diffractograms of the silt+clay soil fraction (<0.05 mm ∅) for native vegetation, pasture and sugarcane at Lat_17S, Lat_21S and Lat_23S, in central-southern Brazil
0 100 200 300 400 500
3 5 7 9 11 13 15 17 19 21 23 25 27 29 31 33 35 37 39 41 43 45 47 49
Inte ns it y Native vegetation Pasture Sugarcane Lat_17S Kt Gb Gb
Gh Hm An Qz Hm Mgm Kt Kt Hm An Feh Es 0 100 200 300 400 500 600 700 800 900
3 5 7 9 11 13 15 17 19 21 23 25 27 29 31 33 35 37 39 41 43 45 47 49
Inte ns it y Lat_21S Kt Gb Gh Gh Qz An
Hm Mgn Hm Hm
Mgn Gh Hm Mgn Feh An Hm 0 100 200 300 400 500 600
3 5 7 9 11 13 15 17 19 21 23 25 27 29 31 33 35 37 39 41 43 45 47 49
Inte
ns
it
y
Angle 2θ (Å)
Lat_23S
Kt
Gb Gh
Gb
An Qz
Hm Hm Mgn Kt
Table 1 - Profile description and classification of soils under native vegetation, pasture and sugarcane at the studied sites
Site§ Land Use Horizont Depth cm g kgMO -1 H2O pH KCl pH ΔpH* Indexes** Ki Kr BS% † Sand g kgSilte Clay -1 Moist Color Soil Taxonomy Soil classification§§ SiBCS parental material‡Geology and
Lat_17S
Native Vegetation
A1 0-21 20.91 4.5 3.7 -0.8 - - 2.95 608 64 327 2.5YR 2.5/3
clayey Anionic
Acrudox Latossolo Vermelho distrófico típico Paraná Basin (São Bento group) and Serra Geral geologic
formation.The parental material is
tholeitic basalt (volcanic rocks) with intertrappean
sandstone and diabase sills and
dikes A2 21-40 15.43 4.8 4.0 -0.8 - - 3.24 570 55 375 2.5YR 2.5/4
Bw1 40-108 7.07 5.0 4.6 -0.4 0.88 0.58 5.97 540 81 378 10R 3/3 Bw2 108-200+ 4.15 5.2 5.4 +0.2 0.84 0.53 5.69 502 42 456 10R 3/3
Pasture
A1 0-19 11.35 5.0 4.0 -1.0 - - 10.88 846 16 137 5YR 3/2
loamy Typic Hapludox
Latossolo Vermelho Amarelo distrófico
típico A2 19-41 6.31 4.7 4.0 -0.7 - - 4.32 835 14 150 5YR 3/3
AB 41-62 5.68 4.9 4.2 -0.7 - - 7.05 812 25 164 5YR 3/3 Bw 62-200+ 1.96 5.1 4.7 -0.4 1.05 0.74 7.26 806 18 176 5YR 3/4
Sugarcane
Ap 0-13 14.57 6.5 5.5 -1.0 - - 28.47 620 50 330 10R 4/4
clayey Anionic
Acrudox Latossolo Vermelho distrófico típico A 13-35 12.48 4.8 4.4 -0.4 - - 9.63 604 43 354 2.5YR 3/4
BA 35-61 10.55 5.2 4.4 -0.8 - - 12.55 571 52 377 2.5YR 4/2 Bw1 61-126 7.57 5.0 4.9 -0.1 0.76 0.47 9.81 541 33 426 2.5YR 3/3 Bw2 126-200+ 4.85 4.8 5.5 +0.7 0.68 0.43 9.41 541 32 427 2.5YR 3/3
Lat_21S
Native Vegetation
A 0-37 14.50 7.3 6.8 -0.5 - - 92.76 744 55 202 2.5YR 3/2
loamy Typic Rhodudalf
Argissolo Vermelho Amarelo eutrófico
típico
Paraná Basin (Bauru group) and Adamantina geologic formation. The parental material is sandstone, with intertrappean minor calystone, siltstone and conglomerate AB 37-62 2.92 7.6 6.2 -1.4 - - 85.77 724 49 226 2.5YR 3/3
Bt 62-126 3.52 7.4 6.6 -0.8 1.53 1.19 85.52 715 34 251 5YR 4/4 Bc 126-152 4.78 7.7 6.5 -1.2 - - 76.46 715 30 255 2.5YR 3/4
C 152-200+ 2.95 7.4 6.6 -0.8 - - 84.34 700 47 253 2.5YR 4/4
Pasture A 0-35 10.79 5.5 4.2 -1.3 - - 46.50 730 67 203 7.5YR 3/3 fine-loamy Typic Kandiudult Argissolo Vermelho Amarelo eutrófico típico BA 35-72 7.33 5.9 4.5 -1.4 - - 52.92 644 53 303 5YR 3/4
Bt 72-200+ 3.98 5.3 3.8 -1.5 1.88 1.4 21.75 668 53 279 5YR 4/4
Sugarcane
A 0-26 14.44 6.4 5.4 -1.0 - - 66.94 746 78 176 5YR 2.5/2
loamy Typic Hapludalf
Argissolo Vermelho Amarelo eutrófico
abrúptico B1 26-84 4.58 5.6 4.9 -0.7 1.83 1.44 59.43 633 39 328 5YR 4/6
B2 84-170 5.34 5.6 5.1 -0.5 1.68 1.37 69.33 628 41 331 7.5YR 5/8 C 170-200+ 4.85 6.3 5.4 -0.9 - - 60.30 636 34 330 7.5YR 5/6
Lat_23S
Native Vegetation
A 0-28 35.11 4.5 3.6 -0.9 - - 17.17 168 137 694 2.5YR 3/3
clayey Rhodic
Hapludox Nitossolo Vermelho alumínico típico
Paraná Basin (São Bento group) and Serra Geral geologic
formation.The parental material is
tholeitic basalt (volcanic rocks) with intertrappean
sandstone and diabase sills and
dikes Bt1 28-82 25.14 4.6 3.5 -1.1 1.69 1.33 7.05 122 168 710 2.5YR 4/4
Bt2 82-163 24.94 4.5 3.6 -0.9 1.72 1.35 3.89 153 181 665 2.5YR 3/3 C 163-200+ 18.62 4.8 3.7 -1.1 - - 6.24 156 179 665 2.5YR 3/4
Pasture
A 0-15 32.16 5.4 4.2 -1.2 - - 44.06 236 178 586 2.5YR 2.5/4
clayey Rhodic
Kandiudox Nitossolo Vermelho alumínico típico AB 15-51 20.64 5.1 4.1 -1.0 - - 48.71 146 191 663 2.5YR 3/4
Bt 51-148 16.20 5.2 3.8 -1.4 1.92 1.51 24.83 108 158 735 10R 4/3 C 148-200+ 10.99 5.3 3.9 -1.4 - - 23.25 124 109 767 10R 3/4
Sugarcane
A 0-34 27.35 6.7 6.0 -0.7 - - 78.77 229 99 672 2.5YR 2.5/3
clayey Rhodic
Hapludox Nitossolo Vermelho alumínico típico Bt1 34-73 14.90 6.9 5.0 -1.9 1.58 1.23 55.27 195 91 714 2.5YR 3/4
Bt2 73-158 11.58 6.4 3.7 -2.7 1.6 1.25 14.52 197 90 713 2.5YR 3/4 C 158-200+ 13.33 5.4 4.2 -1.2 - - 38.64 192 71 737 10R 3/6
§Lat_17S, southwestern region of Goiás state (17°56 16 S, 51°38 31 W); Lat_21S, west region of São Paulo state (21°14 48 S, 50°47 04 W); Lat_23S, south-central region of São Paulo state
(23°05 08 S, 49°37 52 W). *ΔpH = pH
2.2.2 Land-use change sequence
To assess the effects of LUC on soil chemical attributes we adopted a chronosequence approach, where each one of three studied sites (Lat_17S; Lat_21S; Lat_23S) included three land uses: native vegetation, pasture and sugarcane crop, representing the most common land use transition sequence in the south-central region of Brazil.
The three land uses are co-located adjacent to each other, to minimize the effects of climatic, topographic and soil variations on the soil quality indicators. Despite that concern, a textural difference between the soil under pasture (lower clay content) and the other land uses of the same chronosequence was observed at Lat_17S (Table 1). Thus, we highlighted that all statements about LUC effects on P pools for this site must be interpreted carefully. When adopting a chronosequence approach the variability in soils within the chronosequence is not always possible to be controlled, but, the global lack of long-term studies evaluating the effects of LUC, and especially in Brazil, justifies to keep this synchronic approach in our study (SIQUEIRA NETO et al., 2010; COSTA JUNIOR et al., 2013).
Land use historical information and brief description of management operations conducted at the studied sites are shown in Figure 4 and Table 2.
Table 2 - Land use historical information and brief description of management operations conducted at the studied sites
Site Land use Description
Lat_17S
Native
vegetation Cerradao forest formation, Cerrado biome, characterized by sclerophyllous and xeromorphic species. The vegetation is dense compared to the Cerrado stricto sensu (savanna).
Pasture
Conversion from native vegetation to pasture occurred at 1980. Pasture is composed by tropical grasses of the genus Brachiaria, predominantly B. decumbens, B. brizantha and B. ruziziensis, and supports 1.5 AU ha-1 full year. The conversion of native vegetation to pasture occurred of the
beginning of the 1980s. The predominant species are of the Brachiaria genus, especially B. decumbens, B. brizantha e B. ruziziensis. The
stocking rate is 1.5 UA ha-1 along the all year.
Sugarcane
Sugarcane cultivar RB855453 was cultivated over part of the pasture at 2009. At that time soil was prepared by plowing and disking. The sugarcane mean yield since the implantation is 81.5 ton ha-1. At the sampling time for chemical and biological analyses the sugarcane was in the
third ratoon cropping of its cycle; while at soil sampling time for physical analyses the soil had been newly tilled for sugarcane replanting (chiseling and disking). Soil acidity was corrected with the application of 1.6 ton ha-1 of dolomitic lime. Also was applied 1 ton ha-1 of gypsum
before croppingto supply S and Ca and 150 kg ha-1 of P
2O5. Annually the crop fertilization is carried out by the application of 110 kg ha-1 N and
75 kg ha-1 K
2O. Sugarcane has been mechanically harvested using a harvester (≈20 Mg) and transported by a tractor + trailer (≈10 + 20 Mg).
Sugarcane production has not used controlled traffic system.
Lat_21S
Native vegetation
The local vegetation is seasonal semideciduous forest, Atlantic forest biome, in which a portion of the trees defoliates during the dry season. It is a transitional region, where the forest has more xeromorphic species than the wetter areas of the Atlantic forest, on the other hand presents less xeromorphic species than the Cerrado vegetation.
Pasture Conversion from native vegetation to pasture occurred at 1980. Pasture is composed by tropical grasses of the AU ha-1 full year. Annually, the pasture receives 25 kg ha-1 N, 6 kg ha-1 P Brachiaria genus and supports 2 2O5, 23 kg ha-1 K2O (mineral fertilizer).
Sugarcane
Sugarcane cultivar SP791011 was cultivated over part of the pasture at 2010. At that time soil was prepared by plowing and disking. The sugarcane mean yield since the implantation is 80 ton ha-1. At the sampling time sugarcane was in the fourth ratoon cropping of its cycle. Soil
acidity was corrected by liming. The sugarcane was annually fertilized with 11 kg ha-1 N, 55 kg ha-1 P
2O5 and 55 kg ha-1 K2O (mineral fertilizer).
Vinasse was applied to sugarcane in 2012 at an amount of 150 m3 ha-1 (corresponding to approximately 35 kg ha-1 N
, 30 kg ha-1 P2O5 and300 kg
ha-1 K
2O). Sugarcane has been mechanically harvested without controlled traffic system using machines similar to those described for Lat_17S.
Lat_23S
Native
vegetation The local vegetation is similar that described for Lat_21S site.
Pasture Conversion from native vegetation to pasture occurred at 1979. Pasture is composed by tropical grasses of the AU ha-1 full year. Cynodon genus, and supports 1
Sugarcane
Sugarcane cultivar CTC6 was cultivated over part of the pasture at the beginning of the 1990s. At that time soil was prepared by plowing and disking. The sugarcane mean yield since the implantation is 85 ton ha-1. At the sampling time sugarcane was in the fifth ratoon cropping of its
cycle. Soil acidity was corrected by liming. Annually the crop fertilization is carried out by the application of 45 kg ha-1 of N (urea) plus 200 m3
ha-1 of vinasse (approximately 45 kg ha-1 N
, 40 kg ha-1 P2O5 and400 kg ha-1 K2O) and 25 ton ha-1 of filter cake and boiler ash (approximately 75
kg ha-1 N, 55 kg ha-1 P2O5 and30 kg ha-1 K2O). Sugarcane has been mechanically harvested since 2003 without controlled traffic system using
2.2.3 Sampling and soil chemical attributes
Soil sampling was completed in January 2013 during the rainy season, when the sugarcane was in full growth close to harvest. Soil samples within each land use (i.e., native vegetation, pasture and sugarcane) were collected using a consistent grid pattern composed of nine points spaced 50 m apart, providing a total of 27 sampling points (3 land uses x 9 points) for each site or 81 sampling points for the three studied sites. Around each sampling point, composite samples consisting of 12 subsamples were collected using a Dutch auger, at three depths: 0-10, 10-20 and 20-30 cm. This provided a total of 243 disturbed soil samples for chemical analyses.
The soil chemical attributes studied were: soil organic carbon (SOC) and total nitrogen (TN) which were measured by dry combustion on a LECO® CN-2000 elemental analyzer (furnace at 1350 ºC in pure oxygen); available phosphorus (P), potassium (K), calcium (Ca), magnesium (Mg), sulfur (S-sulphate), boron (B), cooper (Cu), manganese (Mn), iron (Fe), zinc (Zn), active acidity (pHCaCl2 0.01mol L-1), potential acidity (H+Al), base saturation (BS) and potential cation exchange capacity (CECpH7) which were measured by analytical methods described in Raij et al. (2001).
2.2.4 Data analyses
The normality of data was confirmed by Shapiro-Wilk’s test (p>0.05), using the
Statistical Analysis System - SAS v.9.3 (SAS Inc, Cary, USA), therefore no transformation of data was required. The data were analyzed using analysis of variance (ANOVA) using PROC GLM procedure. If the ANOVA F statistic was significant at (p<0.05), the means were
compared using Tukey’s test (p<0.05) by SAS v.9.3. To analyze the effects within each site,
means were compared within each site, and to analyze the overall (regional scale) effects, means were compared considering each site as a block. The three soil depths were analyzed separately. A Pearson’s correlation analysis (p<0.01 and p<0.05) was performed using PROC
2.3 Results
2.3.1 Soil organic carbon and total nitrogen
The LUC to support sugarcane expansion induced significant SOC losses in the three study sites (Figure 5). At Lat_17S and Lat_21S the conversion from native vegetation to pasture resulted in SOC reductions in all soil layers, representing losses of approximately 40% in the 0-30 cm layer. In contrast, short-term (<5 years) conversion from pasture to sugarcane did not induced significant SOC changes (Figure 5A,C,E). At Lat_23S, the SOC contents in natural ecosystem is higher than others study sites, averaged 37, 33 and 30 g kg-1 for 0-10, 10-20 and 20-30 cm layers. The soils at this site have much higher clay content (Table 1). Conversion from native vegetation to pasture promoted significant SOC changes only in the subsurface layer (20-30 cm) (Figure 5C). After >20 years of conversion from pasture to sugarcane were observed severe SOC losses, decreasing from 36.4 to 18.9 g kg-1 (0-10 cm), from 27.6 to 18.4 g kg-1 (10-20 cm) and from 20.6 to 17.3 g kg-1 (20-30 cm).
The TN response to LUC was similar to that quantified for SOC (Figure 5). At Lat_17S and Lat_21S conversion from native vegetation to pasture led to NT losses of approximately 42% and 55%, respectively (0-30 cm layer) (Figure 5 B,D,F). In general, short-term conversion from pasture to sugarcane had no negative impacts on TN, even some increases were found for the subsurface soil layers (10-20 and 20-30 cm) at Lat_17S. Similar to verified for SOC, long-term conversion from native vegetation to pasture and then from pasture to sugarcane induced significant soil TN losses at Lat_23S.
Figure 5 - Soil organic carbon (A;C;E) and total nitrogen (B;D;F) in the 0-10, 10-20 and 20-30 cm layers, respectively, under native vegetation (NV), pasture (PA) and sugarcane (SC) at Lat_17S, Lat_21S and Lat_23S in central-southern Brazil. *Mean values within each site in same depth followed by the same letter do not differ among themselves according to Tukey’s test (p<0.05). Error bars denote standard deviation of the mean
a* a a b b a
b b
b 0 5 10 15 20 25 30 35 40 45
Lat_17S Lat_21S Lat_23S
So il or ga nic ca rb on (g k g -1) Native vegetation Pasture Sugarcane A a a a b b b
b b
c 0.0 0.5 1.0 1.5 2.0 2.5 3.0 3.5 4.0
Lat_17S Lat_21S Lat_23S
To ta l n itro ge n (g k g -1) Native vegetation Pasture Sugarcane B a a a
b b
a
b b
b 0 5 10 15 20 25 30 35 40 45
Lat_17S Lat_21S Lat_23S
So il or ga nic ca rb on (g k g -1) C a a a
b b
ab
a b
b 0.0 0.5 1.0 1.5 2.0 2.5 3.0 3.5 4.0
Lat_17S Lat_21S Lat_23S
To ta l n itro ge n (g k g -1) D
a a
a
b b
b
a b
b 0 5 10 15 20 25 30 35 40 45
Lat_17S Lat_21S Lat_23S
So il or ga nic ca rb on (g k g -1) E a a a
b b
b
ab b
b 0.0 0.5 1.0 1.5 2.0 2.5 3.0 3.5 4.0
Lat_17S Lat_21S Lat_23S
Figure 6 - Soil organic carbon (solid line) and total nitrogen (dashed line) for the 0-30 cm
layer under native vegetation (NV), pasture (PA) and sugarcane (SC) in the
regional scale in central-southern Brazil. *Mean values of each element followed by the same letter do not differ among themselves according to Tukey’s test (p<0.05). Sites were
considered as blocks randomized
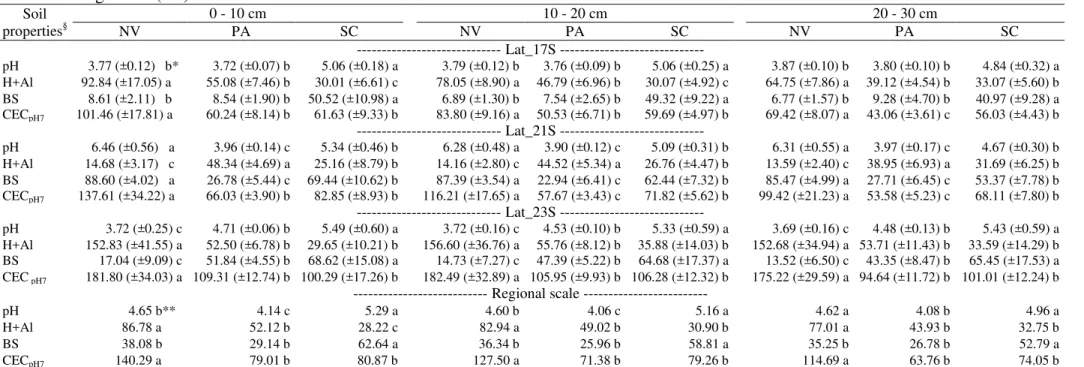
2.3.2 Soil acidity attributes and CECpH7
The soil pH measured at each site was lower of ideal range for plants growth (pH < 5.5-6.0) (Table 3). In general, conversion from native vegetation to pasture decreased pH and BS values. At Lat_21S, the soil had higher pH and BS, and lower H+Al compared to the other sites and land uses (Table 3), most likely due to recent historical forest understory burning, because remains of ash were found on the soil surface. Sugarcane cultivation replacing pasture promoted significant decreases in both the active and potential acidity and consequently, BS was increased. However, in the sugarcane soils still remain acidity problems for crop, since the average pH (0-30 cm) was between 5.0 (Lat_17S; Lat_21S) and 5.5 (Lat_23S), BS values were 45% (Lat_17S), 60% (Lat_21S) and 65% (Lat_23S), and H+Al contents approximately of 30 mmolc dm-3. At the regional scale, this same response was confirmed, where sugarcane soils have lower acidity and higher BS, pasture soils have the greatest active acidity, and native vegetation sites have the highest potential acidity (soil electric charges are saturated with H+ and Al3+). The LUC led to significant decrease of CECpH7 from native vegetation to pasture, but were not observed differences from pasture to sugarcane (Table 3) for all sites.
0.0 0.5 1.0 1.5 2.0 2.5 3.0 0 5 10 15 20 25
Native vegetation Pasture Sugarcane
2.3.3 Soil macro- and micro-nutrients
Overall, higher Ca and Mg contents were found under sugarcane (Table 4) as function of lime application to neutralize soil acidity. Native vegetation at Lat_21S was an exception, because the effects of forest understory burning and ash (earlier commented) increased the Ca and Mg contents in the surface soil. There were significant improvements in K contents under pasture soils at the Lat_21S and Lat_23S compared to native vegetation and sugarcane (Table 4). Overall, K contents under pasture soils were 28 and 30% higher than native vegetation and sugarcane soils for the 0-30 cm layer. Native vegetation and sugarcane showed no significant K differences among themselves.
The lowest available P contents were found at Lat_17S site (Table 4), where the soil is in more advanced weathering stage [i.e., lower Ki and Kr indexes (Table 1)]. Conversion from native vegetation to pasture significantly decreased available P by 40% at Lat_17S, 65% at Lat_21S and 27% at Lat_23S, with an average of 42% at the regional scale for the 0-30 cm layer. Under sugarcane soils P contents were similar to those under pasture (Lat_23S and regional scale) or under native vegetation (Lat_17S and Lat_21S). There were significant reductions of S-sulphate contents (Table 4) due to conversion from native vegetation to pasture at Lat_23S and from pasture to sugarcane at the Lat_21S and Lat_23S. In contrast, there was no S differences between native vegetation and pasture at Lat_17S; and sugarcane soil had the highest S values due to gypsum application before sugarcane planting (Table 2).
Table 3 - Soil acidity properties and CECpH7 from 0-10, 10-20 and 20-30 cm soil layers under native vegetation (NV), pasture (PA) and sugarcane (SC) in central-southern Brazil
Soil
properties§ NV 0 - 10 cm PA SC NV 10 - 20 cm PA SC NV 20 - 30 cm PA SC
Lat_17S
---pH 3.77 (±0.12) b* 3.72 (±0.07) b 5.06 (±0.18) a 3.79 (±0.12) b 3.76 (±0.09) b 5.06 (±0.25) a 3.87 (±0.10) b 3.80 (±0.10) b 4.84 (±0.32) a H+Al 92.84 (±17.05) a 55.08 (±7.46) b 30.01 (±6.61) c 78.05 (±8.90) a 46.79 (±6.96) b 30.07 (±4.92) c 64.75 (±7.86) a 39.12 (±4.54) b 33.07 (±5.60) b BS 8.61 (±2.11) b 8.54 (±1.90) b 50.52 (±10.98) a 6.89 (±1.30) b 7.54 (±2.65) b 49.32 (±9.22) a 6.77 (±1.57) b 9.28 (±4.70) b 40.97 (±9.28) a CECpH7 101.46 (±17.81) a 60.24 (±8.14) b 61.63 (±9.33) b 83.80 (±9.16) a 50.53 (±6.71) b 59.69 (±4.97) b 69.42 (±8.07) a 43.06 (±3.61) c 56.03 (±4.43) b
Lat_21S
---pH 6.46 (±0.56) a 3.96 (±0.14) c 5.34 (±0.46) b 6.28 (±0.48) a 3.90 (±0.12) c 5.09 (±0.31) b 6.31 (±0.55) a 3.97 (±0.17) c 4.67 (±0.30) b H+Al 14.68 (±3.17) c 48.34 (±4.69) a 25.16 (±8.79) b 14.16 (±2.80) c 44.52 (±5.34) a 26.76 (±4.47) b 13.59 (±2.40) c 38.95 (±6.93) a 31.69 (±6.25) b BS 88.60 (±4.02) a 26.78 (±5.44) c 69.44 (±10.62) b 87.39 (±3.54) a 22.94 (±6.41) c 62.44 (±7.32) b 85.47 (±4.99) a 27.71 (±6.45) c 53.37 (±7.78) b CECpH7 137.61 (±34.22) a 66.03 (±3.90) b 82.85 (±8.93) b 116.21 (±17.65) a 57.67 (±3.43) c 71.82 (±5.62) b 99.42 (±21.23) a 53.58 (±5.23) c 68.11 (±7.80) b
Lat_23S
---pH 3.72 (±0.25) c 4.71 (±0.06) b 5.49 (±0.60) a 3.72 (±0.16) c 4.53 (±0.10) b 5.33 (±0.59) a 3.69 (±0.16) c 4.48 (±0.13) b 5.43 (±0.59) a H+Al 152.83 (±41.55) a 52.50 (±6.78) b 29.65 (±10.21) b 156.60 (±36.76) a 55.76 (±8.12) b 35.88 (±14.03) b 152.68 (±34.94) a 53.71 (±11.43) b 33.59 (±14.29) b BS 17.04 (±9.09) c 51.84 (±4.55) b 68.62 (±15.08) a 14.73 (±7.27) c 47.39 (±5.22) b 64.68 (±17.37) a 13.52 (±6.50) c 43.35 (±8.47) b 65.45 (±17.53) a CEC pH7 181.80 (±34.03) a 109.31 (±12.74) b 100.29 (±17.26) b 182.49 (±32.89) a 105.95 (±9.93) b 106.28 (±12.32) b 175.22 (±29.59) a 94.64 (±11.72) b 101.01 (±12.24) b
-- Regional scale
---pH 4.65 b** 4.14 c 5.29 a 4.60 b 4.06 c 5.16 a 4.62 a 4.08 b 4.96 a H+Al 86.78 a 52.12 b 28.22 c 82.94 a 49.02 b 30.90 b 77.01 a 43.93 b 32.75 b BS 38.08 b 29.14 b 62.64 a 36.34 b 25.96 b 58.81 a 35.25 b 26.78 b 52.79 a CECpH7 140.29 a 79.01 b 80.87 b 127.50 a 71.38 b 79.26 b 114.69 a 63.76 b 74.05 b §pH CaCl
2: potential of hydrogen in solution of CaCl2 0,01 mol L-1 (1:2,5) – active acidity; H+Al: potential acidity (mmolc dm-3); BS: base saturation (%); CECpH7: cations
exchange capacity potential (mmolc dm-3); *Mean values (“n” = 9) and standard deviation between brackets, mean values in line within each depth, followed by the same
Table 4 - Soil macronutrient contents from 0-10, 10-20 and 20-30 cm soil layers under native vegetation (NV), pasture (PA) and sugarcane (SC) in central-southern Brazil
Soil macronutrients
0 - 10 cm 10 - 20 cm 20 - 30 cm
NV PA SC NV PA SC NV PA SC
Lat_17S
---Ca (mmolc dm-3) 4.24 (±1.28) b* 3.02 (±0.78) b 21.74 (±9.32) a 2.63 (±0.63) b 2.18 (±0.80) b 20.19 (±5.29) a 2.14 (±0.67) b 2.29 (±1.04) b 15.66 (±4.02) a Mg (mmolc dm-3) 3.36 (±0.89) b 1.62 (±0.49) c 9.26 (±1.93) a 2.33 (±0.62) b 1.07 (±0.32) b 8.86 (±1.87) a 1.83 (±0.42) b 1.17 (±0.85) b 6.86 (±1.34) a K (mmolc dm-3) 1.02 (±0.12) a 0.61 (±0.13) b 0.61 (±0.18) b 0.78 (±0.09) a 0.49 (±0.07) b 0.57 (±0.17) b 0.69 (±0.10) a 0.48 (±0.16) b 0.46 (±0.11) b P (mg dm-3) 5.56 (±0.86) a 3.02 (±0.37) b 7.31 (±2.46) a 4.53 (±0.37) b 2.58 (±0.25) c 7.00 (±1.91) a 3.51 (±0.35) b 2.47 (±0.39) c 4.67 (±1.19) a S (mg dm-3) 4.18 (±2.47) b 3.22 (±1.67) b 9.67 (±3.64) a 2.41 (±1.20) b 2.67 (±0.78) b 14.00 (±4.95) a 2.37 (±1.05) b 2.15 (±0.71) b 26.07 (±9.69) a
Lat_21S
---Ca (mmolc dm-3) 101.56 (±34.93) a 8.30 (±1.53) c 39.02 (±8.11) b 82.52 (±19.19) a 6.27 (±1.77) c 29.79 (±5.74) b 69.22 (±21.01) a 8.01 (±1.73) c 24.24 (±6.47) b Mg (mmolc dm-3) 18.62 (±3.58) a 5.21 (±0.99) b 15.59 (±3.87) a 16.66 (±3.01) a 3.48 (±0.85) c 12.36 (±2.78) b 14.23 (±2.80) a 3.53 (±0.72) c 9.54 (±1.46) b K (mmolc dm-3) 2.78 (±0.50) b 4.17 (±1.53) a 3.09 (±1.03) ab 2.89 (±0.47) a 3.41 (±1.11) a 2.91 (±1.03) a 2.39 (±0.67) b 3.08 (±0.83) a 2.63 (±0.84) ab P (mg dm-3) 17.33 (±4.01) a 7.08 (±1.69) b 19.60 (±5.85) a 12.53 (±2.53) a 3.91 (±1.12) b 13.22 (±3.59) a 9.87 (±2.49) a 3.20 (±0.57) b 7.76 (±2.47) a S (mg dm-3) 8.52 (±1.82) a 8.46 (±1.98) a 5.19 (±1.60) b 8.11 (±1.46) ab 8.48 (±2.38) a 6.19 (±1.46) b 7.26 (±1.72) a 9.15 (±2.10) a 7.70 (±3.26) a
Lat_23S
---Ca (mmolc dm-3) 17.11 (±6.79) c 32.58 (±6.68) b 47.51 (±17.97) a 15.31 (±8.01) b 29.57 (±5.19) b 48.77 (±18.43) a 12.86 (±5.66) b 24.61 (±5.21) b 47.14 (±17.79) a Mg (mmolc dm-3) 9.06 (±3.41) b 19.88 (±2.67) a 20.06 (±6.98) a 8.14 (±3.05) b 16.16 (±2.10) a 19.32 (±7.02) a 7.38 (±2.51) c 12.27 (±4.34) b 18.30 (±6.32) a K (mmolc dm-3) 2.79 (±1.12) b 4.35 (±0.59) a 3.08 (±1.02) b 2.44 (±0.69) b 4.46 (±0.47) a 2.32 (±0.82) b 2.31(±0.69) b 4.05 (±0.63) a 1.98 (±0.73) b P (mg dm-3) 14.29 (±3.26) a 11.47 (±3.72) ab 8.85 (±2.55) b 12.38 (±2.98) a 9.80 (±2.40) ab 8.58 (±2.76) b 10.98 (±2.70) a 7.56 (±2.88) b 7.18 (±2.62) b S (mg dm-3) 15.81 (±3.86) a 9.08 (±3.38) b 5.29 (±1.45) c 16.00 (±3.94) a 7.30 (±3.21) b 5.19 (±2.01) b 15.85 (±3.85) a 6.74 (±3.90) b 5.50 (±3.16) b
--- Regional scale
---Ca (mmolc dm-3) 40.97 a** 14.88 b 35.65 a 33.49 a 12.67 b 32.91 a 28.07 a 11.64 b 28.32 a Mg (mmolc dm-3) 10.34 b 9.05 b 14.77 a 9.04 b 6.90 b 13.51 a 7.81 b 5.66 b 11.31 a K (mmolc dm-3) 2.19 b 3.00 a 2.23 b 2.04 b 2.79 a 1.93 b 1.80 b 2.54 a 1.68 b P (mg dm-3) 12.39 a 7.19 b 12.04 a 9.81 a 5.43 b 9.60 a 8.12 a 4.41 c 6.51 b S (mg dm-3) 9.51 a 6.86 b 6.77 b 8.84 a 6.15 a 8.46 a 8.49 ab 6.01 b 13.38 a