Effect of sialic acid loss on dendritic cell maturation
Introduction
Sialic acids are typically found as terminal monosaccha-rides of glycans carried by cell surface glycoproteins. Over 20 different sialyltransferases are known to mediate the sialylation and generate sialic acid diversity.1,2As a result
of their terminal position, sialic acids are key structural determinants for a number of cell surface receptors involved in the immune response, such as the Siglecs and selectins (reviewed in refs 3 and 4). Sialic acid moieties are also ligands for a diverse array of exogenous lec-tins, from other host cells and invasive pathogens.5 He´lio J. Crespo,1M. Guadalupe
Cabral,1Alexandra V. Teixeira,1 Joseph T. Y. Lau,2 He´lder Trindade1 and Paula A. Videira1
1Departamento de Imunologia FCM-UNL,
Campo Ma´rtires da Pa´tria 130, Lisboa, Portugal, and2Department of Molecular & Cellular Biology, Roswell Park Cancer Insti-tute, Buffalo, NY, USA.
doi:10.1111/j.1365-2567.2009.03047.x Received 23 July 2008; revised 2 December 2008; accepted 16 December 2008. Correspondence: Dr P. A. Videira, Departamento de Imunologia FCM-UNL, Campo Ma´rtires da Pa´tria 130, 1169-056 Lisboa, Portugal.
Email: [email protected] Senior author: Paula A. Videira
Summary
Sialic acids are key structural determinants and contribute to the func-tionality of a number of immune cell receptors. Previously, we demon-strated that differentiation of human dendritic cells (DCs) is accompanied by an increased expression of sialylated cell surface structures, putatively through the activity of the ST3Gal.I and ST6Gal.I sialyltransferases. Fur-thermore, DC endocytosis was reduced upon removal of the cell surface sialic acid residues by neuraminidase. In the present work, we evaluate the contribution of the sialic acid modifications in DC maturation. We demonstrate that neuraminidase-treated human DCs have increased expression of major histocompatibility complex (MHC) and costimulatory molecules, increased gene expression of specific cytokines and induce a higher proliferative response of T lymphocytes. Together, the data suggest that clearance of cell surface sialic acids contributes to the development of a T helper type 1 proinflammatory response. This postulate is supported by mouse models, where elevated MHC class II and increased maturation of specific DC subsets were observed in DCs harvested from ST3Gal.I)/) and ST6Gal.I)/)mice. Moreover, important qualitative differences, partic-ularly in the extent of reduced endocytosis and in the peripheral distribu-tion of DC subsets, existed between the ST3Gal.I)/) and ST6Gal.I)/) strains. Together, the data strongly suggest not only a role of cell surface sialic acid modifications in maturation and functionality of DCs, but also that the sialic acid linkages created by different sialyltransferases are functionally distinct. Consequently, with particular relevance to DC-based therapies, cell surface sialylation, mediated by individual sialyl-transferases, can influence the immunogenicity of DCs upon antigen loading.
Keywords: cell maturation; dendritic cell; major histocompatibility com-plex; sialic acid; tumour immunity
Abbreviations: BMDC, bone marrow-derived dendritic cell; CFSE, carboxyfluorescein diacetate succinimidyl ester; DC, dendritic cell; FITC, fluorescein isothiocyanate; GAPDH, glyceraldehyde 3-phosphate dehydrogenase; GM-CSF, granulocyte–macrophage colony-stimulating factor; IL, interleukin; mAb, monoclonal antibody; MFI, mean fluorescence intensity; MHC, major
histocompatibility complex; moDC, monocyte-derived dendritic cell; PCR, polymerase chain reaction; PE, phycoerythrin; Th1, T helper type 1; TNF, tumour necrosis factor; TT, tetanus toxoid; WT, wild-type.
Deficiencies in specific sialylation result in immunological abnormalities in animal experiments, such as aberrant T-lymphocyte counts in the mice deficient for ST3Gal.I,6 and altered B-lymphocyte proliferation in mice deficient for ST6Gal.I.7
Dendritic cells (DCs) are special antigen-presenting cells that uptake, process and present antigens found in periph-eral blood and tissues to lymphocytes and regulate cellular and humoral immune responses.8Antigen uptake, as well as inflammatory stimuli, induces DC maturation, enabling DC interaction with T lymphocytes and the initiation of adaptive immune responses.9Maturation of DC is charac-terized by phenotypic and physiological changes, i.e. the antigen-uptake machinery is down-regulated10 and the expression of surface major histocompatibilty complex class II (MHC II), class I (MHC I) and costimulatory mole-cules, such as CD80 and CD86, is up-regulated.11 Ultimately, the synthesis of DC-specific cytokines is chan-ged12 contributing to the polarization towards T helper type 1 (Th1) or type 2 (Th2),13 with the type and context of stimuli and the consequent activation state of DC affect-ing its Th1- or Th2-promotaffect-ing effector function.13
As a result of their role in initiating the specific immune response, monocyte-derived DCs (moDCs) are currently used in immune adoptive vaccine protocols to treat cancer patients.14 However under some circum-stances (such as lack of or inappropriate maturation), DCs can also induce and maintain antigen tolerance,15,16 a situation counterproductive to the therapeutic value of DC therapy.
Currently, there is great interest in altering the DC immunogenicity towards Th1-promoting cells, and subse-quent use in immunotherapy against cancer, because most tumour antigens are self antigens and therefore poor immunogens. The identification of mechanisms for DC activation is critical to more successful exploitation of the DC modality in the prevention and treatment of cancer.
Evidence from different groups suggests that the state of sialylation of DCs may influence their response.17,18 We have previously studied the surface sialylation of human moDCs and we observed a significantly increased expression of sialylated structures during the differentia-tion of monocytes into moDCs, most probably as the result of the activity of ST3Gal.I and ST6Gal.I sial-yltransferases.19 In addition, we have also observed that the removal of the sialylated structures by neuraminidase treatment diminished the moDC capacity for endocyto-sis,19 suggesting a triggering of DC maturation. Boog
et al.17, showed that removal of sialic acid restored spe-cific immune responses to mice non-responder DCs, leading to the proposal that reduction of sialic acid con-tributed to DC activation. In the present study we analy-sed the consequences of reduced sialylation, in human DCs, to evaluate its contribution to the triggering of cell maturation.
Our data demonstrated that neuraminidase treatment results in increased expression of MHC and costimulatory molecules, and affects some aspects of the functionality of human DCs. Namely, neuraminidase-treated DCs show increased gene transcription of proinflammatory and Th1-promoting cytokines and induce greater proliferative responses of T lymphocytes. To correlate a specific sialyla-tion deficiency with the triggering of DC maturasialyla-tion, we also analysed DCs from ST3Gal.I)/) and ST6Gal.I)/)
mice. The expression of specific maturation markers were examined in ex vivo DCs obtained from blood, lymph nodes and spleen. The results show an increased expres-sion of MHC II molecules in ST6Gal.I)/)DCs, mainly in
the B220+ DC subset. The DCs differentiated in vitro
from bone marrow progenitors (BMDCs) of both defi-cient mouse strains presented increased expression of MHC II molecules and a reduced capacity for endocyto-sis, when compared with wild-type (WT) mice with nor-mal sialyltransferase expression profiles. Overall, these data suggest a novel role for the sialylated glycans; in par-ticular, those generated by ST3Gal.I and ST6Gal.I sial-yltransferases, in the modulation of the DC maturation state. Finally, we suggest that the immunogenicity of anti-gen-loaded DCs used in cell vaccines may depend on its sialylation content.
Materials and methods
Media and reagents
RPMI-1640 supplemented with 10% fetal calf serum from Sigma (St Louis, MO, USA), 2 mM L-glutamine, 1% non-essential amino acids, 1% pyruvate, 100lg/ml penicillin/ streptomycin and 50lM2-mercaptoetanol, all from Gib-co-Invitrogen (Paisley, UK) was used throughout this study for cell culture. Human and mouse recombinant interleukin-4 (IL-4) and granulocyte–macrophage colony-stimulating factor (GM-CSF) were purchased from R&D Systems (Minneapolis, MN). Neuraminidase from Clos-tridium perfringens and collagenase D from Clostridium histolyticum were from Roche Diagonostics (Basel, Swit-zerland). Tetanus toxoid (TT) and mitomycin C were purchased from Sigma. Fluorescein isothiocyanate (FITC) -conjugated ovalbumin and carboxyfluorescein diacetate succinimidyl ester (CFSE) were purchased from Molecular Probes (Leiden, the Netherlands). Phytohaemagglutinin was obtained from Fluka (Buchs, Switzerland). Anti-human, mouse and isotype control monoclonal anti-bodies (mAbs) were purchased from BD Pharmingen (San Diego, CA), except when otherwise stated.
Human cell isolation and generation of DCs
CD14 antibody-coated magnetic beads (Miltenyi Biotech, Bergisch Gladbach, Germany), from peripheral blood mononuclear cells (PBMCs) of healthy volunteers pro-vided and ethically approved by the Portuguese Blood Institute. Monocytes were cultured in complete RPMI-1640 medium supplemented with 1000 U/ml of recombi-nant human IL-4 (rhIL-4) and rhGM-CSF, for 6 days, to give rise to immature moDC.
For T-lymphocyte proliferation assays, moDCs were generated, as described above, from monocytes isolated, after informed consent, from PBMCs of healthy volun-teers who had been vaccinated with TT within the previ-ous 12 months. In these cases, the negative fractions (CD14) PBMCs), obtained after monocyte isolation,
were maintained in culture until mixed lymphocyte cul-tures with autologous moDCs. On day 5, moDCs were pulsed with or without 5lg/ml TT and, 18 hr later, moDCs were inactivated with 005 mg/ml mitomycin C
for 30 min and washed three times with 10 ml RPMI-1640 medium. These conditions were previously opti-mized, by testing different parameters described in the literature.20,21
Neuraminidase treatment
Cells were resuspended in RPMI-1640 (5·106/ml) and treated with 200 mU/ml neuraminidase in serum-free RPMI for 90 min at 37. In parallel, identical samples were mock-treated in the same conditions with heat-inactivated neuraminidase (20 min at 100).
Phenotypical analysis of human moDC maturation
For the analysis of the moDC maturation phenotype, 2·105 cells were first incubated with 01 mg/ml of FITC-conjugated ovalbumin, in RPMI-1640 + 10% fetal calf serum, for 1 hr, at 4 or 37. Following incubation, moDCs were treated or mock-treated with neuraminidase as described above. Half of the cells were reserved for RNA extraction and real-time polymerase chain reaction (PCR). The remaining cells were washed with FACS Flow (BD Biosciences, Franklin Lakes, NJ) and stained with either phycoerythrin (PE)-labelled anti-human leucocyte antigen (HLA)-DR (L243), anti-HLA-ABC (W6/32) (Dako Glostrup, Denmark), anti-CD80 (L307.4) or PE-Cy5-labelled anti-CD86 (IT2.2) and analysed by flow cytometry. All samples were analysed using a FacsCalibur Flow cytometer and CELL QUEST (BD Biosciences) and INFINICYTsoftware (Cytognos, Spain).
Real-time PCR
The RNA was extracted from 1·106 moDCs using the RNeasy Mini Kit (Qiagen, Chatsworth, CA) and genomic DNA was eliminated with the RNase-Free DNase Set
(Qiagen), as described by the manufacturer. The concen-trations of the RNA samples were determined spectro-photometrically. The RNA was reverse transcribed with random primers using the High Capacity cDNA Reverse Transcription Kit (Applied Biosystems, Foster City, CA).
time PCR was performed in a 7500 Fast Real-Time PCR System (Applied Biosystems) using TaqMan Fast Universal PCR Master Mix, TaqMan
probes and primers provided by Applied Biosystems. The assay ID provided by the manufacturer are the following: CD1a
(Hs00233332_m1); CD1b (Hs00233507_m1), CD1c
(Hs00233509_m1); IL-6 (Hs00174131_m1); IL-12a
(Hs00168405_m1); IL-1b (Hs00174097_m1); tumour necrosis factor-a (TNF-a; Hs00174128_m1); IL-10
(Hs00174086_m1); b-actin (4352935E); glyceraldehyde 3-phosphate dehydrogenase (GAPDH; 4333764F). Each reaction was performed in duplicate. Thermal cycling conditions were 95for 20 seconds followed by 40 cycles of 95for 3 seconds and 60for 30 seconds.
The messenger RNA (mRNA) expression was normal-ized using the geometric mean of the expression of the
b-actin and GAPDH genes as a reference. The relative expression for each gene was calculated according to the 2)DDCt method described by Livak and Schmittgen.22 The efficiency of the amplification reaction for each primer/ probe is above 95% (as determined by the manufacturer).
T-lymphocyte proliferation assays
CD14-negative PBMCs, obtained as described above, were labelled with 556lg/ml CFSE, for 15 min at 37,
accord-ing to the manufacturer’s instructions. The labelled cells were then incubated with the autologous, TT-loaded moD-Cs (treated or mock-treated with neuraminidase), in the proportion of 8 : 1, in a 96-well round-bottom plate, for 7 days. As a positive control for T-lymphocyte prolifera-tion, PBMCs were stimulated with 2lg/ml phytohaema-gglutinin, for 3 days. Evaluation of the T-lymphocyte proliferation was performed by flow cytometry, after stain-ing the samples with allophycocyanin-labelled anti-CD3 (clone 33-2A3) (Immunostep, Salamanca, Spain). The number of proliferating T lymphocytes was calculated as the percentage of CD3+ cells, with decreased CFSE fluorescence.
Isolation and generation of mice DCs
ST3Gal.I)/)
and ST6Gal.I)/)
mice were obtained from the Consortium For Functional Glycomics and originally pro-vided by Priatel et al.6 and Hennet et al.7, respectively.
ST3Gal.I)/), ST6Gal.I)/) and C57BL/6 mice were
killed by asphyxiation with CO2; their spleen and axillar
lymph nodes were removed and their blood was col-lected by cardiac puncture into tubes containing ethy-lenediaminetetraacetic acid. Cells from spleens and the axillar lymph nodes were obtained by flushing with cul-ture medium and mechanical disruption. Spleens were also incubated for 20 min at 37 with collagenase D (1 mg/ml) and submitted to red blood cell lysis (Tris– HCl 017M, NH4Cl 016M) for 5 min at room temper-ature.
The BMDC were obtained mainly as described previ-ously.23 Briefly, the bone marrow was flushed from tibiae and femurs with complete medium. The cell suspension was filtered and exposed to red blood cell lysis as described above. Bone marrow cells were cultured at 5·105cells/ml on six-well plates, in culture medium supplemented with GM-CSF and IL-4, for 6 days. The resulting DCs were then magnetically separated by anti-CD11c antibody-coated-magnetic beads (Miltenyi) and confirmed by anti-CD11c staining. The average separation efficiency was at least 85%.
Endocytosis and phenotypic analysis of BMDCs
The endocytosis assays with mouse BMDCs were per-formed by minor modifications of the above described moDCs endocytosis assay. Briefly, 3·105cells/ml of BMDC were incubated, for 30 min, with FITC-conjugated ovalbumin at a final concentration of 005 mg/ml, at 4
or 37. After stopping the reaction, the cells were stained with PE-labelled anti-MHC II (I-Ab) (AF6-1201). To
neutralize fluorescent ovalbumin linkage at the cell sur-face, trypan blue was added and cells were washed twice before acquisition by flow cytometry.
Flow cytometry analysis of mouse DC subsets
Blood, lymph node and splenic cells were stained with allophycocyanin-labelled anti-CD11c (HL3), peridinin chlorophyll protein-labelled anti-CD8a (53-6.7) or FITC-labelled anti-B220(RA3-6B2) in combination with anti-CD11b (NS-1), anti-CD86 (GL1) or anti-MHC II (I-Ab) (AF6-120.1) PE-labelled mAbs. Samples were analysed as described above. The DCs were considered CD11c- and I-Ab-positive cells. The cut-off point for positive staining was above the level of the control iso-type mAbs.
Statistical analysis
Statistical comparison between two different groups was performed using Student’s t-test (GRAPHPAD, GraphPad Software, La Jolla, CA). Statistical significance was defined asP< 005.
Results
Clearance of cell surface sialic acids by neuraminidase treatment enhances cell surface expression of MHC I, MHC II, CD80 and CD86
In our previous work, we have shown that human moDCs, after treatment with neuraminidase, had a lower endocytosis capacity (only 75% uptake of ovalbumin).19 A possible explanation for this observation is that neur-aminidase treatment triggered DC maturation, a process known to be accompanied by diminished antigen uptake. DC activation was unlikely to be the result of heat stable factors in the neuraminidase preparation, such as bacterial endotoxins, because control DCs treated in parallel with heat-inactivated neuraminidase did not show decreased endocytosis. To assess maturation status of the DCs after neuraminidase treatment, we have analysed, by flow cytometry, the expression of MHC I and MHC II and the costimulatory molecules, CD80 and CD86, by moDCs during endocytosis and when treated with neuraminidase. The efficiency of the neuraminidase treatment was evalu-ated by appropriate lectin binding assays as described elsewhere19(data not shown).
At the end of endocytosis, the expression level of MHC I, MHC II, CD80 and CD86 molecules was significantly higher in the moDCs treated with neuraminidase com-pared with mock-treated cells (Fig. 1). To further investi-gate whether this increased expression was mainly the result of the neuraminidase treatment itself, we have also performed control assays with moDCs which had not undergone endocytosis (assays performed at 4). Accord-ing to our results, the expression level of these markers was also significantly elevated in the cells treated with neuraminidase, although, except for MHC I, with less extent (Fig. 1). Control assays with the moDCs incubated in the absence of the endocytic agent, were comparable to the assays carried out at 4 in the presence of the agent (data not shown). The neuraminidase treatment causes a significant increase of MHC I and MHC II expression in moDCs, as well as the expression of costimulatory mole-cules, CD80 and CD86, and this is even more eminent when followed by endocytosis.
Altered expression of cytokines in neuraminidase-treated DCs
To investigate the functional consequence of the exposure of human moDCs to neuraminidase, the expression of
IL-6,IL-12a,IL-1b,TNF-aandIL-10mRNAs were analy-sed by quantitative real-time PCR. Although there was some sample-to-sample variation, at the end of endo-cytosis, all neuraminidase-treated moDC samples had increased levels of IL-6 (around 2 to 50-fold) compared
with the corresponding mock-treated moDCs (Fig. 2). The mRNAs for IL-12a, IL-1b and TNF-a were also aug-mented by the neuraminidase treatment in the majority of the samples, although in one out of five samples this increase was almost insignificant (Fig. 2). Regarding the
IL-10 expression, even though a number of moDC sam-ples presented ± twofold increased expression, after endocytosis and neuraminidase treatment, two out of five samples showed a slight IL-10 down-regulation (Fig. 2). As above, we also investigated the effect of neuraminidase itself, by analysing the expression of these cytokines in the moDCs which had not undergone endocytosis. Our results showed that the neuraminidase treatment per se
led to a similar increased expression of IL-12a and IL-6
(Fig. 2). For the IL-10, IL-1b and TNF-a, there was an up-regulation slightly higher than the neuraminidase-treated moDCs which had undergone endocytosis (Fig. 2). Therefore, removing the sialic acid in moDCs led to an increased expression of IL-6, IL-1b, IL-12a and
TNF-a genes. However, the range of up-regulation seemed to depend upon the individual donor and to be slightly lessened during endocytosis.
Increased T-lymphocyte priming induced by neuraminidase-treated human DCs
To further investigate the functional effect of neuramini-dase treatment on human DCs, we evaluated the ability of 0
1000 2000 3000 4000 5000 6000
MT - 37°
T - 37°
MT - 4°
T - 4°
0 50 100 150 200 250
CD80 CD86
MT - 37°
T - 37°
MT - 4°
T - 4°
MHC I MHC II
* * * *
* * * *
*
*
* *
MFI
MFI
Figure 1.Increased expression of major histocompatibility complex
class II (MHC II), class I MHC I, CD80, CD86 in human mono-cyte-derived dentritic cells (moDCs) after neuraminidase treatment. Neuraminidase treated (T) or mock-treated (i.e. inactivated neur-aminidase) (MT) moDCs were pulsed with the endocytic agent oval-bumin (005 mg/ml) and incubated for 1 hr at 37or 4(control). After the endocytosis assay, the expression of MHC II (HLA DR), MHC I (HLA ABC) and the costimulatory molecules CD80 and CD86 were evaluated by flow cytometry. The results are the mean fluorescence intensity (MFI) of at least three individual experiments ± SEM. Significantly different values (*P< 005 or **P< 001 paired Student’s t-test) were observed for all the maturation markers employed, comparing neuraminidase-treated with mock-treated human moDCs, either in cells that had internalized ovalbumin (assay at 37) or in the control cells (assay at 4).
0·1 IL-6
RQ
IL-12α IL-1β TNF-α IL-10 37° 4°
1 10 100 1000
Figure 2. Expression of cytokines is altered in neuraminidase-treated
human monocyte-derived dendritic cells (moDCs). Neuraminidase treated and mock-treated (i.e. inactivated neuraminidase) moDCs were pulsed with ovalbumin, as described in theMaterials and meth-ods. After endocytosis, total RNA was used to generate complemen-tary DNA that was analysed by real-time polymerase chain reaction. Boxes represent minimum and maximum of the mean relative expression, RQ, (± SEM) of interleukin-6 (IL 6), IL-12a, IL-1b, tumour necrosis factor-a (TNF-a) and IL-10 genes. The results (median with interquartile range) represent the expression of a given gene in five different neuraminidase-treated moDCs compared with the expression in the respective mock-treated moDCs. Values above or below one indicate, respectively, over-expression or down-regula-tion of a specific gene after neuraminidase treatment of moDCs, either in cells that have internalized ovalbumin (assay at 37) or in
either neuraminidase-treated or mock-treated moDC to induce autologous T-lymphocyte proliferation. We have performed mixed lymphocyte cultures with moDCs loaded with TT, treated or mock-treated with neuraminidase, and autologous CFSE-labelled T lymphocytes. According to our results, the number of proliferating T lymphocytes is significantly increased when antigen-loaded moDCs lose their surface sialic acid (Fig. 3), as the mean value for mixed lymphocyte cultures with moDCs loaded with TT, treated or mock-treated with neuraminidase were 51% and 39% of CD3+ cells, respectively (P= 003). It should be
noted that the immunogenicity of ovalbumin-pulsed DCs and TT-pulsed DCs may not be the same. Nevertheless, we chose TT as antigen and not ovalbumin because of the spe-cific need for antigen-spespe-cific human lymphocyte respond-ers for the mixed lymphocyte culture.
DCsex vivofrom ST6Gal.I)/)mice show an augmented cell surface expression of MHC II
In our previous work, we studied the sialyltransferases involved in human moDC sialylation and highlighted the
significant contribution of ST3Gal.I and ST6Gal.I.19 Having observed that neuraminidase treatment induced DC maturation we wished to further inspect the type of sialylation, whose shortage was involved in this process, by focusing on ST3Gal.I-deficient and ST6Gal.I-deficient DCs. Therefore, the following question was whetherex vivoDCs from mice deficient in one of these two sialyltransferases presented a more mature phenotype. To address this ques-tion we analysed the expression of MHC II and CD86 in DCs present in their blood, lymph nodes and spleens.
The MHC II expression was higher in ST6Gal.I)/) DCs
when compared with WT mice, but no apparent differ-ences were observed regarding CD86 expression (Table 1). ST3Gal.I-deficient mice presented insignificant variation of the MHC II and CD86 expression (Table 1).
To determine whether the increased expression of MHC II in ST6Gal.I)/)DCs could be linked to one particular DC
subset, we focused our analysis on the lymphoid, plasmacy-toid and conventional DC subsets, based on the DC expres-sion of CD8a, B220 and CD11b markers, respectively (Table 1). When examining each of these subsets for the expression of MHC II and CD86, we noted that the increased MHC II expression, detected in the total ST6Gal.I)/) DCs, was mainly present in the plamacytoid
(B220+) DC subset (Table 1). These results suggest that the more mature phenotype found in DCs from ST6Gal.I)/)
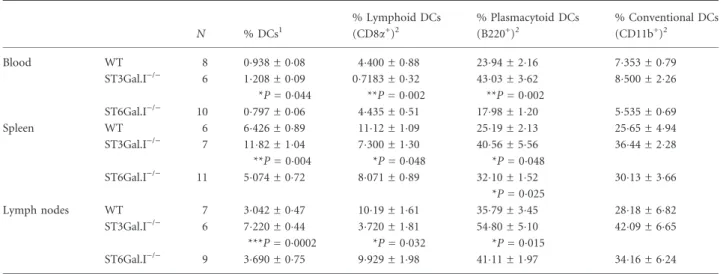
mice, was mainly related to the plasmacytoid DC subset. Surprisingly, when we studied the distribution of lym-phoid, plasmacytoid and conventional DC subsets, we found differences in the ST3Gal.I-deficient mice, which presented not only an increased percentage of total DCs, but also a significant inferior percentage of CD8a+ DCs and, conversely, increased number of B220+ DCs in the three analysed sources (Table 2). The surface expression of each subset marker was also evaluated based on the overall intensity values, but no significant differences were found (data not shown).
ST3Gal.I)/)and ST6Gal.I)/)BMDCs present lower endocytosis capacity and increased cell surface expression of MHC II
Since we demonstrated that at least ex vivo ST6Gal.I)/)
DCs presented increased expression of MHC II, we then asked whether ST6Gal.I)/) or ST3Gal.I)/) DCs had
impaired endocytic capacity. To answer this, we chose DCs differentiated in vitro from bone marrow, because the in vitrogeneration of DCs from their precursors pro-duces a percentage of DCs much higher than those obtained by isolation fromex vivosources.
We performed FITC-conjugated ovalbumin endocytosis assays with ST3Gal.I)/) and ST6Gal.I)/) BMDCs. For
comparison similar assays with WT BMDCs were always run in parallel. The percentage of BMDCs that endocyto-sed ovalbumin was roughly identical to that of WT
*
0
MT DC(TT) T DC(TT) MT DC T DC – PHA
25 50 75
Proliferating T lymphocytes (%)
Figure 3. Increased T-lymphocyte proliferation in mixed leucocyte
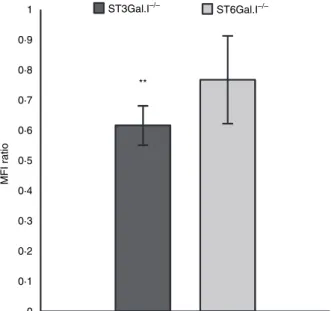
BMDCs (± 62%). However, the fluorescence intensity of FITC-labelled ovalbumin was reduced in BMDCs from ST3Gal.I)/)and ST6Gal.I)/)mice [61% (P= 0
0078) and
76% of fluorescence intensity relative to WT, respectively] (Fig. 4). These observations demonstrate that ST3Gal.I)/)
and, to a lesser extent, ST6Gal.I)/) BMDCs endocytose
less ovalbumin than WT BMDCs.
We also monitored the expression of MHC II in ST3Gal.I)/) and ST6Gal.I)/) BMDCs after undergoing
endocytosis. As expected from the ex vivo DC analysis, ST6Gal.I)/)
BMDCs showed a higher expression of MHC
II than WT (Fig. 5). Unexpectedly, ST3Gal.I)/) BMDCs
showed a significant and even higher expression of MHC II (Fig. 5). To investigate whether the increased MHC II expression was exclusively derived from the endocytosis or if it was present, originally, in the ST6Gal.I)/) and
ST3Gal.I)/) BMDCs, we have analysed the MHC II
expression in the control BMDCs which had not under-gone endocytosis. Although not statistically significant, the intensity of MHC II fluorescence was also higher in both control ST6Gal.I)/) and ST3Gal.I)/) BMDCs than
control WT BMDCs (Fig. 5).
Table 1.Expression of major
histocompatibil-ity complex class II and CD86 in ST3Gal.I)/) and ST6Gal.I)/) mouse dendritic cells compared with wild-type control
N MHC II1 MHC II (B220+)2 CD861
Blood WT 8 1570 ± 407 1173 ± 206 2278 ± 055
ST3Gal.I)/) 6 236
0 ± 595 1660 ± 602 2019 ± 179 ST6Gal.I)/) 10 280
4 ± 379 *P= 0046
2722 ± 269 ***P= 00005
2655 ± 201
Spleen WT 6 5759 ± 614 7848 ± 940 6655 ± 537 ST3Gal.I)/) 7 554
0 ± 1405 6542 ± 925 6565 ± 523 ST6Gal.I)/) 11 903
1 ± 910 **P= 0009
1047 ± 938 6275 ± 728
Lymph nodes WT 7 9756 ± 1058 8643 ± 153 2094 ± 476 ST3Gal.I)/) 6 1465 ± 366
8 1197 ± 171 1980 ± 144 ST6Gal.I)/) 9 1498 ± 74
5
**P= 0007
1810 ± 177 **P= 0003
2450 ± 445
DCs, dendritic cells; MHC II, major histocompatibility complex class II; WT, wild-type. DCs were considered CD11c and MHC II positive cells.
Nindicates the number of mice used for each determination. Values are the mean ± SEM of mean fluorescence intensity (MFI).
1Values are related to total DCs.
2Values related to plasmacytoid (B220+) DCs.
Table 2.Distribution of dendritic cell subsets in ST3Gal.I)/)and ST6Gal.I)/)mice compared with wild-type control mice
N % DCs1
% Lymphoid DCs (CD8a+)2
% Plasmacytoid DCs (B220+)2
% Conventional DCs (CD11b+)2
Blood WT 8 0938 ± 008 4400 ± 088 2394 ± 216 7353 ± 079
ST3Gal.I)/) 6 1
208 ± 009 *P= 0044
07183 ± 032 **P= 0002
4303 ± 362 **P= 0002
8500 ± 226
ST6Gal.I)/) 10 0
797 ± 006 4435 ± 051 1798 ± 120 5535 ± 069
Spleen WT 6 6426 ± 089 1112 ± 109 2519 ± 213 2565 ± 494
ST3Gal.I)/) 7 11 82 ± 104 **P= 0004
7300 ± 130 *P= 0048
4056 ± 556 *P= 0048
3644 ± 228
ST6Gal.I)/) 11 5
074 ± 072 8071 ± 089 3210 ± 152 *P= 0025
3013 ± 366
Lymph nodes WT 7 3042 ± 047 1019 ± 161 3579 ± 345 2818 ± 682
ST3Gal.I)/) 6 7
220 ± 044 ***P= 00002
3720 ± 181 *P= 0032
5480 ± 510 *P= 0015
4209 ± 665
ST6Gal.I)/) 9 3
690 ± 075 9929 ± 198 4111 ± 197 3416 ± 624
DCs, dendritic cells; MHC II, major histocompatibility complex class II; WT, wild-type. DCs were considered CD11c and MHC II positive cells.
Nindicates the number of mice used for each determination.
Considering the strikingly elevated MHC II expression following endocytosis, we decided to examine this parame-ter in detail. In particular, we wished to address whether the increased intensity of MHC II was applied to all the BMDCs or to a particular subpopulation. After endocyto-sis, either WT, ST3Gal.I)/) or ST6Gal.I)/) BMDCs
pre-sented two distinguishable BMDC subpopulations based on the mean fluorescence intensity of MHC II (MHC IImedium and MHC IIhigh) (Fig. 5). When gating both subpopulations and comparing the intensity of MHC II fluorescence, the MHC IImediumsubpopulation was approx-imately identical, in the three analysed BMDCs. However, the MHC IIhigh population of both ST6Gal.I)/) and
ST3Gal.I)/)BMDCs presented a slightly increased intensity
of MHC II fluorescence (Fig. 5). The percentage of MHC IIhighBMDCs compared to the MHC IImedium subpopula-tion was about 10% and 5% higher in ST6Gal.I)/) and
ST3Gal.I)/)
BMDCs, than in WT BMDCs, respectively, but
0 0·1 0·2 0·3 0·4 0·5 0·6 0·7 0·8 0·9 1
MFI ratio
ST3Gal.I–/–
ST6Gal.I–/–
**
Figure 4. Decreased endocytic ability of ST3Gal.I)/)and ST6Gal.I)/)
bone marrow-derived dendritic cells (BMDCs). The ST3Gal.I)/)or ST6Gal.I)/) BMDCs were incubated, for 30 min, with 0
05 mg/ml fluorescein isothiocyanate-conjugated ovalbumin, as described in the Materials and methods. Control assays were performed in parallel with wild-type (WT) BMDCs. The mean fluorescence intensity (MFI) values obtained at 4 were subtracted from the 37values. The results are expressed as the ratio of the MFI ± SEM of ST3Gal.I)/)BMDCs (six mice) or ST6Gal.I)/)BMDCs (seven mice) related to WT BMDC. Significantly different values were observed for the endocytic capacity of ST3Gal.I)/)BMDC (**P< 0
01).
ST SG WT WT ST SG WT WT
0 200 400 600 800 1000 1200 1400 1600 1800 2000
MFI
37° 4° *
0·0 50·0 100·0 150·0 200·0 250·0 300·0 350·0
ST
MHC IImedium
MFI
0·0 1000·0 2000·0 3000·0 4000·0
SG WT ST WT
MHC IIhigh
MFI
MHC IIhigh
MHC IImedium
101 102 103 104 100
I-Ab
SSC
0 256 512 768 1024
SG WT WT
(c) (b) (a)
Figure 5. Major histocompatibility complex (MHC) expression is
increased in ST3Gal.I)/)and ST6Gal.I)/)bone marrow-derived den-dritic cells (BMDCs). The MHC II expression of ST3Gal.I)/) (ST) and ST6Gal.I)/)(SG) BMDCs was analysed by staining with phycoer-ythrin-conjugated anti I-Ab, after exposure to fluorescein isothiocya-nate-conjugated ovalbumin and incubation at 37or 4, as described in the Materials and methods.Control assays were performed in par-allel with wild-type (WT) BMDCs. (a) The results are expressed as the mean fluorescence intensity (MFI) ± SEM of ST3Gal.I)/)BMDCs (six mice) and ST6Gal.I)/)BMDCs (seven mice). Significantly differ-ent values, related to WT BMDC, were observed at 37, for the ST3Gal.I)/) BMDCs (*P< 0
05). (b) Dot-plot showing that, after endocytosis (at 37), BMDCs express different levels of MHC II, defining a MHC IImediumand a MHC IIhighsubpopulation. The data shown correspond to analysis of one representative population of BMDCs (either from WT, ST3Gal.I)/)or ST6Gal.I)/)mice) acquired by flow cytometry. (c) MHC IImediumsubpopulations of ST3Gal.I)/) and ST6Gal.I)/)BMDCs are no different from WT BMDCs, while MHC IIhigh subpopulations showed increased MHC II expression. The results are the means ± SEM of the MFI for MHC II for the MHC IImedium and MHC IIhigh subpopulations, gated as described above. The left axis corresponds to the MHC IImediumsubpopulation
the differences were not statistically significant (data not shown). Accordingly, the fluorescence intensity of FITC-labelled ovalbumin of the MHC IImedium subpopulation was approximately identical, in the three analysed BMDCs, whereas the MHC IIhigh population of both ST3Gal.I)/)
and ST6Gal.I)/) BMDCs presented a decreased intensity
[49% (P= 00094) and 78% of fluorescence intensity
rela-tive to WT, respecrela-tively] (data not shown).
Collectively, these data indicate that BMDCs deficient for ST6Gal.I or ST3Gal.I, upon endocytosis, show an aug-mented number of fully mature BMDCs subpopulation with decreased endocytosis capacity.
Discussion
With the recent progress of glycobiology it is becoming evi-dent that sialic acid is relevant to the immune responses and the evaluation of sialylation-modification at the leuco-cyte surface contributes to a better understanding of the immune functions. We have previously demonstrated that the expression of surface sialylated structures was modu-lated during moDC differentiation and maturation, and we suggested that changes in sialylation are related to specific DC functions.19Nevertheless, because of the characteristic complexity of DCs, the identification of the specific nature and role of these structures is still difficult to predict.
Here, we show that the sialylation shortage, generated by neuraminidase treatment, induces an increased expression of MHC molecules and costimulatory molecules at the cell surface of human moDCs. This increase is considerably higher than that induced solely by the uptake of ovalbumin (Fig. 1) or other endocytic agents, such as lucifer yellow and dextran (data not shown). Additionally, according to our experiments investigating the functional consequences of sialic acid loss in DCs, neuraminidase treatment alters the gene expression of specific cytokines and increases the ability of DCs to prime T lymphocytes. Notably, sialic acid shortage leads to an up-regulation of IL-1a, IL-6 and
TNF-a proinflammatory cytokines,28,29 and of IL-12, which drives Th1 lymphocyte differentiation and the cell-
medi-ated immune response.30In contrast, the expression of IL-10, which plays a major role inducing tolerance in naı¨ve T lymphocytes31 and in biasing their development into Th2 lymphocytes,32 remained basically unchanged. Increased expression of signals, such as antigen presentation and co-stimulatory molecules and IL-12, driving the development of naive precursors into Th1 lymphocytes33 are key deter-minants for DC immunogenicity. To evaluate the cytokine profile, the expression of mRNA, but not of protein, was analysed and it is relevant to note that a discrepancy between mRNA and protein expression is possible. Not-withstanding, our strategy is well suited to elucidate the Th1- or Th2-skewed DC activation profile. Our results suggest that neuraminidase creates an overall proinflam-matory effect on moDCs, increasing their immunogenicity.
The idea of using neuraminidase treatment to alter DC immunogenicity, that is to say the activation towards Th1, needs further clarification. Neuraminidase treatment removes non-specificallya-2,3-linked anda-2,6-linked sia-lic acid from all cell surface sialylated constituents. Our current data cannot predict the precise sialylated cell sur-face structure that, upon desialylation, leads to Th1-skewed DC activation. To obtain a better insight, we studied DCs that were deficient for ST3Gal.I and ST6Gal.I, because these two sialyltransferases have a good correlation between their mRNA expression levels and the differentiation and maturation process of human DCs and are probably the most relevant for moDCs sialylation.19Absence of the sialic acid linkages specified by these sialyltransferases may both lead to Th1-skewed DC activation. In addition, the data derived from these mouse models with ST6Gal.I or ST3Gal.I deficiencies suggest that the overall extent of cell surface sialylation, and not of specific sialylated glycopro-tein entities, may be the important contributing factor. On the other hand, it is important to note that differences in DC maturation and distribution were noted between ST6Gal.I-deficient compared to ST3Gal.I-deficient and WT animals (see Table 2). These differences may indicate func-tional specializations for sialic acid linkages specified by the two sialyltransferases, which, in their turn, may be depen-dent on the presence of several cell surface molecules. Indeed, human moDCs express several receptors, such as Siglecs, that recognize sialic-acid-containing glycans, and may have preferences for either the Sia(a2,3) linked to Gal(b1,3)GalNAc or the Sia(a2,6) to Gal(b1,4)GlcNAc structures synthesized by ST3Gal.I or ST6Gal.I, respec-tively.34 Siglecs have the potential to interact not only
in transwith sialylated ligands found in other cells, but also
in cis with ligands found at the same cell surface.34 The physiological functions of the majority of Siglecs are still unknown. However, because they present immunoreceptor tyrosine-based inhibitory motifs, they are expected to have a major role in controlling immunity. Furthermore, addi-tional glycan-recognizing receptors exist, and removal of the sialic acid residues normally residing as the outermost residue of glycans may uncover ligands for other immuno-logically relevant carbohydrate-binding molecules such as galectins. Some members of this family of lectins that rec-ognize b-galactosyl-containing glycoconjugates, have been implicated in both innate and adaptive immune responses.35 So far it is known that Gal-3 expression in DCs is pivotal to control the magnitude of T-lymphocyte priming36 but the biological functions of the galectins expressed by DCs are probably complex and are not well understood. In this scenario, it is difficult to anticipate the extent of molecules and mechanisms that are engaged when DCs are treated with neuraminidase.
used throughout this study, was of bacterial origin and could be contaminated with microbial products, particu-larly endotoxins. Nevertheless, to rule out that possibility, control assays were performed with a neuraminidase inacti-vated by heat which should not destroy the endotoxins.
Considering the fact that differential sialylation can influence the accessibility of MHC epitopes to antibodies that recognize them,17,37 it would be possible that the increased antibody binding to MHC molecules that is observed in neuraminidase-treated DCs, was the result of an enhanced antibody affinity rather than of augmenta-tion of the number of binding sites of such molecules. However, it should be noted that the increased immuno-genicity of neuraminidase-treated DCs is confirmed not only by the increased binding of MHC antibodies, as shown by flow cytometry, but also by the transcription of specific cytokines and by proliferation assays in mixed lymphocyte cultures. In addition, qualitative differences in the extent of antibody binding to MHC II molecules were also observed among ST6Gal.I)/) and ST3Gal.I)/) DC
subsets, corroborating the idea that clearance of cell sur-face sialic acids is indeed involved in an elevated expres-sion of MHC II at the cell surface.
There is evidence correlating reduced sialylated struc-tures with the activation of other leucocytes such as neu-trophils and T lymphocytes.38,39In the case of DCs, there is one report describing how murine DCs treated with neuraminidase induced specific T-lymphocyte responses more efficiently.17 Interestingly, some sialyltransferases, like ST6Gal.I, are known to be down-regulated after DC maturation,18,19 suggesting that maturation, on its own, leads to the reduction of specific sialylation.
Lymphocytes and neutrophils, from ST3Gal.I)/)
and ST6Gal.I)/)
mice have been the object of several stud-ies,6,7,40 but, as far as we know this is the first reported
characterization of their DCs. Therefore we initially stud-ied the distribution of lymphoid, plasmacytoid and con-ventional DC subsets in blood, lymph nodes and spleen, based on the expression of specific markers. We have found that ST3Gal.I-deficient mice presented a signifi-cantly lower percentage of CD8a+ DCs and, conversely, increased number of B220+ DCs in the periphery (Table. 1). It is relevant to note that ST3Gal.I)/)
lympho-cytes have been described as having a similar CD8/B220 disproportion and the dramatic defect for CD8+ T lym-phocytes in ST3Gal.I)/)mice has been relatively well
doc-umented.6 The observed alteration in the DC population, suggests a higher content of plasmacytoid (B220+) DCs and may be related to the fact that both CD8 and B220 molecules are the substrate of ST3Gal.I.6However, further
analysis is required to validate the relationship of ST3Gal.I expression and plasmacytoid DC abundance.
Our findings strongly suggest that sialic acid linkages mediated by different sialyltransferases are functionally distinct in DCs and have roles in DC maturation. Sialic
acid deficiency, either in ST3Gal.I)/) and ST6Gal.I)/)
BMDCs or in human neuraminidase treated moDCs, trig-gers DC maturation. In contrast to classical maturation stimuli,10desialylation-triggered maturation does not dra-matically abrogate endocytosis, and human or mouse DCs with reduced sialic acid retain around 70% of their endocytic capacity. In addition, the MHC II expression of desialylated DCs is intensified upon antigen loading, which accords with the increased capacity to induce T-lymphocyte proliferation.
Further functional studies are still required to under-stand the competence and immune modulatory capacities of desialylated DCs. Nevertheless, because surface sialyla-tion influences the immunogenicity of DCs upon antigen loading, our findings should have a particular relevance to DC-based therapies and they propose that sialylation is an issue to be considered when refining the immunologi-cal parameters of vaccination with DCs.
Acknowledgements
We thank Manuela Correia for her exceptional technical assistance and Joana Ribeiro and David Lopes for their assistance in obtaining sorted moDC and murine DC subsets, respectively. The studies were supported by the Immunology Department, FCM-UNL, by the Fundac¸a˜o para a Cieˆncia e Tecnologia, Portugal (SFRH/BPD/21619/ 2005) to M.G.C. and by the National Institutes of Health (AI-056082) to J.T.Y.L.
Conflict of interest
There are no financial or commercial conflicts of interest with this work.
Disclosure
The authors have no financial conflict of interest.
References
1 Harduin-Lepers A, Vallejo-Ruiz V, Krzewinski-Recchi MA, Sam-yn-Petit B, Julien S, Delannoy P. The human sialyltransferase family.Biochimie2001;83:727–37.
2 Varki NM, Varki A. Diversity in cell surface sialic acid presenta-tions: implications for biology and disease. Lab Invest 2007;
87:851–7.
3 Crocker PR, Paulson JC, Varki A. Siglecs and their roles in the immune system.Nat Rev Immunol2007;7:255–66.
4 Sperandio M. Selectins and glycosyltransferases in leukocyte roll-ingin vivo.FEBS J2006;273:4377–89.
5 Varki A. Sialic acids as ligands in recognition phenomena. FASEB J1997;11:248–55.
7 Hennet T, Chui D, Paulson JC, Marth JD. Immune regulation by the ST6Gal sialyltransferase. Proc Natl Acad Sci USA 1998;
95:4504–9.
8 Banchereau J, Palucka AK. Dendritic cells as therapeutic vaccines against cancer.Nat Rev Immunol2005;5:296–306.
9 Banchereau J, Steinman RM. Dendritic cells and the control of immunity.Nature1998;392:245–52.
10 Sallusto F, Cella M, Danieli C, Lanzavecchia A. Dendritic cells use macropinocytosis and the mannose receptor to concentrate macromolecules in the major histocompatibility complex class II compartment: downregulation by cytokines and bacterial prod-ucts.J Exp Med1995;182:389–400.
11 Inaba K, Turley S, Iyoda Tet al.The formation of immunogenic major histocompatibility complex class II-peptide ligands in lysosomal compartments of dendritic cells is regulated by inflammatory stimuli.J Exp Med2000;191:927–36.
12 Moser M, Murphy KM. Dendritic cell regulation of TH1-TH2 development.Nat Immunol2000;1:199–205.
13 Kalinski P, Hilkens CM, Wierenga EA, Kapsenberg ML. T-cell priming by type-1 and type-2 polarized dendritic cells: the con-cept of a third signal.Immunol Today1999;20:561–7.
14 Figdor CG, de Vries IJ, Lesterhuis WJ, Melief CJ. Dendritic cell immunotherapy: mapping the way.Nat Med2004;10:475–80. 15 Hawiger D, Inaba K, Dorsett Y et al. Dendritic cells induce
peripheral T cell unresponsiveness under steady state conditions in vivo.J Exp Med2001;194:769–79.
16 Finkelman FD, Lees A, Birnbaum R, Gause WC, Morris SC. Dendritic cells can present antigen in vivo in a tolerogenic or immunogenic fashion.J Immunol1996;157:1406–14.
17 Boog CJ, Neefjes JJ, Boes J, Ploegh HL, Melief CJ. Specific immune responses restored by alteration in carbohydrate chains of surface molecules on antigen-presenting cells.Eur J Immunol 1989;19:537–42.
18 Jenner J, Kerst G, Handgretinger R, Muller I. Increased alpha2,6-sialylation of surface proteins on tolerogenic, immature dendritic cells and regulatory T cells.Exp Hematol2006;34:1212–8. 19 Videira PA, Amado IF, Crespo HJ, Alguero MC, Dall’Olio F,
Cabral MG, Trindade H. Surface alpha 2-3- and alpha 2-6-sialy-lation of human monocytes and derived dendritic cells and its influence on endocytosis.Glycoconj J2008;25:259–68.
20 Verkade MA, van Druningen CJ, Op de Hoek CT, Weimar W, Betjes MG. Decreased antigen-specific T-cell proliferation by moDC among hepatitis B vaccine non-responders on haemo-dialysis.Clin Exp Med2007;7:65–71.
21 Bajana S, Herrera-Gonzalez N, Narvaez J, Torres-Aguilar H, Rivas-Carvalho A, Aguilar SR, Sanchez-Torres C. Differential CD4(+) T-cell memory responses induced by two subsets of human monocyte-derived dendritic cells. Immunology 2007;
122:381–93.
22 Livak KJ, Schmittgen TD. Analysis of relative gene expression data using real-time quantitative PCR and the 2(–DDC(T)) method.Methods2001;25:402–8.
23 Lutz MB, Kukutsch N, Ogilvie AL, Rossner S, Koch F, Romani N, Schuler G. An advanced culture method for generating large quantities of highly pure dendritic cells from mouse bone mar-row.J Immunol Methods1999;223:77–92.
24 Porcelli SA, Segelke BW, Sugita M, Wilson IA, Brenner MB. The CD1 family of lipid antigen-presenting molecules. Immunol Today1998;19:362–8.
25 van der Wel NN, Sugita M, Fluitsma DM, Cao X, Schreibelt G, Brenner MB, Peters PJ. CD1 and major histocompatibility com-plex II molecules follow a different course during dendritic cell maturation.Mol Biol Cell2003;14:3378–88.
26 Martino A, Volpe E, Auricchio G, Colizzi V, Baldini PM. Influ-ence of pertussis toxin on CD1a isoform expression in human dendritic cells.J Clin Immunol2006;26:153–9.
27 Rigano R, Buttari B, Profumo E et al. Echinococcus granulosus antigen B impairs human dendritic cell differentiation and polarizes immature dendritic cell maturation towards a Th2 cell response.Infect Immun2007;75:1667–78.
28 Dinarello CA. Interleukin-1. Cytokine Growth Factor Rev1997;
8:253–65.
29 Kopf M, Baumann H, Freer G et al. Impaired immune and acute-phase responses in interleukin-6-deficient mice. Nature 1994;368:339–42.
30 Gately MK, Renzetti LM, Magram J, Stern AS, Adorini L, Gubler U, Presky DH. The interleukin-12/interleukin-12-receptor sys-tem: role in normal and pathologic immune responses. Annu Rev Immunol1998;16:495–521.
31 Enk AH, Angeloni VL, Udey MC, Katz SI. Inhibition of lan-gerhans cell antigen-presenting function by IL-10. A role for IL-10 in induction of tolerance. J Immunol 1993;
151:2390–8.
32 Liu L, Rich BE, Inobe J, Chen W, Weiner HL. Induction of Th2 cell differentiation in the primary immune response: dendritic cells isolated from adherent cell culture treated with IL-10 prime naive CD4+ T cells to secrete IL-4.Int Immunol1998;10:1017–
26.
33 Trinchieri G. Interleukin-12: a proinflammatory cytokine with immunoregulatory functions that bridge innate resistance and antigen-specific adaptive immunity. Annu Rev Immunol 1995;
13:251–76.
34 Varki A, Angata T. Siglecs – the major subfamily of I-type lectins.Glycobiology2006;16:1R–27R.
35 Stowell SR, Qian Y, Karmakar S, Koyama NS, Dias-Baruffi M, Leffler H, McEver RP, Cummings RD. Differential roles of galec-tin-1 and galectin-3 in regulating leukocyte viability and cyto-kine secretion.J Immunol2008;180:3091–102.
36 Breuilh L, Vanhoutte F, Fontaine J et al.Galectin-3 modulates immune and inflammatory responses during helminthic infec-tion: impact of galectin-3 deficiency on the functions of den-dritic cells.Infect Immun2007;75:5148–57.
37 Liberti PA, Hackett CJ, Askonas BA. Influenza virus infection of mouse lymphoblasts alters the binding affinity of H-2 anti-body: requirement for viral neuraminidase.Eur J Immunol1979;
9:751–7.
38 Razi N, Varki A. Cryptic sialic acid binding lectins on human blood leukocytes can be unmasked by sialidase treatment or cellular activation.Glycobiology1999;9:1225–34.
39 Sadighi Akha AA, Berger SB, Miller RA. Enhancement of CD8 T-cell function through modifying surface glycoproteins in young and old mice.Immunology2006;119:187–94.