1192
METABOLIC NETWORKS AND BIOENERGETICS OF AURANTIOCHYTRIUM SP. B-072 DURING STORAGE
LIPID FORMATION
Montri Chaisawang*, Cornelis Verduyn, Somchai Chauvatcharin, Manop Suphantharika
Department of Biotechnology, Faculty of Science, Mahidol University, Bangkok 10400, Thailand.
Submitted: April 06, 2011; Approved: January 16, 2012.
ABSTRACT
Baffled shake flask cultivation of Aurantiochytrium sp.B-072 was carried out at in a glucose-monosodium glutamate mineral medium at different C/N-ratios (30-165) with glucose fixed at 90 g/L. With increasing
C/N-ratio, a modest increase in lipid content (60 to 73 % w/w) was observed whereas fat-free biomass
decreased but overall biomass showed little variation. FA-profiles were not affected to a large extent by
C/N-ratio and absolute docosahexaenoic (DHA)-levels fell in narrow range (5-6 g/L). However at C/N > 64
a rapid decrease in lipid synthetic rate and/or incomplete glucose utilization occurred. Glucose and
FA-fluxes based on fat-free biomass peaked at a C/N ratio of 56. This condition was chosen for calculation of
the redox balance (NAD(P)H) and energy (ATP) requirement and to estimate the in vivo P/O ratio during the main period of fatty acid biosynthesis. Several models with different routes for NADPH, acetyl-CoA
formation and re-oxidation of OAA formed via ATP-citrate lyase were considered as these influence the
redox- and energy balance. As an example, using a commonly shown scheme whereby NADPH is supplied
by a cytosolic “transhydrogenase cycle” (pyruvate-OAA-malate-pyruvate) and OAA formed by ATP-citrate
lyase is recycled via import into the mitochondria as malate, the calculated NADPH-requirement amounted
to 5.5 with an ATP-demand of 10.5 mmol/(g fat-free biomass x h) and an in vivo P/O-ratio (not including non-growth associated maintenance) of 1.6. The lowest ATP requirement is found when acetyl-CoA would
be transported directly from the mitochondria to the cytosol by carnitine acetyltransferase. Assay of some
enzymes critical for NADPH supply indicates that activity of glucose-6-phosphate dehydrogenase, the first
enzyme in the HMP pathway, is far insufficient for the required NADPH-flux and malic enzyme must be a
major source. Activity of the latter (ca. 300 mU/mg protein) far exceeds that in oleaginous fungi and yeast.
Key words: Aurantiochytrium, C/N-ratio, Docosahexaenoic acid, Fatty acid flux, P/O ratio
INTRODUCTION
Docosahexaenoic acid (DHA, 22:6 n-3) is required for
maintenance of normal brain function and photoreceptor
function in humans (11, 21). DHA is largely derived from fish
oils, but declining fish stocks, environmental pollution and
season-dependent compositional variation in fatty acid (FA)
composition have led to a search for alternative sources, such
as various marine microbes.
Various auto- and heterotrophic microbes produce DHA
1193
and other polyunsaturated fatty acids (PUFAs), but
commercially bulk production of DHA-rich oil or biomass has
focused on heterotrophic cultivation of the dinoflagellate
Crypthecodinium cohnii and the non-related thraustochytrids which include the genus Aurantiochytrium (29). Physiological knowledge of these organisms remains limited however, but
one unusual characteristic of the thraustochytrids and possibly
C. cohnii is the possession of a polyketide system (PKS) for synthesis of PUFAs. In this system, introduction of double
bonds occurs by isomerization/dehydration rather than by
oxygen-dependent desaturases (20).
Surprisingly, especially in view of current interest in
specialty FAs as well as biodiesel derived from microbial
lipids, flux analysis of lipid metabolism has been largely
ignored. As basically no growth occurs in the main lipogenic
(N-limited phase), in silico flux analysis can be significantly simplified as carbon is only consumed in lipid formation as
well as ATP generation (dissimilation) for the latter process as
well as maintenance. Hence by assaying the concentrations of
glucose as well as cellular FAs in time, sufficient formation is
obtained to calculate the redox- and energy balance.
The aim of this work was firstly to study the effect of
C/N-ratio in a mineral medium by varying nitrogen levels at a
fixed concentration of glucose on the specific flux of glucose
and fatty acids. Secondly, for one cultivation condition the
redox balance and bioenergetics formation during lipogenesis
were calculated for various metabolic networks. Assay of a
limited number of enzymes was used to confirm the feasibility
of the various networks. Finally the results are discussed in
view of more efficient DHA production, both in terms of
absolute DHA-level as well as productivity.
MATERIALS AND METHODS
Strain and maintenance
Aurantiochytrium sp. B-072 was kindly supplied by dr. Somtawin Jaritkhuan, Burapha University, Thailand. The strain
was preserved in 20% (v/v) glycerol at –80 ºC and maintained
by monthly subculture on YPG agar. The YPG agar contained
(g/L): artificial sea salts, 15; glucose, 1; yeast extract, 1;
peptone, 1; MnCl2, 1; and agar, 15.
Identification of strain
The strain of Aurantiochytrium sp. B-072 was cultured for 3 days in an agar plate. A single colony that grown on an agar
plate was inoculated to a 50 mL tube with 10 mL of liquid
medium prepared with artificial seawater containing 4 g/L
glucose, 2 g/L yeast extract and 1 g/L peptone. The cell was
grown in the medium at 25 ˚C for 4 days with continuous
shaking (150 rpm). The cells were collected by centrifugation
(9,000×g, 10 min), washed twice with equal volume of sterile deionized water and dried by lyophilizer before DNA
extraction and sequencing.
Dried biomass was ground with glass beads by vortexing.
Total genomic DNA of cells was extracted by using DNeasy
Plant Mini Kit purchased from Qiagen (Germantown, MD,
USA) according to the manufacturer’s guideline. The resulting
of extracted DNA was determined the quality before amplify
by using agarose gel electrophoresis (0.8% agarose).
According to Chodchoey et al. (6), Grzebyk et al. (12) and Yang et al. (32), two primers, forward primer: 5′ -TCCTGCCAGTAGTCATATGC-3′ and reverse primer: 5′
-TGATCCTCTCGCAGGTTCAC-3′ were used to amplify 18S
rRNA gene in the genomic DNA. A genomic DNA template of
100 ng was mixed with the polymerase chain reaction (PCR)
mixture containing 50 μL of 1× Taq PCR buffer (New England Biolabs, UK), 0.2 mM dNTP, 0.2 μM of 16S1N, and 16S2N
primers respectively, and 2.5 U Taq polymerase (New England
Biolabs, UK) and denatured at 94°C for 5 min. The PCR
program was run for 30 s at 94°C, 30 s at 60.8°C (annealing
temperature), 2 min at 72°C for 40 cycles, and 7 min for final
extension at 72°C. Then the PCR product was sent for DNA
sequencing. The resulting 18S rRNA gene sequences were
1194
microorganisms in GenBank database of the National Center
for Biotechnology Information by using Basic Local
Alignment Search Tool (BLAST). The neighbor-jointing (NJ)
tree was constructed by the multiple alignment program
CLUSTAL W using MEGA5 software (23). The values of
bootstrap were analyzed from 1,000 replications (32).
Shake-flask cultivation to study effect of C/N-ratio
Preparation of a standardized inoculum was as described
by Unagul et al. (25). A 5% v/v inoculum (adjusted to OD660 of 2.0) was transferred to 500 mL baffled flasks (Bellco, USA)
containing 100 mL of the test media and shaken at 25˚C and
200 rpm until glucose was exhausted. Mineral medium
consisted of glucose (fixed at 90 g/L unless otherwise noted);
monosodium glutamate monohydrate (MSG) 3, 6, 8, 9, 12, 15
and 18 g/L; KH2PO4, 0.6 g/L; artificial sea salts (Sigma, USA,
refer to manufacturers product sheet for detailed composition),
15 g/L; trace elements and vitamins (28), both 1 mL/L. The
media were sterilized at 120˚C for 15 min in 80% of the final
volume, followed by addition of glucose (sterilized at 110˚C as
a stock solution of 50% w/v) and vitamins (sterilized by 0.2
micron filter). They were then made up to the final volume
(100 mL) with sterilized distilled water. Experiments were
performed in duplicate.
Analysis of culture supernatant
Glucose was assayed with a commercial enzymatic kit
(Glucose liquicolor, Human, Germany). Glutamate was
assayed via an amino nitrogen assay by the TNBS
(trinitrobenzo sulfonic acid) procedure (1).
Assay of biomass dry weight
The culture samples (2 mL) were harvested by
centrifugation (9,000×g, 10 min, 4 ˚C), and biomass was washed twice with distilled water. After freeze-drying the
pellet was placed in a desiccator before gravimetrical
determination.
Analysis of fatty acids
Briefly, 15-20 mg of freeze-dried biomass was accurately
weighed and esterified by 4% sulphuric acid in methanol and
antioxidant, butylated hydroxytoluene for 1 h. at 90 ˚C.
Heptadecanoic acid (Sigma, St. Louis, USA) was used as
internal standard. Samples were subjected to gas
chromatography on a GC-17A instrument (Shimadzu, Japan)
equipped with a Supelco OmegawaxTM 250 fused silica
capillary column. The procedure and instrumentation has been
described in detail by Unagul et al. (25).
Preparation of cell-free extract (cfe) and enzyme assays Biomass (ca. 300 mg dry weight) was harvested at the late
lipogenic phase, washed once with distilled water and
extraction buffer (0.1 M Tris-HCl pH 7.2, 10% w/v glycerol, 1
mM dithiothreitol and 1 mM EDTA) and then suspended in 4
mL ice-cold extraction buffer in a glass tube containing 1g of
glass beads (diameter 0.6 mM) and sonicated in 4 x 2.5 min
intervals with intermediate cooling on ice. The cell
homogenate was then centrifuged at 50,000 x g for 10 min at 4˚C. The clear supernatant was collected, kept on ice and used
immediately for enzyme assays as detailed below.
Enzyme assays were performed with a Jasco B-530
spectrophotometer at 25˚C. All assays were carried out with
two different amounts of cfe and corrected for endogenous
activity.
ATP:citrate lyase (ACL) was assayed according to Srere
(22). Carnitine acetyltransferase (CAT) was assayed according
to Kohlhaw and Tan-Wilson (18). Glucose-6-P-dehydrogenase
(G-6-P-DH) and 6-P-gluconate dehydrogenase were assayed
according to Harris et al. (15) and Bruinenberg et al. (3), respectively. Isocitrate dehydrogenase was assayed according
to Harris et al. (15). Malic enzyme was also assayed according to Harris et al. (15) but malate concentration was decreased from 100 to 25 mM as a concentration of 100 mM resulted in
severe substrate inhibition (data not shown). Protein content of
1195
standard. Enzyme activity was then expressed as nmol
substrate/product converted per min per mg protein (or mU/mg
protein) using a molar absorption coefficient (340 nm) of 6.22
mM-1.cm-1 for NAD(P)H.
The measured specific activity of enzymes was converted
into maximal cellular fluxes assuming the enzymes operate at
Vmaxin vivo according to Postma et al. (19).
Definitions and calculations
As MSG contains a significant amount of carbon,
C/N-ratio was calculated from (Cglucose + CMSG)/NMSG , or in g/L:
([glucose] x 0.4 + [MSG] x 0.32) / [MSG] x 0.074. Fat-free
biomass (FFB, g/L) was calculated by subtracting total fatty
acid content (g/L) from biomass (g/L). Flux is the formation or
consumption rate of a metabolite/product along a metabolic
pathway or transport of a substrate across a membrane and is
expressed in mmol of component per gram of FFB per hour. It
is obtained from the plotting the concentration of the
component of interest vs time followed by linear regression
after conversion into mmoles.
Stoichiometric model and bioenergetic calculations
Basic set-up and principles of the stoichiometric network
are as previously described by e.g. Henriksen et al. (16) and van Gulik et al. (26, 27) for penicillin production by
Penicillium chrysogenum, a process with shares a common factor with lipid production, i.e. a high NADPH-demand.
Briefly, as no major changes in absolute levels of protein and
carbohydrate occurred after N-exhaustion and no extracellular
products could be detected by HPLC and GC (tested for
C/N-ratio 56, data not shown), it was assumed that storage lipid was
the only product and consisted solely of triacylglycerols. The
latter make up the bulk of the lipid if significant formation of
storage lipids occurs (2). Compartmentation of relevant
metabolites and reducing equivalents (NAD(P)H) was taken
into account. The PKS system is believed to be soluble and
presumably located in the cytosol, hence NADPH need to be
available there, as in the case for the synthesis of saturated FAs
by the fatty acid synthase. Glucose was assumed to be
transported by facilitated diffusion. For intracellular transport it
was assumed that movement of four protons across the inner
mitochondrial membrane equals 1 ATP, hence for instance
pyruvate transport in symport with one proton (27) requires ¼
ATP. Citrate is assumed to have a charge of -2 under
physiological conditions and transport is assumed to require ½
ATP. Various schemes for provision of acetyl-CoA and
NADPH are shown in Fig. 4a-b and are further discussed in the
text.
Statistics
Each data point represents an average of duplicate
experiments and assays. The data were subjected to statistical
analysis using SPSS (SPSS Inc., 1998, Chicago, IL, USA)
version 15 for windows (Duncan’s test). Significant differences
were reported for P < 0.05.
RESULTS AND DISCUSSION
Identification of strain
According to 18S rRNA analysis (sequence deposited at
the GenBank database under accession number JF266572),
strain B-072 is classified as an Aurantiochytrium sp.(formerly
Schizochytrium). Highest similarity to other strains in the database was found with Aurantiochytrium sp. LK4 (98% identity with 100% coverage), which was isolated in a Hong
Kong mangrove forest.
Growth and fatty acid content at different C/N-ratios A typical substrate consumption and product formation
profile for a cultivation with at a C/N-ratio of 56 (90 g/L
glucose and 9.4 g/L MSG.H2O) is depicted in Fig. 1a.
Following exponential growth under non-N limiting conditions
with low lipid formation, a linear phase of lipid formation was
1196
This pattern was typical for all C/N-ratio’s not exceeding
64 (data not shown). From microscopic observation, cell size
of Aurantiochytrium sp. B-072 was 8-15 micron at a C/N-ratio of 56. However, at a C/N-ratio of 84 a clear decrease in the rate
of glucose uptake with a concomitant reduction in lipid
synthesis rate was observed approximately halfway the
lipogenic phase, but eventually all glucose was consumed and a
lipid content of 73% w/w was reached (Fig. 1b). At a C/N-ratio
of 165, this decrease in glucose uptake/lipid formation rates
became even more pronounced and glucose consumption
terminated completely at a residual concentration of ca. 30 g/L.
At this point, the biomass level and TFA (Total Fatty Acid)
contents were only 29 g/L and 65.7% w/w, respectively (data
not shown). Data pertaining to maximal as well as fat-free
biomass and TFA for all C/N-ratio’s tested have been
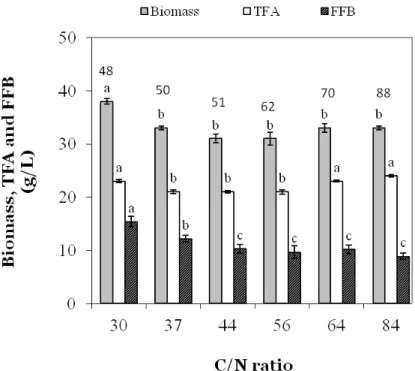
summarized in Fig. 2. Fat-free biomass decreased, and TFA
increased with decreasing amounts of N in the medium, but
total biomass fell in a narrow range (30-38 g/L) with a
statistically higher value for the lowest C/N-ratio tested (Fig.
2).
Figure 1. Levels of glucose, glutamate, biomass and TFA during baffled shake flask cultivation of Aurantiochytrium sp. B-072 with C/N ratio of 56 (a) and 84 (b). The cultures were grown at 25 °C and agitated at 200 rpm. Arrow indicates the time span
1197
Figure 2. Maximal biomass, fatty acid free biomass (FFB) and total fatty acid (TFA) of Aurantiochytrium sp. B-072 as function of the
C/N-ratio after growth in baffled flasks in a mineral glucose-MSG medium with glucose fixed at 90 g/L. A different letter indicates a
statistical difference (p<0.05) within a parameter. Data at the top of the figure indicate cultivation time in h.
In a further experiment the effect of fixing the C/N-ratio but
at the same time increasing absolute DHA-level was attempted. As
in the experiment described above a C/N-ratio of 56 resulted in the
highest FA synthetic rate (see section on fluxes below) this ratio
was then selected and glucose and MSG levels were increased to
150 and 15 g/l, respectively. This condition resulted in 51±2 g/L
biomass with a TFA content of 71±2 % w/w, statistically similar
to the value of 69±2 % w/w observed at the same C/N-ratio but
with 90 g/L glucose (Table 1). From Table 1 it can be calculated
that a maximal level of ca 6 g DHA/L was obtained and that DHA
constituted almost 20% w/w of total biomass. At this higher initial
glucose level, volumetric and specific TFA-fluxes amounted to
0.47 g/(L x h) and 0.66 g/(L x h), respectively (Fig. 3a).
Assay of the FA-profile showed a simple pattern which was
largely independent of either the time in the lipogenic phase where
samples were taken (data not shown) or the C/N-ratio. Myristic
acid (C14:0), palmitic acid (C16:0), docosapentaenoic acid (C22:5
n-6) and docosahexaenoic acid (C22:6 n-3) were the main
components, with the latter making up ca 24.5-27.5% of the TFA
(Table 1).
Table 1. Fatty acid profiles (% TFA) of Aurantiochytrium sp. B-072 grown on a mineral glucose-MSG medium as a function of
C/N-ratio with glucose fixed at 90 g/L. Samples were taken during the late lipogenic phase.
C/N ratio Fatty acid (% TFA)
C14:0 C16:0 C18:0 C20:3n6 C22:5n6 C22:6n3 TFA (%w/w) 30 7.7 61.2 1.1 1.3 3.1 25.6 60.1
37 10.6 57.6 1.1 1.2 3.0 26.5 64.6
44 10.8 58.7 0.9 1.2 3.2 25.2 66.8
56 12.0 58.2 0.9 1.2 3.1 24.5 68.5
56 a 11.5 55.8 1.0 1.3 3.2 27.2 71.0
64 11.5 57.4 0.8 0.9 3.4 26.0 69.1
84 10.0 59.2 1.2 0.8 5.3 23.6 72.6
165 b 5.9 60.0 1.2 0.4 7.6 25.0 65.7
a with 150 g/L glucose , b incomplete glucose utilization
1198
Figure 3. (a) Overall volumetric productivity and productivity during the lipogenic phase of total FAs and DHA (g/(L x h)) at different C/N-ratio’s in a glucose-MSG medium (glucose fixed at 90 g/L with an additional experiment at 150 g/L as marked by
closed symbol). (b) Specific fluxes (q) of glucose, saturated FAs (SFAs) and PUFAs based on fat-free biomass (mmol/(g fat-free
biomass x h)) during the lipogenic phase. For time point marked with * only the initial rate was calculated as fluxes were not
1199
Glucose and fatty acid fluxes at different C/N-ratio’s
In commercial practice, the volumetric productivity is an
important parameter, i.e. a high product level must be obtained in
a short time. The overall volumetric productivity (from inoculation
to point of glucose exhaustion) as well as the productivity during
the main lipogenic phase for both TFA and DHA is shown in Fig.
3a. However, volumetric productivity depends strongly on the
amount of fat-free biomass level and hence says little about the
actual capacity of an organism to produce TFA or DHA and the
mechanisms involved. Hence it is more useful to base data on
fat-free biomass. Glucose, TFA and individual FA specific fluxes
based on FA-free (FFB) biomass were calculated after depletion of
N by linear regression of the concentrations of glucose and
individual FAs in time. As at C/N-ratio >64 glucose and FA-levels
tended to bend strongly (Fig. 1b), only the initial rate was
calculated for these cases. To reduce data, all fluxes of saturated
FAs, which are produced via a conventional fatty acid synthase
(FAS) have been pooled. Similarly, fluxes through the PKS
system(s) that lead to PUFAs have been combined. The three
fluxes thus obtained had similar trends and went through a
maximum at a C/N-ratio of ca. 56 where qTFA reached 0.402
mmol TFA/(gFFB x h) (Fig. 3b).
Metabolic networks and energetics during the lipogenic phase
In order to potentially improve product yield or specific flux,
for instance by metabolic engineering, an understanding of the
metabolic network(s) and energetic involved in lipogenesis and
bioenergetics is important. A presumed key factor for lipogenesis
in oleaginous microorganisms is the presence of a cytosolic
ATP:citrate lyase (ACL) which splits citrate in acetyl-CoA and
oxaloacetate (OAA) (13). Whereas the former is then used for FA
synthesis, the latter has to be “re-cycled”. Based on a literature
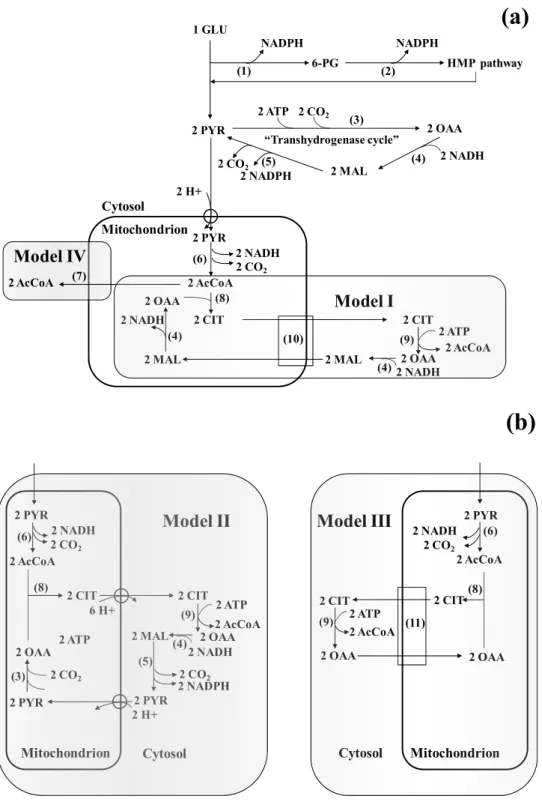
survey, three models were considered for the latter process. In
model I, which was originally developed for oleaginous yeasts (8),
OAA is converted into malate and then exchanged for citrate, thus
leading to an electroneutral exchange. This reduces the overall
ATP requirement by circumventing transport costs for either
malate or citrate. Model II differs from model I in that malate is
further converted into pyruvate by malic enzyme with production
of NADPH. Pyruvate is subsequently transported back into the
mitochondria (Fig. 4). Model III is based on the observation that
some non-oleaginous yeasts, i.e. Saccharomyces cerevisiae (9) and
plants (14) can directly transport OAA from the cytosol to the
mitochondria. The exact mechanism has not been resolved, though
it is conceivable that in the case of B-072 a citrate/OAA exchange
might occur (Fig. 4b). Finally, model IV lacks ACL but uses
transport of acetyl-CoA from mitochondria to cytosol by carnitine
acetyltransferase (CAT). In this case, no OAA is formed (Fig 4a).
This system possibly occurs in some yeasts (17) and filamentous
fungi (31).
As an example, calculation for the redox- and energy balance
employing model I is presented in Table 2. In this model, there is
no direct formation of NADPH in the pathways leading to
formation of the various FAs as evident from Fig. 4a. Hence a
high flux through the transhydrogenase cycle is required to
provide NADPH. However, this will simultaneously result in large
drain of cytosolic NADH as the reaction involved can be written
as [–NADH–ATP+NADPH =0], an aspect that has been ignored in
the literature. Consequently, NADH would have to be transferred
from the mitochondria to the cytosol by a “reverse”
NADH-shuttle. Whether this occurs in vivo has not been established so far.
Data for the other three models have been summarized in Table 3
with model I included for easier comparison. Model II has a lower
requirement for NADPH provision than the other models (2.1 vs
5.5 mmol/(g FFB x h)) due to the involvement of malic enzyme in
OAA recycling as shown in Fig. 4. However, it results in the
highest calculated ATP requirement due to transport costs for
citrate and pyruvate (cf. Fig. 4b). Model IV, however, results in a
relatively low ATP-requirement as it does not require input of
ATP for the reaction catalyzed by ATP:citrate lyase. This confirms
earlier in silico calculations for NADPH production required for
penicillin synthesis in Penicillium chrysogenum that suggest that
ACL is a major energy drain and re-routing though CAT might be
1200 (6)
2 PYR
2 NADH 2 CO2 2 AcCoA
2 CIT (8)
2 CIT
2 OAA
(9) 2 ATP
2 AcCoA 2 NADH (4) 2 MAL 2 MAL 2 OAA (10) 2 NADH (4)
Model I
Mitochondrion Cytosol 2 H+(a)
1 GLU 6-PG 2 PYRHMP pathway
2 OAA 2 MAL NADPH NADPH 2 NADH (1) (2) (3) (4) (5) 2 ATP “Transhydrogenase cycle” 2 NADPH 2 CO2
2 CO2
2 AcCoA (7)
Model IV
2 CIT 2 CIT
2 OAA (9) 2 NADH (4) 2 MAL 2 OAA 2 PYR 2 PYR (5) 2 NADPH 2 CO2 2 ATP
2 CO2 (3)
Model II
Mitochondrion Cytosol 2 H+(b)
6 H+ CytosolModel III
2 CIT 2 OAA(9) 2 ATP
2 AcCoA 2 ATP
2 AcCoA (11)
2 CIT 2 OAA Mitochondrion (8) (8) 2 PYR 2 PYR 2 NADH 2 CO2
(6)
2 AcCoA 2 NADH
2 CO2 (6)
2 AcCoA
Figure 4. Metabolic models for acetyl-CoA and NADPH provision during lipogenesis. NADPH-producing pathways i.e. HMP and
cytosolic “transhydrogenase cycle” as well as general route to pyruvate are shown in (a). Models I to III all use ATP-citrate lyase for
generation of acetyl-CoA. Subsequently, recycling of oxaloacetate (OAA) occurs by citrate-malate translocation in model I (a); pyruvate
formation in model II (b); or direct transport of OAA in model III (b). Model IV assumes direct acetyl-CoA supply via carnitine
acetyltransferase (a). The enzymes involved are: 1, glucose-6-phosphate dehydrogenase; 2, 6-phosphogluconate dehydrogenase; 3,
pyruvate carboxylase; 4, malate dehydrogenase; 5, NADP+-linked malic enzyme; 6, pyruvate dehydrogenase; 7, carnitine
1201
Table 2. Example of redox and bioenergetic calculations for lipid synthesis in Aurantiochytrium sp. B-072 at a C/N-ratio of 56 with a transhydrogenase cycle for NADPH supply and OAA recycling via malate-citrate translocase (model I, see Fig. 4a). Data
are expressed in mmol/(g fat-free biomass x h) with a minus sign indicating consumption.
Component or process Flux Glucose a NADPHcyt NADHmit NADHcyt ATP
C14:0 0.060 –0.210 –0.720 +0.840 – –0.360
C16:0 0.261 –1.044 –3.654 +4.176 – –1.827 DPA (C22:5n6) 0.012 –0.066 –0.180 +0.264 – –0.120 DHA (C22:6n3) 0.069 –0.380 –0.966 +1.518 – –0.690
Glycerol 0.136 –0.068 – – –0.136 –0.136
Triacylglycerol 0.136 – – – – –0.816
Sum –1.768 –5.520 +6.798 –0.136 –3.949
Transhydrogenase cycle +5.520 – –5.520 –5.520
Pyruvate transport – – – –1.044
Sum 0 +6.798 –5.656 –10.513
a Overall measured glucose uptake rate was –2.156 mmol/(gFFB x h).
Apart from the “transhydrogenase cycle”, a further route
of NADPH provision is the HMP pathway (hexose
monophosphate pathway), which yields 2 NADPH/glucose if it
operates in a non-cyclical manner. Hence if all glucose passed
through the HMP pathway and with a measured glucose flux of
ca 2.2 mmol/(g FFB x h), this might yield a maximum of 4.4
mmol NADPH/(g FFB x h). This would cover most of the flux
of 5.5 as calculated for all but model II (Table 3). To check the
feasibility of a major contribution of the HMP pathway,
specific activity (s.a.) of glucose-6-P-dehydrogenase (G6PDH)
and 6-P-gluconate dehydrogenase (6PGDH) was assayed. In
contrast to yeasts (3), a low s.a. of G6PDH.was found which
would limit the flux through HMP to only 1.4 mmol G6P/(g
FFB x h), equivalent to 2.8 mmol NADPH/(g FFB x h) (Table
5.). Except for model II, this falls far short of the calculated
flux, hence other sources of NADPH must be involved.
Activity of malic enzyme was sufficient to account solely for
the NADPH requirement (Table 5). This confirms various
reports suggesting that apart from ACL, the presence of
NADP-malic enzyme is another critical factor for lipogenesis
(13, 30).
A useful check for the feasibility of the various models is
to calculate the in vivo P/O-ratio, i.e. the efficiency with which ATP is formed by oxidation of NAD(P)H. The calculated P/O
varied considerably depending on the model, with a lowest
value of 0.9 for model IV, 1.6 for models I and III and 2.2 for
model II (Table 4). The low value for model IV can be
attributed to the bypassing of ATP citrate lyase which, as its
name implies, consumes one ATP per citrate formed. On the
other hand, a value of 2.2 significantly exceeds that of
estimated in vivo P/O-ratio’s in other microbes which range from ca. 1.0 to 1.8 (27, 28), suggesting that this model is not
feasible. Non-growth associated maintenance is not yet
included in these calculations which hence result in an
underestimation of the in vivo P/O. Unfortunately no maintenance data appear to be available for thraustochytrids
but using average literature data (0.023 glucose/gCDW/h or
0.128 mmol glucose/(g biomass x h) (27) for P. chrysogenum
as an example), the calculated P/O-ratio would increase by ca 30%, resulting in values of 1.4 to 3.0 (Table 4). Except for
model IV, these values are very high with respect to the
literature, leaving open the possibility that in vivo a combination of metabolic networks is involved, for instance I
plus IV. This would result in an intermediate P/O-ratio. In
addition, the HMP might contribute to NADPH-supply which
would reduce dependence on the cytosolic transhydrogenase
1202
Table 3. Overview of redox- and energy balance for lipid synthesis in Aurantiochytrium sp. B-072 at a C/N-ratio of 56 as calculated
from various stoichiometric models (see Fig. 4). Data are expressed in mmol/(g fat-free biomass x h) with a minus sign indicating
consumption. A refers to data for direct synthesis of lipids from glucose without balancing of NADPH or ATP, whereas these are
included in B. For a detailed sample calculation refer to Table 2.
NADPHcyt NADHmit NADHcyt ATP
Model A* A** A B A B
I –5.520 +6.798 –0.136 –5.656 –3.949 –10.513 II –2.121 +3.399 –0.136 –2.257 –7.348 –13.645 III –5.520 +3.399 +3.263 –2.257 –3.949 –10.513 IV –5.520 +3.399 +3.263 –2.257 –0.550 –7.114
* values for B are 0; ** values for A and B are identical (also see Table 2).
Table 4. Calculated in vivo P/O-ratio’s for the main lipogenic phase in Aurantiochytrium sp. B-072 at a C/N-ratio of 56 for various
stoichiometric models (see Fig 4).
Model
me I II III IV
0 1.6 2.2 1.6 0.9
0.128 * 2.2 3.0 2.2 1.4
* Using maintenance (me) data in mmol glucose/(g DCW x h) for Penicillium chrysogenum (van Gulik et al. 2001)
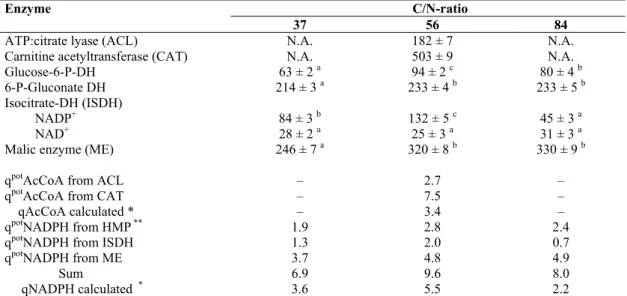
Table 5. Specific activity (nmol/(mg protein x min)) of NADPH- and acetyl-CoA-producing enzymes for selected C/N-ratio’s during
growth of Aurantiochytrium sp. B-072 on a glucose-MSG mineral medium. Samples were taken at the late lipogenic phase. Potential
NADPH-flux (qpot, mmol/(g fat-free biomass x h)) through these enzymes assuming they operate at Vmax is also shown as is calculated
flux.
Enzyme C/N-ratio
37 56 84
ATP:citrate lyase (ACL) N.A. 182 ± 7 N.A. Carnitine acetyltransferase (CAT) N.A. 503 ± 9 N.A. Glucose-6-P-DH 63 ± 2 a 94 ± 2 c 80 ± 4 b 6-P-Gluconate DH 214 ± 3 a 233 ± 4 b 233 ± 5 b Isocitrate-DH (ISDH)
NADP+ 84 ± 3 b 132 ± 5 c 45 ± 3 a NAD+ 28 ± 2 a 25 ± 3 a 31 ± 3 a Malic enzyme (ME) 246 ± 7 a 320 ± 8 b 330 ± 9 b
qpotAcCoA from ACL – 2.7 –
qpotAcCoA from CAT – 7.5 –
qAcCoA calculated * – 3.4 –
qpotNADPH from HMP ** 1.9 2.8 2.4
qpotNADPH from ISDH 1.3 2.0 0.7
qpotNADPH from ME 3.7 4.8 4.9
Sum 6.9 9.6 8.0
qNADPH calculated * 3.6 5.5 2.2
N.A.: not assayed, DH: dehydrogenase. A different letter indicates a significant difference (p<0.05). * Data calculated assuming model I (also applicable for III and IV)
** Maximal flux through G-6-P-DH multiplied with two to account for 6-P-G-DH.
Comparison with other DHA-producing microbes
A brief literature survey was performed in order to
compare results for B-072 with other DHA-producing
microbes. Autothrophs which have low specific
substrate/product fluxes were excluded from this listing. The
1203
significantly lower or higher than the optimal value in the
present study, though this may be partly due to strain
differences. Furthermore, conditions have not necessarily been
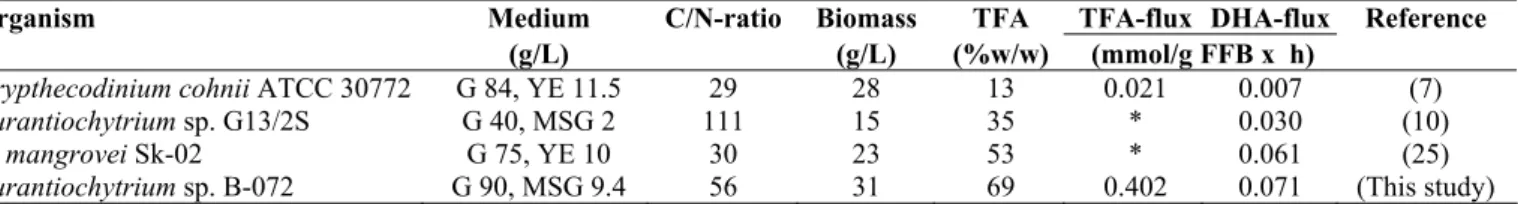
optimized. In terms of DHA-specific flux, values of 0.03 to
0.06 mmol DHA/(gFFB x h) were calculated for various
aurantiochytrids, but C. cohnii performed poorly with a value of only 0.007, more than 10-fold lower than Aurantiochytrium sp. B-072 (Table 6). During the lipogenic phase, the yield of
TFA on glucose in C. cohnii was only 0.07 g TFA/g glucose consumed, whereas at C/N-ratio of 56, it reached a value of
0.28 (calculated from Fig. 1a) for B-072. Possibly the low TFA
yield in C. cohnii is caused by, among others, a loss of carbon via formation of extracellular polysaccharides as well as a high
maintenance due to the high motility of this dinoflagellate,
resulting in a high respiration. Hence less glucose would be
available for lipid formation.
Table 6. Comparison of media and data related to FA-formation in oleaginous, DHA-producing microorganisms under heterotrophic growth conditions.
Organism Medium C/N-ratio Biomass TFA TFA-flux DHA-flux Reference
(g/L) (g/L) (%w/w) (mmol/g FFB x h)
Crypthecodinium cohnii ATCC 30772 G 84, YE 11.5 29 28 13 0.021 0.007 (7)
Aurantiochytrium sp. G13/2S G 40, MSG 2 111 15 35 * 0.030 (10)
A. mangrovei Sk-02 G 75, YE 10 30 23 53 * 0.061 (25)
Aurantiochytrium sp.B-072 G 90, MSG 9.4 56 31 69 0.402 0.071 (This study)
G=glucose, MSG=monosodium glutamate, YE=yeast extract. * insufficient data available All experiments were performed at 25-28 ˚C
Implications for optimization of DHA production by Aurantiochytrium sp.
A high C/ratio results in a prolonged period of
N-starvation which presumably affects the physiology of the cells
and results in a decrease in the lipid formation rate as also
evidenced for B-072 at C/N-ratio >64 (cf Fig. 1b). In some
oleaginous microbes this problem occurs irrespective of the
C/N-ratio, assuming that sufficient glucose is available for
lipogenesis. For instance, in fungi such as Mucor circinelloides
a continuous decrease in the lipid formation rate is observed
starting from the moment N-limitation is reached. Eventually
this results in a cessation of glucose uptake and lipid formation
at quite low TFA contents, i.e. 12% w/w for M. circinelloides.
This is thought to be due to a rapid decrease in the specific
activity of particularly malic enzyme, thereby limiting NADPH
supply for lipid formation. Indeed, overexpression of ME (from
ca 30 to 70 mU/mg protein at the start of lipogenesis) in
recombinant strains of this fungus increased lipid content to
30% w/w (33). However, when malic- and other
NADPH-producing enzymes were assayed in the late lipogenic phase in
B-072 at several C/N-ratio’s (i.e. 37, 56 and 84), the only
major difference at the high C/N was a large decrease in
NADP+-isocitrate dehydrogenase(s) (Table 5). Furthermore it
is noteworthy that activity of ME in B-072 (246-330 mU/mg
protein, Table 5) exceeds that reported for various oleaginous
microbes by a factor of three to five (for data see (4) and
references therein).
The high conversion factor of glucose into TFA coupled
with the high apparent in vivo P/O-ratio’s irrespective of the model used (Table 4) suggest that the overall yield of lipid in
B-072 is close to its theoretical maximum. Hence medium
development will of limited use. However, ammonium might
be a cheaper alternative to glutamate. In theory, provision of
cytosolic acetyl-CoA by removal of ACL and re-routing
through CAT (as in model IV) should give a small increase in
lipid yield due to the more favorable energetics (Table 3). The
main aim, however, would be a relative increase in the
%DHA/TFA. The latter is not greatly influenced by the
C/N-ratio (Table 1). From literature data, it appears that higher
1204
process temperature (24) and/or oxygen limitation (5).
Unfortunately these factors will also reduce the specific growth
and lipid synthetic rates. Overexpression of the PKS system by
random mutation would be useful in this and might prevent
GMO issues.
It would be of great interest to attempt further analysis of
metabolic pathways in Aurantiochytrium, for instance by 13 C-NMR (9). The high volumetric and specific fatty acid fluxes
attained in Aurantiochytrium sp. B-072 as compared to oleaginous yeasts and fungi makes it an interesting subject as a
better understanding of its physiology might help to improve
lipid formation in other microbes.
ACKNOWLEDGEMENTS
This study was supported by a grant from the Thailand
Research Fund through the Royal Golden Jubilee Ph.D.
Program (Grant No. PHD/0241/2547) under supervision of CV
and was partially supported by RA scholarship from the
Faculty of Graduate Studies, Mahidol University Academic
Year 2009. We would like to thank dr. Thunyarat
Pongtharangkul for helpful discussions.
REFERENCES
1. Adler-Nissen, J. (1979). Determination of the degree of hydrolysis of food protein hydrolysates by trinitrobenzenesulfonic acid. J. Agric. Food. Chem. 27, 1256-1262.
2. Ashford, A.; Barclay, W.R.; Weaver, C.A.; Giddings, T.H.; Zeller, S. (2000). Electron microscopy may reveal structure of docosahexaenoic acid-rich oil within Schizochytrium sp.. Lipid. 35, 1377-1387.
3. Bruinenberg, P.M.; van Dijken, J.P.; Scheffers, W.A. (1983). An enzymic analysis of NADPH production and consumption in Candida utilis. J. Gen. Microbiol. 129, 965-971.
4. Certik, M.; Megova, J.; Horenitzky, R. (1999). Effect of nitrogen sources on the activities of lipogenic enzymes in oleaginous fungus Cunninghamella echinulata. J. Gen. Appl. Microbiol. 45, 289-293.
5. Chi, Z.; Liu, Y.; Frear, C.; Chen, S. (2009). Study of a two-stage growth of DHA-producing marine algae Schizochytrium limacinum SR21 with shifting dissolved oxygen level. Appl. Microbiol. Biotechnol. 81, 1141-1148.
6. Chodchoey, K; Verduyn, C. (2011). Growth, fatty acid profile in major lipid classes and lipid fluidity of Aurantiochytrium mangrovei Sk02 as a function of growth temperature. Braz. J. Microbiol. In press.
7. De Swaaf, M.E.; Rijk, de T.C.; Eggink, G.; Sijtsma, L. (1999). Optimisation of docosahexaenoic acid production in batch cultivations of Crypthecodinium cohnii. J. Biotechnol. 70, 185-192.
8. Evans, C.T.; Scragg, A.H.; Ratledge, C. (1983). A comparative study of citrate efflux from mitochondria of oleaginous and non-oleaginous yeasts. Eur. J. Biochem. 130, 195-204.
9. Fiaux, J.; Çakar, Z.P.; Sonderegger, M.; Wüthrich, K.W.; Szyperski, T.; Sauer, U. (2003). Metabolic-flux profiling of the yeasts Saccharomyces cerevisiae and Pichia stipitis. Eukaryot. Cell. 2, 170-180.
10. Ganuza, E.; Izquierdo, M.S. (2007). Lipid accumulation in Schizochytrium G13/2S produced in continuous culture. Appl. Microbiol.
Biotechnol. 76, 985-990.
11. Garelli, A.; Rotstein, N.P.; Politi, L.E. (2006). Docosahexaenoic acid promotes photoreceptor differentiation without altering crx expression. Invest. Ophthalmol. Vis. Sci. 47, 3017-3027.
12. Grzebyk, D.; Sako, Y.; Berland, B. (1998). Phylogenetic analysis of nine species of Prorocentrum (Dinophyceae) inferred from 18S ribosomal DNA sequences, morphological comparisons, and description of Prorocentrum panamensis, sp. nov.. J. Phycol. 34, 1055-1068.
13. Hamid, A.A.; Mokhtar, N.F.; Taha, E.M.; Omar, O.; Yusoff, W.M.W. (2010). The role of ATP citrate lyase, malic enzyme and fatty acid synthase in the regulation of lipid accumulation in Cunninghamella sp. 2A1. Ann. Microbiol. 61, 463-468.
14. Hanning, I.; Baumgarten, K.; Schott, K.; Heldt, H.W. (1999). Oxaloacetate transport into plant mitochondria. Plant. Physiol. 119, 1025-1031.
15. Harris, D.M.; Diedrich, J.A.; van der Krogt, Z.A.; Luttik, M.A.; Raamsdonk, L.M.; Bovenberg, R.A.; van Gulik, W.M.; van Dijken, J.P.; Pronk, J.T. (2006). Enzymic analysis of NADPH metabolism in β -lactam-producing Penicillium chrysogenum: presence of a mitochondrial NADPH dehydrogenase. Metabolic. Eng. 8, 91-101.
16. Henriksen, C.M.; Christensen, L.H.; Nielsen, J.; Villadsen, J. (1996). Growth energetics and metabolic fluxes in continuous cultures of Penicillium chrysogenum. J. Biotechnol. 45, 149-164.
17. Holdsworth, J.E.; Veenhuis, M.; Ratledge, C. (1988). Enzyme activities in oleaginous yeast accumulating and utilizing exogenous or endogenous lipids. J. Gen. Microbiol. 134, 2907-2915.
18. Kohlhaw, G.; Tan-Wilson, A. (1977). Carnitine acetyltransferase: candidate for the transfer of acetyl groups through the mitochondrial membrane of yeast. J. Bacteriol. 129, 1159-1161.
1205 20. Qui, X. (2003). Biosynthesis of docosahexaenoic acid (DHA,
22:6-4,7,10,13,16,19): two distinct pathways. Prostaglandins. Leukot. Essent. Fatty Acids. 68, 181-186.
21. SanGiovanni, J.P.; Chew, E.Y. (2005). The role of omega-3 long-chain polyunsaturated fatty acids in health and disease of the retina. Prog. Retin. Eye Res. 24, 87-138.
22. Srere, P.A. (1962). Citrate cleavage enzyme. Methods Enzymol. 5, 641-644.
23. Tamura, K.; Dudley, J.; Nei, M.; Kumar, S. (2007). MEGA4: molecular evolutionary genetics analysis (MEGA) software version 4.0. Mol. Biol. Evol. 24, 1596–1599.
24. Taoka, Y.; Nagano, N.; Okita, Y.; Izumida, H.; Sugimoto, S.; Hayashi, M. (2009). Influences of culture temperature on the growth, lipid content and fatty acid composition of Aurantiochytrium sp. strain mh0186. Mar. Biotechnol. 11, 368-374.
25. Unagul, P.; Assantachai, C.; Phadungruenluij, S.; Pongsuteeragul, T.; Suphantharika, M.; Verduyn, C. (2005). Properties of the docosahexaenoic acid-producer Schizochytrium mangrovei SK2: effects of glucose, temperature and salinity and their interaction. Bot. Mar. 48, 387-394.
26. van Gulik, W.M.; de Laat, W.T.A.M.; Vinke, J.L.; Heijnen, J.J. (2000). Application of metabolic flux analysis for the identification of metabolic bottlenecks in the biosynthesis of penicillin-G. Biotechnol. Bioeng. 68, 602-618.
27. van Gulik, W.M.; Antoniewicz, M.R.; de Laat, W.T.A.M.; Vinke, J.L.; Heijnen, J.J. (2001). Energetics of growth and penicillin production in a high-producing strain of Penicillium chrysogenum. Biotechnol. Bioeng. 72, 185-193.
28. Verduyn, C.; Stouthamer, A.H.; Scheffers, W.A.; van Dijken, J.P. (1991). A theoretical evaluation of growth yields of yeasts. Antonie van Leeuwenhoek. 59, 49-63.
29. Ward, O.P.; Singh, A. (2005). Omega-3/6 fatty acids: alternative sources of production. Proc. Biochem. 40, 3627-3652.
30. Wynn, J.P.; Hamid, A.A.; Midgley, M.; Ratledge, C. (1998). Widespread occurrence of ATP:citrate lyase and carnitine acetyltransferase in filamentous fungi. World J. Microbiol. Biotechnol. 14, 145-147. 31. Wynn, J.P.; Hamid, A.A.; Ratledge, C. (1999). The role of malic enzyme
in the regulation of lipid accumulation in filamentous fungi. Microbiol. 145, 1911-1917.
32. Yang, H.-L.; Lu, C.-K.; Chen, S.-F.; Chen, Y.-M.; Chen, Y.-M. (2010). Isolation and characterization of Taiwanese heterotrophic microalgae: screening of strains for docosahexaenoic acid (DHA) production. Mar. Biotechnol. 12, 173-185.
33. Zhang, Y.; Adam, I.P.; Ratledge, C. (2007). Malic enzyme: the controlling activity for lipid production? Overexpression of malic enzyme in Mucor circinelloides leads to a 2.5-fold increase in lipid accumulation. Microbiol. 153, 2013-2025.