Vol.54, n. 2: pp. 307-313, March-April 2011
ISSN 1516-8913 Printed in Brazil BRAZILIAN ARCHIVES OF
BIOLOGY AND TECHNOLOGY
A N I N T E R N A T I O N A L J O U R N A L
Incorporation of n-3 Fatty Acids by the Liver of Mice Fed
Linseed Oil as a Function of Feeding Duration
João Angelo Lima Perini
1, Flávia Braidotti Stevanato
1,
Jeane Eliete Laguila Visentainer
2,
Sheisa Cyléia Sargi
2, Marcia Machado Oliveira
2, Nilson Evelázio Souza
1, Makoto
Matsushita
1and Jesuí Vergílio Visentainer
1*1Departamento de Química; Universidade Estadual de Maringá; Av. Colombo, 5.790; 87020-900; Maringá - PR -
Brasil. 2Departamento de Análises Clínica; Universidade Estadual de Maringá; 87020-900; Maringá - PR - Brasil
ABSTRACT
The objective of this study was to evaluate the incorporation of omega-3 fatty acids (n-3 FA) on male Swiss mice livers receiving diets based on linseed oil (LO) for up to 56 days. The mice were sacrificed at 7, 14, 28, 42, 56 days and FA concentration was analyzed by gas chromatography. A total of 13 FA were identified on LO feeds presenting alpha-linolenic acid (LNA) contents of 26.97 %. A total 22 FA were identified in the livers of the mice. Part of the LNA was converted into n-3 FA (20:3n-3, eicosapentaenoic acid-EPA, 22:5n-3, and docosahexaenoic acid- DHA), and some of the LNA was stored in the liver. LNA, EPA and DHA concentrations (mg/g total lipids ) from 0 days for up 56 days increased from 1.29 to 18.90 (LNA), 0.20 to 18.90 (EPA) and 41.26 to 99.17 (DHA).The concentration of n-3 FA in the livers varied with the duration of the LO diet. During LO feed, n-6 FA concentration fell and n-3 FA concentration rose through the experimental period.
Key words: polyunsaturated fatty acids,mice, liver,linseed oil
*Author for correspondence: [email protected]
INTRODUCTION
Mice are used in experiments because of their biological similarities to human beings. They are monogastric mammals and present metabolic routes and DNA segments similar to those of human beings (Harris, 1997; Leon, 2005). Linseed oil is the richest known source of alpha-linolenic acid (LNA, 18:3n-3), a precursor of the long chain n-3 PUFA series (de Souza et al., 2008; Tonial et al., 2009). LNA and linoleic acid (LA, 18:2n-6) are essential fatty acids and are metabolized by the same sequential desaturation and elongation enzyme systems, which results in the production of long chain polyunsaturated fatty acids
The typical western diet has high levels of n-6 FA in the form of vegetable oils, such as sunflower oil, corn oil, cottonseed oil, and especially soybean oil, which is the most consumed oil in the world. On the other hand, lower intake of n-3 FA occurs, as for example, through the intake of linseed oil and fish oil (Visentainer et al., 2005). The level of dietary n-3 FA may be changed by the concomitant intake of other types of fats. It is recognized that n-6 and n-3 FA compete for elongation and desaturation. This competition for 6 desaturase affects the incorporation of n-3 LC-PUFA metabolites in tissues, which affects the impact of n-3 LC-PUFA on chronic disease (James et al., 2000).
The intake of n-6 FA promotes the role of AA as a precursor of the 2-series prostanoids and the 4-series leukotrienes in the metabolism of eicosanoids. This creates a proinflammatory, proaggregatory environment that may affect the development or progression of chronic diseases (Garófolo and Petrilli, 2006). The intake of n-3 polyunsaturated fatty acids (PUFA) (from linseed oil or marine oils) partially replaces the 20:4n-6 in the eicosanoid metabolism, favoring the less inflammatory and aggregatory 3-series prostanoids and 5-series leukotrienes (Surette, 2008).
The competition between n-6 and n-3 FA may be clinically important and may affect the development or progression of diseases (Vancassel et al., 2007). It is worth nothing that AA is important for fetal growth and the metabolism of prostaglandins (Calder, 2006; Innis, 2007), while among LC-PUFA, EPA and DHA have received much attention from the scientific communities because of their positive role in human health (Carl et al., 2009; Calder, 2006; Chapkin et al., 2009). Studies in humans have also demonstrated the conversion of LNA to EPA and DHA (Harnack et al., 2009).
Thus, this study aimed to evaluate the incorporation of LNA and the conversion of LNA into their long-chain homologues in the liver of mice fed linseed oil as a function of feeding time of 56 days.
MATERIALS AND METHODS
Animal and diets
Thirty-six male Swiss mice, weighing 25.0 ±2.0 g
aged four weeks old were fed commercial diet supplemented with 3% (w/w) sunflower oil (Table 1). The experiment with linseed oil diet (3.0% w/w, Table 1) was carried out for eight weeks (56 days). The mice were randomly assigned to six groups of six specimens each in two replicates and were individually kept in polycarbonate cages and fed linseed oil diets ad libitum. The temperature
was controlled at 23-24°C with 12-h light/dark cycles. This study was performed in accordance with the guidelines of the Ethics Committee for Research with Animals of UEM (No. 9751/2007-PRO), according to Brazilian Laws.
On the first day, six mice were sacrificed, starting at day zero (before the beginning of the treatments with linseed oil) and every day thereafter (7, 14, 28, 42, 56 days). After the mice were killed, the liver was removed and kept in polyethylene bags in N2 atmosphere at -18°C. In the beginning of each analysis, the liver samples were allowed to equilibrate to room temperature, diced, and homogenized.
Total lipids, moisture, and fatty acid
composition
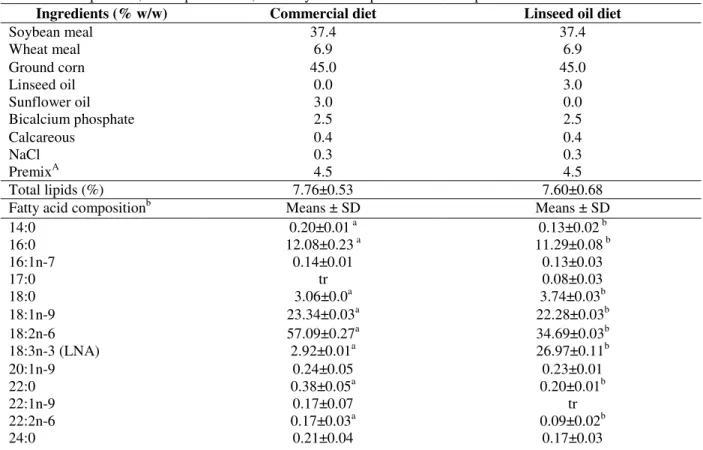
Table 1 - Composition, total lipid content, and fatty acid composition of the experimental diets
Ingredients (% w/w) Commercial diet Linseed oil diet
Soybean meal 37.4 37.4
Wheat meal 6.9 6.9
Ground corn 45.0 45.0
Linseed oil 0.0 3.0
Sunflower oil 3.0 0.0
Bicalcium phosphate 2.5 2.5
Calcareous 0.4 0.4
NaCl 0.3 0.3
PremixA 4.5 4.5
Total lipids (%) 7.76±0.53 7.60±0.68
Fatty acid compositionb Means ± SD Means ± SD
14:0 0.20±0.01 a 0.13±0.02 b
16:0 12.08±0.23 a 11.29±0.08 b
16:1n-7 0.14±0.01 0.13±0.03
17:0 tr 0.08±0.03
18:0 3.06±0.0a 3.74±0.03b
18:1n-9 23.34±0.03a 22.28±0.03b
18:2n-6 57.09±0.27a 34.69±0.03b
18:3n-3 (LNA) 2.92±0.01a 26.97±0.11b
20:1n-9 0.24±0.05 0.23±0.01
22:0 0.38±0.05a 0.20±0.01b
22:1n-9 0.17±0.07 tr
22:2n-6 0.17±0.03a 0.09±0.02b
24:0 0.21±0.04 0.17±0.03
APremix. Vitamin and mineral supplements per Kg: Vit. A (500.000 UI), Vit. D3 (200.000 UI), Vit. E (5.0 g), Vit. K3 (1.0 g),
Vit. B1 (1.5 g), Vit. B2 (1.5 g), B6 (1.5 g), B12 (4.0 g), Vit. C (15.0 g), Folic acid (500 mg), Pantotenic acid (4.0 g), BHT (17.5 g), Biotine (50.0 mg), Coline (40.0 mg), Copper (0.5 g), Cobalt (10.0 mg), Iron (5.0 g), Inositol (10.0 g), Iodine (50.0 mg), Manganese (1.5 g), Nicotinamide (7.0 g), selenium (10.0 mg), Zinc (5.0 g). bValue expressed as percentage of total fatty acid methyl esters of six replicates analyses. Averages followed by different letters in the same line are significantly different (p<0.05) by Tukey’s test. Abbreviations: SD (standard deviation), LNA (alpha-linolenic acid), tr - trace (area <0.05%).
Quantification of fatty acid methyl esters (FAME)
The concentration of fatty acids in mg.g-1 of total lipids in liver tissue was measured against tricosanoic acid methyl ester (23:0) from Sigma (USA) as an internal standard as described by Joseph and Ackman (1992). The following formula was used to calculate the concentrations:
AX x WIS x CFX FA (mg.g-1 TL) = ________________
AIS x WX x CFEA
where TL is total lipids, AX is the peak area of fatty acids, AIS is the peak area of the internal standard (IS) tricosanoic acid methyl ester (23:0), WIS is the weight (mg) of IS added to the sample (in mg), WX is the sample weight (in mg), CFX is the theoretical correction factor, and CFEA is the correction factor of methyl ester for fatty acids.
Statistical analysis
The values of the means were statistically compared by Tukey’s test at 5% with one-way ANOVA. Data were processed using the Statistica software 7.0 (StatSoft, Statistica, 2005).
RESULTS AND DISCUSSION
The total lipids contents of mouse livers (Table 2) were 4.41% (commercial diet) against a mean value of 4.24% (linseed oil diet) and they did not differ significantly (p>0.05). The quantitative analysis of FA of livers, expressed in mg of fatty acids per gram of total lipid (mg/g TL), is presented in Table 2 and the qualitative analysis is shown in Figure 1. A total of 22 FA were
identified in the livers of mice fed with the commercial and linseed oil diet (Fig. 1). The major FA were 16:0 and 18:0 (saturated), 18:1n-9 and 18:1n-7 (monounsaturated), 18:2n-6 (diunsaturated), and the prevailing long-chain polyunsaturated FA (LC-PUFA) were arachidonic acid (20:4n-6) and docosahexaenoic acid (DHA, 22:6n-3).
Table 2 - Total lipids content, weight, and fatty acid composition of mouse livers.
Linseed oil diet Commercial
diet 0 day 7 days 14 days 28 days 42 days 56 days TL (%) 4.41±0.91 4.37±0.09 4.43±0.85 3.98±0.20 4.02±0.22 4.38±0.02 Liver weight (g) 2.2±0.3 2.2±0.3 2.5±0.3 2.8±0.4 2.9±0.4 2.8±0.3 Fatty acidsA
Figure 1 - Representative chromatogram of mouse liver’s fatty acid methyl esters. (1) 14:0; (2)
15:0; (3) 16:0; (4) 16:1n-9; (5) 16:1n-7; (6) 17:0; (7) 18:0; (8) 18:1n-9; (9) 18:1n-7; (10) 18:2n-6; (11) 18:3n-6; (12) 18:3n-3; (13) 20:1n-9; (14) 20:3n-6; (15) 20:3n-3; (16) 20:4n-6; (17) 20:2n-6; (18) 20:5n-3; (19) 24:0; (20) 24:1n-9; (21) 22:5n-3 and (22) 22:6n-3.
LNA is a precursor of the n-3 fatty acid series. Only LNA was present in the feeds in this experiment (Table 1). The level of LNA, in mouse livers was 1.29 mg/g (commercial diet), and under the linseed diet, it increased from 11.86 mg/g (7 days) to 18.90 mg/g (56 days). The highest value of LNA was at 28 days (25.87 mg/g). After that, the values decreased to 20.51 mg/g (42 days) and 18.90 mg/g (56 days). Part of LNA was converted into n-3 FA series (20:3n-3, EPA, 22:5n-3, and DHA) and some of the LNA were stored in the livers rather than converted. For the commercial diet, the 20:3n-3, EPA, 22:5n-3, and DHA levels were lower than the lowest values for the linseed oil diet. The highest values as a function of feeding duration were for LNA [25.87 mg/g (28 days), EPA, 17.51 mg/g (56 days), and DHA, 95.13 mg/g (56 days)]. The AA level (Table 2) of the commercial diet was 89.01 mg/g against 46.60 mg/g (medium value) for the linseed oil diet (p<0.05); however, they did not differ significantly (p>0.05) with feeding duration.
The reduction of the AA content following dietary LNA supplementation is well documented (Rambjor et al., 1996). During the last 40 years, the ratio of dietary (n-6) to (n-3) FA in the industrialized societies has increased because of increased consumption of vegetable oils rich in n-6 (Surette, 2008). The estimated consumption ratio
of n-6/n-3 is 9.8:1. It has been determined on the basis of USA diet, which is much higher than the current recommendation (i.e., 2.3:1). Many countries, diet have n-6/n-3 ratio from 10:1 to 20:1 (Simopoulos, 2002), with cases up to 50:1 (Simopoulos, 2004). There are several recommendations (2:1 to 10:1) for n-6/n-3 ratio (Simopoulos et al., 1999; Schaefer et al., 2002; Chardigny et al., 2001; NCM, 1996; Matin et al., 2006). However, there is still no consensus for ideal ratio of n-6 to n-3. Thus, there is need to stress that 2.3:1 ratio recommendation is made to maximize the conversion of ALA to DHA (Masters, 1996). This could be achieved by a 4-fold increase in fish consumption (Kris-Etherton et al., 2000). In the present study, n-6/n-3 ratio fell approximately 3-fold for 56 days.
(p<0.05) in relation to day 7, and the n-6/n-3 ratio remained constant. However, in 56 days, PUFA and n-3 peaked at 336.71 and 152.17 mg/g, respectively.
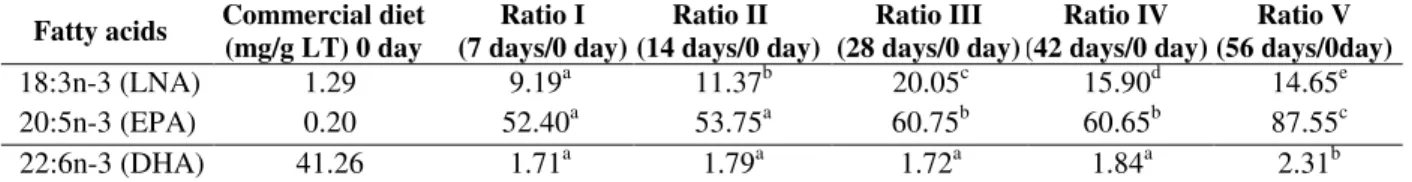
Table 3 shows the ratio variation for LNA, EPA, and DHA concentrations with time (7, 14, 28, 42, and 56 days) as a function of the concentration at
day 0 (1.29 mg/g). The highest value of LNA at 28 days was 20.05 times higher than that at 0 day. The EPA and DHA values were 87.55 and 2.31 times higher at 56 days, respectively. This indicated that the background diets were highly influenced by the feeding duration.
Table 3 - Ratios of LNA, EPA and DHA concentrations as a function of feeding duration relative to the day 0 concentration.
Fatty acids Commercial diet (mg/g LT) 0 day
Ratio I (7 days/0 day)
Ratio II (14 days/0 day)
Ratio III (28 days/0 day)
Ratio IV (42 days/0 day)
Ratio V (56 days/0day)
18:3n-3 (LNA) 1.29 9.19a 11.37b 20.05c 15.90d 14.65e
20:5n-3 (EPA) 0.20 52.40a 53.75a 60.75b 60.65b 87.55c
22:6n-3 (DHA) 41.26 1.71a 1.79a 1.72a 1.84a 2.31b
Values followed by different letters in the same line are significantly different (p<0.05) by Tukey’s test. Abbreviations: LNA (alpha-linolenic acid), EPA (eicosapentaenoic acid), DHA (docosahexaenoic acid).
The effects of the substitution of sunflower oil (3%, w/w) with linseed oil (3%, w/w) in mouse feed for 56 days resulted in significantly different concentrations of FA in the liver. Linseed oil feed afforded an increase in the concentration of n-3 FA and a decrease in the concentration of n-6 FA during the feeding. The results also indicated a variation in FA concentrations with time during the feeding.
ACKNOWLEDGMENTS
We are thankful to the Coordenação de Aperfeiçoamento de Pessoal de Nível Superior (CAPES).
REFERENCES
Bligh, E.G. and Dyer, W.J. (1959), A rapid method of total lipid extraction and purification. Can. J. Biochem.,37, 911-917.
Calder, P. (2006), N-3 Polyunsaturated fatty acids, inflammation, and inflammatory diseases. A. J. Clin. Nutr., 83(suppl), 1505S-1519S.
Carl, J.L.; Richard, V.M.; Mandeep, R.M. and Hector, O.V. (2009), Omega-3 polyunsaturated fatty acids and cardiovascular diseases. J. Am. Coll. Cardiol.,54, 585-594.
Chapkin, R.S.; Kim, W.; Lupton, J.R. and McMurray, D.N. (2009), Dietary docosahexaenoic and eicosapentaenoic acid: Emerging mediators of inflammation. Prost. Leuk. Essent Fatty Acids, 81, 187-191.
Chardigny, J. M., Bretilooon, L., Sébédio, J. L., (2001), Newinsights in health effects of trans alpha-linolenic acid isomers in humans. Eur. J. Lipids Sci. Technol., 103, 478-482.
Cunniff, P.A. (1998), Official Methods of Analysis of AOAC International. 16. ed., Association of Official Analytical Chemists, Arlington, CD-Rom.
de Souza, N.E.; Stevanato, F.B.; Garcia, E.E.; Visentainer, J.E.L.; Zara, R.F. and Visentainer, J.V. (2008), Supplemental dietary flaxseed oil affects both neutral and phospholipid fatty acids in cultured tilapia. Eur. J. Lipid Sci. Technol.,110, 707-713.
Garófolo, A. and Petrilli, A.S. (2006), Balanço entre ácidos graxos ômega-3 e 6 na resposta inflamatória em pacientes com câncer e caquexia. Rev. Nutr., 19, 611-621.
Harnack, K.; Andersen, G. and Somoza, V. (2009), Quantitation of alpha-linolenic acid elongation to eicosapentaenoic and docosahexaenoic acid as affected by the ratio of n6/n3 fatty acids. Nutr. Metabol., 6, 1-11.
Harris, W.S. (1997), N-3 fatty acids and serum lipoproteins: animal studies. Am. J. Clin. Nutr., 65
(suppl), 1611S-1616S.
James, M.; Gibson, R. and Cleland, L. (2000), Dietary polyunsaturated fatty acids and inflamamatory mediator production. Am. J. Clin. Nutr., 72 (supply),
343S-348S.
Joseph, J.D. and Ackman R.G. (1992), Capillary column gas chromatography method for analysis of encapsulated fish oil and fish oil ethyl esters: collaborative study. J. AOAC Inter.,75, 488-506. Kris-Etherton, P.M.; Taylor, D.S.; Yu-Poth, S.; Huth,
P.; Moriarty, K.; Fishell, V.; Hargrove, R.L.; Zhao, G. and Etherton, T.D. (2000), Polyunsaturated fatty acids in the food chain in the United States. Am. J. Clin. Nutr., 71, 179S–188S.
Leon, L.R. (2005), The use of gene knockout mice in thermoregulation studies. J. Thermal Biol., 30,
273-288.
Maia, E.L and Rodriguez-Amaya, D.B. (1993), Avaliação de um método simples e econômico para a metilação de ácidos graxos com lipídios de diversas espécies de peixe. Rev Instituto Adolfo Lutz. 53,
27-35.
Martin, C. A.; Almeida, V. V.; Ruiz, M. R.; Visentainer, J. E. L.; Matsushita, M.; de Souza, N. E.; Visentainer, J. V. (2006), Ácidos graxos poliinsaturados ômega-3 e ômega-6: importância e ocorrência em alimentos. Rev. Nutr., 19, 761-770.
Martin, C.A.; de Oliveira, C.C.; Visentainer, J.V.; Matsushita, M. and de Souza, N.E. (2008), Optimization of the selectivity of a cyanopropyl stationary phase for the gas chromatographic analysis of trans fatty acids. J. Chromatogr. A, 1194 ,
111-117.
Masters, C. (1996), Fatty acids and peroxisome. Mol. Cell Biochem., 165, 83-93.
NCM (Nordic Council os Ministers), (1996), Nordic nutrition recommendations. Scand. J. Nutr., 40,
161-165.
Qiu, X. (2003), Biosynthesis of docosahexaenoic acid (DHA, 22:6-4,7,10,13,16,19): two distinct pathways.
Prost. Leuk. Essent Fatty Acids, 68, 181-65.
Rambjor, G.S.; Walen, A.I.; Windsor, S.L. and Harris, W.S. (1996), Eicosapentaenoic acid is primarily responsible for hypotriglyceridemic effect of fish oil in Human. Lipids., 31, S45-S49.
Schaefer, E. J., (2002), Lipoproteins, nutrition, and heart disease. Am. J. Clin. Nutr., 75, 191-212.
Schaeffer, L.; Gohlke, H.; Müller, M.; Heid, I.M.; Palmer, L.J.; Kompauer, I; Demmelmair, H.; Illig, T.; Koleyzko, B. and Heinrich, J. (2006), Common genetic variants of the FADS1 FADS2 gene cluster and their reconstructed haplotypes are associated with the fatty acid composition in phospholipids. Hum. Mol. Gen., 15, 1745–1756.
Simopoulos, A. P., (2002), Omega-3 fatty acids in wild plants, nuts and seeds. Asia Pacific J. Clin. Nutr., 11(S2), S163-S173.
Simopoulos, A. P., (2004), Omega-6/omega-3 essential fatty acid ratio and chronic diseases. Food Rev. Inter., 20, 77-90.
Simopoulos, A. P., Leaf, A., Salem, N., (1999), Essentiality and recommended dietary intakes for omega-6 and omega-3 fatty acids. Ann. Nutr. Metabol., 43, 127-130.
StatSoft, Statistica 7.0 Software (2005), Tucksa; StatSoft.
Surette, M.E. (2008), The science behind dietary omega-3 fatty acids. Can. Med. Assoc. J., 178,
177-180.
Tonial, I.B.; Stevanato, F.B.; Matsushita, M.; de Souza, N.E.; Furuya, W.M.; Visentainer, J.V. (2009), Optimization of flaxseed oil feed time length in adult Nile tilapia (Oreochromis niloticus) as a function of muscle omega-3 fatty acids composition. Aquacult. Nutr. 15, 564-568.
Vancassel, S.; Blondeau, C.; Lallemand, S.; Cador, M.; Linard, A.; Lavialle, M. and, Dellu-Hagedorn, F. (2007), Hyperactivity in the rat is associated with spontaneous low level of n−3 polyunsaturated fatty
acids in the frontal córtex. Behav. Brain Res., 180,
119–126.
Visentainer, J.V.; de Souza, N.E.; Makoto, M.; Hayashi, C. and Franco, M.R.B. (2005), Influence of diets enriched with flaxseed oil on the α-linolenic, eicosapentaenoic and docosahexaenoic fatty acid in Nile tilapia (Oreochromis niloticus). Food Chem., 90, 557–560.