The impact of the Chinese exchange policy
on foreign trade with the European Union
O impacto da política cambial chinesa no
comércio exterior com a União Europeia
ANA CARDOSO ANTÓNIO PORTUGAL DUARTE*g
RESUMO: O objetivo deste artigo é analisar o impacto da política cambial chinesa sobre o comércio exterior com a União Europeia. Depois de descrever a importância da taxa de câmbio em uma economia aberta e algumas das metodologias empregadas para calcular seu valor de equilíbrio, examinamos se a competitividade chinesa se deve à existência de desalinhamento de sua taxa de câmbio, ou melhor, a outras fontes de competitividade. Para isso, utilizamos um modelo de Vetor de Correção de Erro (VEC) para estimar uma equação de exportações de longo prazo. Os resultados empíricos indicam que, nos últimos anos, as exportações chinesas se beneiciaram de uma vantagem competitiva “injusta” resultante da manipulação do seu valor cambial.
PALAVRAS-CHAVE: Competitividade; China; União Europeia; comércio exterior; desalinha-mentos; taxa de câmbio real.
ABSTRACT: The aim of this paper is to analyze the impact of the Chinese foreign exchange policy on foreign trade with the European Union. After describing the importance of the exchange rate in an open economy and some of the methodologies employed to calculate its equilibrium value, we examine whether the Chinese competitiveness is due to the exis-tence of misalignment (undervaluation) of its exchange rate, or rather, to other sources of competitiveness. For this purpose, we use a Vector Error Correction (VEC) model to esti-mate a long-run exports equation. The empirical results indicate that over the past few years, Chinese exports have beneited from an “unfair” competitive advantage resulting from the manipulation of its currency value.
KEywORDS: Competitiveness; China; European Union; foreign trade; misalignments; real exchange rate.
JEL Classification: C39; F10; O24.
Brazilian Journal of Political Economy, vol. 37, nº 4 (149), pp. 870-893, October-December/2017
* GEMF (Grupo de Estudos Monetários e Financeiros), CeBER (Centre for Business and Economics Research), and Faculty of Economics, Universidade de Coimbra, e-mails: ana_cardoso_20@hotmail.com and portugal@fe.uc.pt. Submitted 7/July/2016; Approved: 22/January/2017.
INTRODUCTION
In recent years, the Chinese economy has been characterized by a strong and
rapid growth, a fact that has caught the attention of many authors1. Likewise, the
extraordinary increase in the competitiveness of Chinese enterprises and the high revenues from foreign investment have given way to numerous debates all over the world, in particular on the issue of the “opportunity or threat” raised by the
eco-nomic upswing of China2.
This growth of the Chinese economy is mainly the result of an increase in exports. In this sense, there are many authors who point out the low value (under-valuation) of the yuan/Renminbi (RMB) exchange rate, relative to its equilibrium
value3, as being the responsible factor for this increase4. But, while Chinese
com-petitiveness is not just a matter of currency undervaluation and low labor costs, it is a fact that this policy represents a huge stimulus to the growth of its exports, by making them cheaper than they would be if the exchange rate were flexible and Chinese currency appreciated. This option of the Chinese authorities for maintain-ing the currency’s value below its equilibrium value has been a growmaintain-ing concern within the international community. Although the amount of RMB undervaluation is not unanimous, it is certain that this misalignment of the exchange rate results in a distortion of the economic fundamentals, exerting an adverse effect on the economic structure and on the macroeconomic performance of the world economy. In these circumstances, the issue of undervaluation of the Chinese currency has been the subject of numerous controversies in many countries, in particular with regard to how it reflects upon international trade. In the specific case of the Euro-pean Union (EU), on one side, Chinese exports, with increasingly technological con-tent, compete directly with the goods in which the EU has a comparative advantage, and on the other side, several European governments and political leaders argue about the need for greater cooperation between the EU and China, as a precondition for a better balance in the International Monetary System’s functioning.
The present work has as its main objective, to give an answer to a set of issues relating to the impact of the Chinese exchange policy on foreign trade with the European Union.
Apart from the introduction, the work is structured in five sections. In second section a characterization of the Chinese exchange policy is provided. In third sec-tion, we analyze China’s integration into world trade. Fourth section analyzes the
1See, for example, Martins (2005), Rodrik (2006) and Assche et al. (2008).
2 See Pereira (2006).
3 A situation usually known in economic literature as exchange rate misalignment. In general, the
exchange rate misalignment is defined as the difference between the observed Real Exchange Rate (RER) and estimated RER. In other words, the exchange rate misalignment measures how much the exchange rate deviates from the long-term equilibrium rate. See, for example, Cline and williamson (2011).
effects of an RMB appreciation on foreign trade with the European Union, and finally, the fifth section concludes the work.
CHINESE FOREIGN EXCHANGE POLICy
In recent years, the Chinese exchange policy has undergone several transforma-tions. Figure 1 shows the evolution of the nominal exchange rate (RMB/USD) over the period between 1980 and 2011.
Figure 1: Nominal Exchange Rate (RMB/USD) – annual average
0.000000 1.000000 2.000000 3.000000 4.000000 5.000000 6.000000 7.000000 8.000000 9.000000 10.000000
1980 1981 1982 1983 1984 1985 1986 1987 1988 1989 1990 1991 1992 1993 1994 1995 1996 1997 1998 1999 2000 2001 2002 2003 2004 2005 2006 2007 2008 2009
Source: Authors’ compilation based on data from the OECD.
The analysis of Figure 1 shows that since 1994 there has been a reversal of the nominal exchange rate depreciation trend that prevailed in the period 1980-1993. However, it should be noted that the RMB appreciation was not as significant as the depreciation observed during the first years of reforms implementation in the Chinese economy.
In the late 1970s, a centralized mechanism to control the exchange rate prevailed. However, as the economy advanced through the process of reforms, so too did the
exchange rate regime evolve to become a dual system5. In 1985, the exchange rate
system was unified, and between 1986 and 1994, a regime of managed float with a narrow band was in force. In 1994, China decided to index the value of its currency to the US dollar (USD). However, with the outbreak of the Asian crisis in 1997, the Chinese monetary authorities decided to fix the exchange rate against the dollar – 8.28 Renminbi per US dollar — a decision that remained until July 2005.
On this date, partially giving in to international pressure, the People’s Bank of China (PBoC) allowed an appreciation of the Renminbi against the US dollar of about 2% and announced that the country would adopt a system of managed float
5The official exchange rates were two: one related to non-commercial transactions and the other
for its currency, based on a basket of currencies. with this decision, it introduced the possibility of greater flexibility in the relationship between the Chinese cur-rency and the main currencies of the world economy. Nevertheless, this measure resulted from strong external pressure, especially from the United States and the
European Union6, both arguing that the maintenance of a fixed and artificially
undervalued exchange rate has a negative impact on the competitiveness of North American and European exports. Clearly, the increase in external pressures was at the origin of the changes observed in the conduct of the Chinese exchange policy, but there were also particular concerns about domestic inflation. Nevertheless, the fact that a very low exchange rate benefits only the production of low-cost goods, which technological content and profit margins are reduced, also had an important role in the decision of greater exchange flexibilization.
In these circumstances it is not surprising that from 2005 to 2008, the Chinese currency appreciated by 18.6% in real effective terms and about by 16% against the dollar in nominal terms. However, the intensification of the financial crisis in the US once again led the Chinese monetary authorities to “freeze” the value of the Renminbi against the US dollar and, in July 2008, China decided to end the process that gradually allowed the assessment of its currency, seeking greater stability in an environment of great internationally uncertainty. This option fostered an apprecia-tion of the dollar and thus the RMB. In March 2009, the Renminbi’s real effective exchange rate was 25.8% above its level in June 2005. The flexibility of the ex-change rate at the beginning of the financial crisis, in April 2009, and the subse-quent unroll of the “safe-haven effect” which led to a weakening of the dollar and thus the RMB. In late 2009, the Renminbi’s real effective exchange rate retreated,
standing 17% above its level in June 20057.
However, the surplus in the current account and a fixed exchange rate against the US dollar (6.83 RMB/USD) again placed China at the center of a debate about
its effects in the worsening of global imbalances8. In July 2010, on preparing for
the G-20 in Toronto, China announced its intention to end the stiffness of the Renminbi’s value, particularly against the US dollar to allow the country to con-tribute towards reducing national and international imbalances. This option of the Chinese government, was consistent with its long-term strategy and demonstrated a concern to avoid conflicts, as it recognized that the surplus in the current account and in the capital account may worsen the imbalances in international trade, and potentially cause political reprisals over the country.
In general, the Chinese exchange rate policy, by exercising tight control over the exchange rate, has had the main objective of increasing the export capacity of the country. There are, however, other factors pushing Chinese policymakers to
6Beyond these, Russia, Brazil and India as well as the IMF, also played a crucial role in the decision
of the Chinese monetary authorities.
7 See Cline (2010).
take greater control of its exchange rate. These are the desire to maintain internal and regional macroeconomic stability and to avoid inflationary pressures, and the desire to promote a gradual adjustment of industrial structure. This development strategy based on the export sector is founded on a careful analysis of how other industrialized nations (especially Japan, South Korea, and Taiwan) have become enriched. In the early stages of their development, these countries resorted to favor-able export policies to promote domestic industry and to hasten the acquisition of technology.
However, the exchange rigidity observed for several years in China has been repeatedly cited as one of the responsible factors for the continuous deterioration
of some economic and financial imbalances in the world9. Note that in the context
of a gradual evolution and severe control of the money value, the reflection in export prices as the overall impact on regional trade and capital flows, is minimal. Hence, the United States and the European Union consistently call for a flexible exchange system in China, the immediate consequence of which would be the ap-preciation of the RMB.
The question of the Chinese currency appreciation, the result of a more flexible exchange rate, has generated numerous controversies regarding its impacts. while some authors argue that the appreciation brings benefits, others reject this
sugges-tion10.
In this context, the basic question that arises, and that has been an issue of concern in the context of global macroeconomic imbalances, is to know if the Chinese currency is undervalued and if so, in what amount. In other words, it is necessary to determine whether China has an “unfair” export advantage.
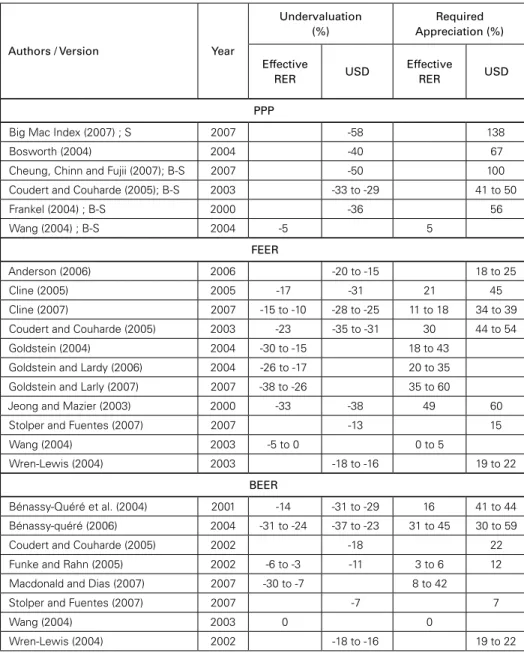
However, empirical studies that have sought to define a level of “equilibrium” as a means of enlightening the subject under discussion, have simply generated more controversy since they have produced very different results, even when using the same methodology to determine the Real Equilibrium Exchange Rate (REER). In Table 1 we highlight some of the studies produced in this area and their estimates of the degree of Chinese currency misalignment against the real effective equilibrium exchange rate and the real bilateral equilibrium exchange rate (against
the dollar)11.
9See, for example, Ferry and Darvas (2010).
10 It is not our intention to deepen these differences, so a more detailed analysis regarding the risks
involved in a possible appreciation of the Renminbi may be found, for example, in Ligang (2004), Tung and Baker (2004), Roubini and Setser (2005), Sun and Ma (2005) and Frankel (2005).
11 In general, estimates of the REER are based on the following approaches: Purchasing Power Parity
Table 1: Estimates of Undervaluation and Required Appreciation of Renminbi
Authors / Version Year
Undervaluation (%)
Required Appreciation (%)
Effective
RER USD
Effective
RER USD
PPP
Big Mac Index (2007) ; S 2007 -58 138
Bosworth (2004) 2004 -40 67
Cheung, Chinn and Fujii (2007); B-S 2007 -50 100
Coudert and Couharde (2005); B-S 2003 -33 to -29 41 to 50
Frankel (2004) ; B-S 2000 -36 56
Wang (2004) ; B-S 2004 -5 5
FEER
Anderson (2006) 2006 -20 to -15 18 to 25
Cline (2005) 2005 -17 -31 21 45
Cline (2007) 2007 -15 to -10 -28 to -25 11 to 18 34 to 39
Coudert and Couharde (2005) 2003 -23 -35 to -31 30 44 to 54
Goldstein (2004) 2004 -30 to -15 18 to 43
Goldstein and Lardy (2006) 2004 -26 to -17 20 to 35
Goldstein and Larly (2007) 2007 -38 to -26 35 to 60
Jeong and Mazier (2003) 2000 -33 -38 49 60
Stolper and Fuentes (2007) 2007 -13 15
Wang (2004) 2003 -5 to 0 0 to 5
Wren-Lewis (2004) 2003 -18 to -16 19 to 22
BEER
Bénassy-Quéré et al. (2004) 2001 -14 -31 to -29 16 41 to 44
Bénassy-quéré (2006) 2004 -31 to -24 -37 to -23 31 to 45 30 to 59
Coudert and Couharde (2005) 2002 -18 22
Funke and Rahn (2005) 2002 -6 to -3 -11 3 to 6 12
Macdonald and Dias (2007) 2007 -30 to -7 8 to 42
Stolper and Fuentes (2007) 2007 -7 7
Wang (2004) 2003 0 0
Wren-Lewis (2004) 2002 -18 to -16 19 to 22
Note: PPP: Purchasing Power parity; FEER: Fundamental Equilibrium Exchange Rate; BEER: Behavioral Equilibrium Exchange Rate; B-S: With Balassa-Samuelson effect; S: simple; RER: Real Exchange Rate. The minus sign (-) indi-cates undervaluation. The estimates presented are not exhaustive and should only be indicative. For an undervalu-ation of X%, the appreciundervalu-ation needed to achieve the balance value is 100[1/(1-0.01X)-1].
Source: Adapted from Bouveret et al. (2006), Siregar and Rajan (2006) and Cline and Williamson (2007).
value, i.e., undervalued. On average12, the Chinese currency is undervalued by 20%
against the dollar and 27% when compared to the real effective exchange rate. As we have seen, there is no definitive model. Each one has its strengths and its limitations, so the results may vary according to the methodology used. There-fore, it would clearly be dangerous and fallacious to draw conclusions from esti-mates resulting from the application of a single model.
Another problem that arises is the applicability of the methodologies above- mentioned as measures of the degree of Chinese exchange rate misalignment. Bou-veret et al. (2006) show that such models are not suitable for economies with levels of development as disparate as China, and the US – FEER and BEER models as-sume an economy in full employment, an assumption that does not hold true in the Chinese economy. The authors add that China is a developing economy, so it has additional investment needs. Thus, the maintenance of an exchange rate at a level below its equilibrium level may be appropriate for the pursuit of its objectives. In other words, according to the authors, when compared to the Government’s objec-tives, the Chinese exchange rate is in equilibrium.
In these circumstances, it is important to understand how China has managed to become integrated in world trade. without such analysis, it would be hard to understand the behavior of the Chinese currency and the way its exchange policy has been conducted over the last years.
THE INTEGRATION OF CHINA INTO THE wORLD TRADE
In its relatively recent history, China has experienced traumatic times, from foreign occupation in the late nineteenth century until the Communist Revolution in 1947. However, over the last quarter of a century, China has gradually stabilized and gained a strong position in international trade. In recent years, this growth has become more pronounced.
when compared with other emerging and developing economies, the Chinese economy particularly stands out in relation to the high growth rates observed in the post-reform period, and in relation to the rapid integration into international trade.
In 1978, two years after the death of Mao Tsé-Tung, Deng Xiaoping assumed leadership of the Chinese Communist Party and formulated a reform and moderniza-tion policy. This process of socio-economic reforms involved the diversificamoderniza-tion of property forms, and promoted a more decentralized and market-oriented economy. At the same time, there was foreign trade liberalization, and conditions to boost the Foreign Direct Investment (FDI) were created. The reform process culminated with China’s accession to the world Trade Organization (wTO) in December 2001.
Although controversial, due to its historical economic isolation, China’s acces-sion to the wTO marks an important milestone on the path of reform that this
country has followed over the past years. If China can increase its international market share, its consumers and producers have their needs met in more favorable terms. The accession to the wTO also allowed a structural shift in the Chinese economy, bringing it the opportunity to modernize technologically. Another advan-tage, and not the least important one is the fact that China can actively participate in the implementation of wTO rules, which traditionally penalized trade exchang-es with that country.
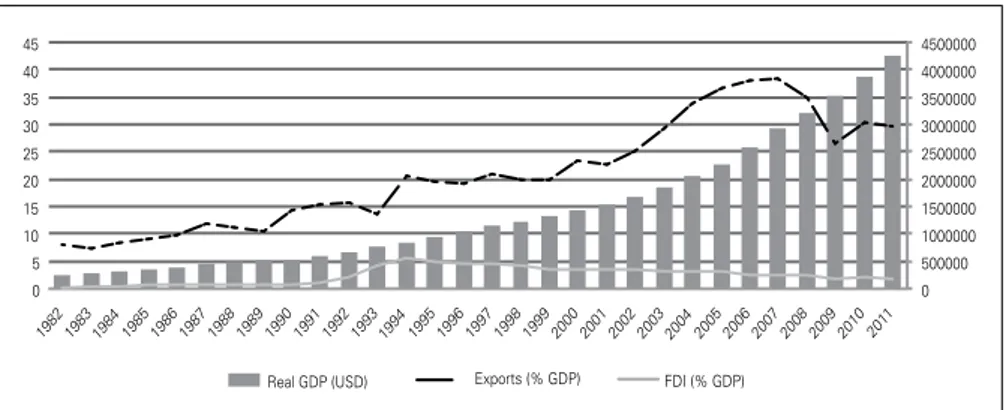
China’s accession to the wTO has been reflected in high rates of growth of real GDP, accompanied by an even more significant growth in foreign trade and in investment. Figure 2 illustrates such performance of the Chinese economy.
Figure 2: Chinese Real GDP and Percentage of Exports and FDI in Chinese GDP
0
500000 1000000 1500000 2000000 2500000 3000000 3500000 4000000 4500000
0 5 10 15 20 25 30 35 40 45
1982 1983 1984 1985 1986 1987 1988 1989 1990 1991 1992 1993 1994 1995 1996 1997 1998 1999 2000 2001 2002 2003 2004 2005 2006 2007 2008 2009 2010 201 1
Real GDP (USD) Exports (% GDP) FDI (% GDP)
Source: Authors’ figure based on data from UNCTAD.
As can be seen, China’s GDP features a surprising growth trajectory, although its behavior was quite erratic between the beginning of the 1980s and 1990s as a consequence of the political, economic, and social transformations through which the Chinese economy had passed, as seen earlier. After the policy instruments were consolidated and the reforms implemented, the growth trajectory was seen to ac-quire a more stable character. Periods of greater deceleration are associated with international episodes and not with internal reasons. These international episodes are the Asian crisis of 1997-1998 and the financial crisis of 2007. This exceptional performance of China’s GDP was led either by investment rates, and/or export growth.
Regarding investment, a very selective and target sector oriented policy was in
force13, with the intention of attracting FDI.
Figure 2 shows that by the end of the 1980s, the entry of FDI in China had rather modest values. However, from the beginning of the 1990s, a significant
crease in capital inflows in the form of FDI is noticed. One of the goals of China’s policy being to modernize its economy, its strategy aimed to attract multinational companies with the objective of improving the nation’s technological knowledge and subsequently strengthening Chinese companies and industries.
Hence, to allow foreign companies to operate in its territory and enjoy the Chinese market, the country established requirements such as the establishment of Joint Ventures and the realization of research and development (R&D) locally. The FDI allowed it to acquire new knowledge and management and production techniques. In recent years, there has been a decreasing trend in the evolution of this type of investment, standing at values much higher than those seen in the early 1980s.
As regards to exports, these also showed very significant growth. when we analyze the exports share of Chinese GDP, we observe that in the early 1980s this only represented about 8% of GDP but, in the middle of 2006, the ratio reached a peak of almost 40%. A relevant fact is that between 1992 and 2005, Chinese ex-ports grew at an annualized rate of 18%, more than double the world exex-ports
growth rate14. This strong export performance was the result of trade policies and
“appropriate” exchange rates, of FDI, of the increase in imports of capital goods, and of greater efficiency in manufacturing industries.
However, it should be noted that most of the Chinese export growth can be attributed to foreign companies who have outsourced their production to the
Chi-nese territory and/or ChiChi-nese companies that have received foreign investment15.
The country has become a mounting center (given the amount of cheap and low skilled labor) and a platform for the export of finished products. This has resulted in a considerable increase of the intra-regional trade flow, with China importing increasing volumes of semi-processed goods from other Asian countries and export-ing finished products to the developed nations, especially to the US and European Union countries.
The growth strategy led by exports resulted in a growing accumulation of foreign exchange reserves. In fact, to maintain the exchange rate at an “acceptable” level for its growth strategy and to prevent currency appreciation, the Chinese
monetary authorities act repeatedly on the currency market16, selling bonds in
which the yield market has been falling, to avoid an increase in the monetary base and the consequent inflation. Figure 3 documents the evolution of the current ac-count balance and of exchange reserves in the period 1980-2011.
14See Assche et al. (2008).
15 The rapid growth of companies that operate in foreign trade and the strategy of countries like Japan,
South Korea and Taiwan (“Flying-Geese Model”), of transforming the Chinese territory in a mounting platform for the western markets have served as the main causes of changes in the trade between the countries of Asia-Pacific region, the US, and the European Union.
Figure 3: Current Account balance (% of GDP) and Foreign Exchange Reserves
-6 -4 -2 0 2 4 6 8 10 12
1980 1985 1990 1995 2000 2005 2010
0 500000 1000000 1500000 2000000 2500000 3000000 3500000
1980 1981 1982 1983 1984 1985 1986 1987 1988 1989 1990 1991 1992 1993 1994 1995 1996 1997 1998 1999 2000 2001 2002 2003 2004 2005 2006 2007 2008 2009 2010 201 1
% GD
P
USD Millions
Exchange Reserves (USD Millions) Current Transactions/GDP
Source: Authors’ figure based on data from UNCTAD.
The exchange reserves accumulation resulted from surpluses in the current account, from the capture of large amounts of FDI, and from net capital inflows (excluding FDI). Until 2000, the surplus in the current account and the FDI have been offset by net outflows of capital, which allowed the exchange reserves values to remain stable. However, at the end of 2003, China’s foreign reserves, arising from foreign trade and capital flows grew sharply. According to data from UNCTAD, during this period, exchange reserves represented more than twelve months of imports. In 2009, they reached a high enough value to ensure more than 28 months of purchases abroad.
Prasad and wei (2005) argue that the growing accumulation of exchange re-serves by China, is not exclusively related to the trade surplus and FDI inflows, but to expectations of a Renminbi appreciation. In other words, the increasing external pressure for a more flexible exchange rate regime in this country is a stimulus to short-term capital inflows by investors who aspire to make gains with the change of the exchange rate.
In view of what has been presented here, and recalling that the object of this work is to consider China’s foreign trade with the European Union 15 (EU15), it becomes relevant to conduct a more detailed analysis of the evolution of China’s foreign trade, with special emphasis on trade flows between the region and the EU15. In fact, China’s integration in world trade has been accompanied by a change in the composition of its exports.
At the beginning of the opening of China’s economy to the outside world, Chinese exports were characterized by labor-intensive products and low technological content. At this stage, the country had favorable conditions, such as the existence of an abundant
and cheap labor force, fact which allowed a strong comparative advantage in the pro-duction and assembly of goods where the cost of labor is crucial.
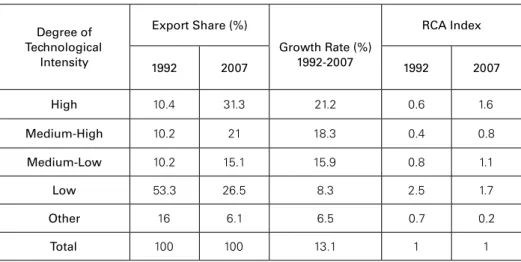
Table 2: China Exports by Degree of Technological Intensity
Degree of Technological
Intensity
Export Share (%)
Growth Rate (%) 1992-2007
RCA Index
1992 2007 1992 2007
High 10.4 31.3 21.2 0.6 1.6
Medium-High 10.2 21 18.3 0.4 0.8
Medium-Low 10.2 15.1 15.9 0.8 1.1
Low 53.3 26.5 8.3 2.5 1.7
Other 16 6.1 6.5 0.7 0.2
Total 100 100 13.1 1 1
Note: The RCA Index refers to the index of Revealed Comparative Advantage. Source: Adapted from Ma and Assche (2011).
In 1992, “High Tech” products represented about 10% of Chinese exports, but in 2007 they represented about 31%. Inversely, “Low Tech” products, which are intensive in labor force and natural resources, reduced their share from about 50% to 27%, during the same period. As can be seen, the growth of Chinese exports is largely fueled by the exports growth in the two technologically higher categories. According to Rodrik (2006), today China has an export tariff compatible with a
country with per capita income much higher than its own.
In Table 3 the distribution of Chinese exports, in the world and in the EU15,
disaggregated by SITC17, is shown.
Table 3: Chinese Exports (%) by SITC (1995-2011)
SITC World 95/01 02/11 UE15(a) 95/01 02/11
0: Food and Live Animals 3.09 4.80 2.75 1.82 2.85 1.71
1: Drinks and Tobacco 0.18 0.33 0.14 0.09 0.18 0.08
2: Crude materials, inedible,
except fuels 0.97 1.57 0.82 0.96 2.31 0.83
3: Mineral fuels, lubricants and
rela-ted materials 2.08 3.16 1.93 0.83 1.25 0.78
17Standard International Trade Classification. Product classification often used to classify imports and
4: Animal and vegetable oils,
grease and waxes 0.05 0.04 0.03 0.03 0.05 0.02
5: Chemicals and related products 5.26 5.02 5.24 4.68 6.83 4.46
6: Final manufactured products 17.04 16.47 16.92 15.99 16.80 15.90
7: Machines and transport equipment 45.07 35.66 47.22 47.24 35.26 48.49
8: Intermediate manufactured
pro-ducts 26.11 32.74 24.79 28.33 34.39 27.69
Note: (a) Except for Luxembourg due to missing data; the SITC9 is also not considered due to missing data for Sweden; consider the values an approximation, due to missing data for some countries in some categories or years. Source: Authors’ compilation based on data from UNCTAD.
Given the importance of China’s accession to the wTO, represented in the trade figures of this country, we consider two sub-periods of analysis, trying to capture differences in the composition of exports, before and after the country’s
accession18.
As can be seen, between 1995 and 2001, most significant exports to the EU15 occurred in SITC 5, 6, 7 and 8. From 2002 to 2011, a rise in exports of SITC 7, verifying a decrease in performance of SITC 5, 6 and 8, occurred. In turn, Chinese exports by SITC to the world present a behavior similar to that seen for the EU15. It is thus apparent that the most exported commodity chains from China, either to the EU15 or the world, are the same for both zones (from SITC 5 to SITC 8 repre-senting processed products).
By way of conclusion it can be said that the growing economic importance of China seems to increasingly represent a threat to the EU15 trade flows, seen in the extent to which Chinese products are gradually climbing up the value chain. The penetration of high technological products from China into the major economies is synonymous with the fact that the EU15 has been losing its comparative advan-tage to China in the production of these goods.
In this context, it is important to analyze to what degree this gain in eco-nomic importance by China can be explained by the move to retain the undervalu-ation of its currency, and to what extent an eventual appreciundervalu-ation may negatively reflect on Chinese exports, but in return, contribute to a better balance in world trade, and specifically, in trade with the EU. It is precisely this analysis that we propose to present in the following sections.
18Since China only joined the wTO in December 2001, for the purposes of our analysis, it is considered
EFFECTS OF AN APPRECIATION OF THE RENMINBI ON CHINA’S EXPORTS TO THE EU
In a context of growing global imbalances and increasingly intense pressure by the industrialized countries for greater flexibility in the Chinese exchange rate, the question that arises is whether China should allow an appreciation of its cur-rency, providing a tool that allows it to reduce its huge trade surplus, thus contrib-uting to a better balance in international trade relations. The answer to this ques-tion is very dependent upon the effects that a real appreciaques-tion of the Renminbi may have on exports and imports.
In the face of this reality, section empirically analyzes the effects of an appre-ciation of the Renminbi’s real exchange rate against the Euro in the
macroeco-nomic performance of the EU-15 countries (EU15*)19.
To determine the Chinese exports’ sensitivity to changes in Renminbi’s RER, we estimate the price elasticity of export value. For this type of analysis, we take as a general empirical outline, an export equation developed by yue and Hua (2002), thus seeking to ascertain to what extent the increasing export capacity of China can be explained by the maintenance of the Renminbi’s real exchange rate at a level much lower than its equilibrium value (undervalued).
To test econometrically whether the comparative advantage explains the rapid growth of Chinese exports, yue and Hua (2002) proceeded to the estimation of a reduced equation for exports, obtained through a demand equation and a supply equation, to which they added three indices of Revealed Comparative Advantage (RCA) for the categories of processed products, since these are the main constituents of trade between China and the world. Featured within this equation are: indices of Revealed Comparative Advantage from SITC 5 to 7, the Real Effective Exchange Rate, a measure of foreign demand, and a measure of productive capacity.
However, in this work, we only intend to analyze trade flows between China and the EU15*. Therefore, we fit the variables to the data available for these two Groups of countries, and since the most relevant product categories are those relat-ing to processed products, the same indices of RCA are maintained. Hence, the equation to estimate will take the following form:
lnVX RER GDP GDP RCA
t t t
Ch
t EU
=α =α +α +α
1ln 2ln 3ln 4 5tt+α5RCA68t+α6RCA7t+ε7 (1)
where, lnVXrepresents the Real Exports Value logarithm of processed
prod-ucts from China to EU15*; lnRERrepresents the Renminbi’s Real Exchange Rate
logarithm against the Euro, being RER = NER x (Pe/P)TCR = TCN x (Pe/P)20;
19 EU15*: European Union 15, excluding Denmark, Sweden and the UK, which are countries that
although belonging to the European Union, continue to maintain their own currency, not using the Euro, so if considered in the real Exchange rate of RMB/USD would “distort” the results.
lnGDPChInPIBCh represents the Chinese Gross Domestic Product logarithm; InGDPEU
represents the EU15* Gross Domestic Product logarithm; and RCAjrepresents the
Revealed Comparative Advantage of China in relation to EU15*, for the product
category j, with j = 5, 7 and 6821.
Based on economic theory, it is expected that the price elasticity of exports is positive, i.e., an increase in the real exchange rate should lead to an increase in Chi-nese competitiveness, which in turn will result in increased exports by this country
(a1 > 0). Taking China’s real GDP as a measure of the ability of this region to produce
for the foreign market, it is expected that an increase in this variable implies an
in-crease in the supply of exports (a2 > 0). with regard to the EU15* real GDP, taking
this as a proxy for processed products foreign demand, it is expected that an increase
in EU15* real income has a positive impact on exports (a3 > 0). Finally, regarding the
Revealed Comparative Advantages indices, an increase in processed products exports resulting from the fact that China takes its Revealed Comparative Advantages is expected, and therefore, an increase in RCA5VCR5, RCA68 and RCA7 should
pos-itively contribute to the growth of exports (a4, a5, a6, > 0).
Data
A major difficulty of working with economic data relating to China is its lack of availability, since most series of interest are not freely accessible, and those that are cover limited time periods (and frequency). In this work, quarterly data
cover-ing the period from 1995q1 to 2011q4 are used22, corresponding to the time
during which the issue of the undervaluation of the Chinese currency was more pronounced, as can be deduced from the literature review.
However, in 1995, China was still a centrally planned economy, and it does not, therefore, make a great deal of sense, given the focus of our study, to start before this year. In fact, it is only from this date that the reforms aiming to generate a “market socialism” to transform China into a modern, prosperous, powerful, democratic, civilized and harmonious socialist country, fulfilling the Chinese dream of great
re-juvenation of the Chinese nation took place23. Some of these reforms are especially
relevant to the object of this work. The two exchange rate systems were unified, the required planning for imports was eliminated, the private sector benefited from a new company law, and the RMB began to be convertible on current account.
The EU15* real GDP represents the difference between the EU15 real GDP and the sum of the real GDPs of the three countries that were excluded from the
Price Index of China. In its turn, NER corresponds to the Renminbi’s Nominal Exchange Rate against the Euro, measured at uncertain to China.
21 SITC 68 corresponds to the junction of SITC 6 and SITC 8.
22 Data have quarterly frequency because the GDPs are not available in a monthly frequency, and from
1995q1 because the data series used for calculating RCAs indices do not exist for earlier periods.
analysis. Before this operation, the nominal GDP was deflated by the price index (GDP deflator), and it was possible to subtract the GDPs of the three countries by converting into Euros. China’s real GDP was only converted into Renminbis.
In the calculation of the real exchange rate, data from the EU15* Consumer Price Index and China’s Consumer Price Index were used. The Nominal Exchange Rate RMB/EUR resulted from a cross of nominal exchange rates against the dollar. The data concerning the exports of processed products results from the differ-ence between the sum of the values of SITC 5, 6, 7 and 8 exports from China to EU15, and the sum of the values of exports from China to Sweden, to Denmark and to the United Kingdom, on these same SITCs. The data were subsequently converted into Renminbis and deflated by the Chinese Consumer Price Index.
Finally, the data used for the Revealed Comparative Advantages in sectors 5, 7 and 68 resulted from applying the following formula:
RCA X
X M
M ij
it
ij
it
= (2)
where, i = China and j = SITC 5, 6, 7 and 8, Xij represents the product j exports
value from China to EU15*; Xit represents the total of exports from China to
EU15*; Mij represents the produt j imports value of China from EU15* and Mit
represents the total of imports Chinese imports from the EU15*. Again, from the total of EU15 we subtract corresponding values for Sweden, Denmark, and the UK. with regard to exports of processed products, these correspond to the sum of SITC 5, 6, 7 and 8 exports value from China to EU15*, divided by the Chinese Consumer Price Index.
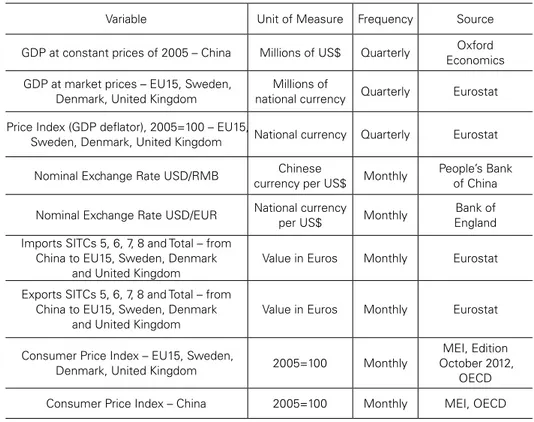
Sources and descriptions of the variables used in this study are attached in Appendix (Table A).
All variables were seasonally adjusted by applying the X-12 ARIMA filter, and the variables Actual Value of Exports of processed products, Real Exchange Rate, Chinese GDP and EU15* GDP, were transformed into logarithms, according to yue and Hua (2002). The estimation results of equation exports were obtained using the program Gnu Regression Econometrics and Time-series Library (GRETL).
Methodology and Results
when using time series to obtain statistical inferences, the inherent stochastic process should be taken into account in order to avoid the problem of spurious
regression24. Thus, the first step in data processing is to determine whether the series
24The presence of unit root leads to biased results, invalidating the assumptions that the mean and
are stationary or not. A series is weakly stationary when its mean and variance remain constant over time and the covariance between two time periods only de-pends on the distance (or gap) between the two periods, and not on the effective time period in which the covariance is determined. In this case, the time series is said to be an integrated zero-order – I(0). Inversely, when any temporary shock becomes permanent, it is said that the series has a unit root, i.e., is non-stationary, being also known as an integrated process with d-order – I(d) – where d is the number of times that the original series should be differentiated in order to become a I(0) process.
In this work, to test the order of series integration, we used the Dickey-Fuller
(ADF)25 unit root test. This test has as a null hypothesis the presence of unit root
in time series, and as an alternative hypothesis, its stationarity. The inclusion (or exclusion) of a constant and/or trend in the test depends on the behavior of the series, being the maximum number of lags chosen according to the frequency of the data. The results of this test are summarized in Table 4.
Table 4: Augmented Dickey-Fuller (ADF) Unit Root Test
Variable C T Lag I(d) p-value Variable C I(d) p-value
l_GDP ch Yes Yes 1 I(1) 0.8403 ∆l_GDP ch Yes I(0) 5.361e-005
l_GDP EU Yes Yes 1 I(1) 0.8068 ∆l_GDP EU Yes I(0) 4.288e-005
l_RER Yes Yes 1 I(1) 0.3571 ∆l_RER Yes I(0) 2.549e-006
l_VX Yes Yes 2 I(1) 0.9419 ∆l_VX Yes I(0) 0.0112
RCA5 Yes Yes 3 I(1) 0.5856 ∆RCA5 Yes I(0) 1.604e-013
RCA7 Yes Yes 0 I(1) 0.9055 ∆RCA7 Yes I(0) 4.9e-011
RCA68 Yes Yes 1 I(1) 0.682 ∆RCA68 Yes I(0) 5.503e-013 Note: C: test with constant; T: test with trend; I(d): integration order; (∆): first difference of the series; Lag: number of lags required to overcome the autocorrelation of the errors. In the test to the variables in the first differences, we do not include a trend, because by differentiating the trend is diluted. All tests were performed at a significance level of 5%.
Source: Authors’ compilation based on data from the research.
As can be seen in Table 4, the results of the ADF test in respect of the level variables do not indicate the rejection of the null hypothesis, according to which the series contains a unit root, at a significance level of 5% (p-value greater than 0.05). Therefore, we conclude that none of the series is stationary in level, it then being necessary to differentiate them and conduct new tests to verify their order of integration. The results obtained by applying the ADF test to the variables in first
differences, indicate that they are stationary at a significance level of 5% (p-value less than 0.05).
Given that all series are non-stationary, but have the same order of integration — I(1) —, the next step is to see whether there is co-integration between the vari-ables. For this purpose, we adopted the Johansen method (1995), which uses the
test trace (trace l) and the value of the maximal eigenvalue (l max), to determine
the number of co-integrating vectors. In the trace test, the null hypothesis (H0) is
that there are at least r co-integrating vectors. In its turn, the test of l max. has as
a null hypothesis (H0) the existence of r co-integrating vectors and as an alternative
hypothesis (HA), that the number of co-integration vectors is equal to r+1.
In the co-integration test by the Johansen procedure, we use the variables in level and two lags. The number of lags was recommended by the information cri-teria AIC (Akaike Information Criterion). The results are shown in Table 5.
Table 5: Johanson Co-integration Tests
�trace �max
H0 HA p-value eigenvalue H0 HA p-value
r = 0 r > 0 0.0193 0.51843 r = 0 r = 1 0.0257
r ≤ 1 r > 1 0.2624 0.35690 r = 1 r = 2 0.4965
r ≤ 2 r > 2 0.4551 0.27112 r = 2 r = 3 0.6983
r ≤ 3 r > 3 0.5425 0.22500 r = 3 r = 4 0.6041
r ≤ 4 r > 4 0.6824 0.16224 r = 4 r = 5 0.5905
r ≤ 5 r > 5 0.8235 0.070549 r = 5 r = 6 0.7624
r ≤ 6 r > 6 0.9387 8.97e-005 r = 6 r = 7 0.9387
Source: Authors’ compilation based on data from the research.
The results of the co-integration tests presented indicate the existence of one co-integration vector. As can be seen, the null hypothesis of the trace test r = 0 was rejected at a significance level of 5% (p-value less than 0.05). For the assumption of at least one co-integration vector, the results of this test indicate the non-rejection of the null hypothesis at a significance level of 5% (p-value greater than 0.05). The
same can be observed for the test of the l max.
In the face of such results, the existence of a long-term relationship between the variables is assumed, and that imbalances in the short term exist. Thus, we
should use the Vector Error Correction model (VEC)26 for the estimates of the
long-term elasticities27.
26See Harris (1995).
A VEC model is similar to a VAR model28, but the first considers the inclusion
of an error correction vector in all equations, which, as its name indicates, aims to correct the co-integration relations. Estimating the regression according to the theoretical model, we obtain the results documented in Table 6.
Table 6: Long Run Estimation of Co-integration Equation (1995Q3 to 2011Q4)
Co-integration Equation
Beta Coefficient Standard Error t-statistic
l_VXt 1.0000 (0.00000)
l_GDPtCh -0.83161 (0.10954) -7.59184
l_GDPtEU -1.5398 (0.55677) -2.76559
l_RERt -1.0581 (0.077436) -13.66419
RCA68t -0.10923 (0.038797) -2.81542
RCA5t 0.62543 (0.18862) 3.31582
RCA7t -1.2301 (0.33784) -3.64107
Source: Authors’ compilation based on data from the research.
The results for the long-term equation indicate that the signals are correctly
specified (except for VCR529), showing a direct relationship between manufactured
exports and the exchange rate, the Chinese GDP, the European Union GDP, and the VCR68 and VCR7. In other words, a depreciation of 1% in the real exchange rate (and consequent increase of Chinese competitiveness) must produce, on aver-age, in the long run, an increase of 1.06% in the value of manufactured exports, ceteris paribus. This result is consistent with that obtained by yue and Hua (2002), which was taken as a reference. These authors also concluded that Chinese exports are more and more sensitive to exchange rate variations. An increase of 0.83% in Chinese exports should correspond to an increase of 1% in Chinese GDP, while an increase of 1% in EU GDP must correspond to an increase of 1.54% in manufac-tured exports. The Revealed Comparative Advantage indices highlight the fact that the coefficient of revealed comparative advantage, relative to the sector of Chemi-cals and Related products, is negative, contradicting the expected sign according
more interested in the last, since we would like to determine the permanent effect of the Renminbi’s real appreciation on the trade balance.
28 The Autoregressive Vector model (VAR) is a system of equations in which each variable is a function
of the present values of the remaining variables, of its values and of the values of remaining variables lagged in time, plus the error term.
to economic theory. However, the truth is that from among four considered sectors (SITC 5, 6, 7 and 8), this is the one in which China has a major disadvantage when compared to European Union. This is a trend that has been observed over the last 15 years and that does not seem to be able to reverse itself, at least in the near future. Therefore, it is understandable that an increase in the production of SITC5 goods does not represent an increase in manufacturing exports to the EU15*. with regard to the coefficient associated with the comparative advantage in the produc-tion of SITC7 goods, its signal is in line with what would be expected. when com-pared to the EU15*, China does not have a comparative advantage in the produc-tion of these goods. However, this may turn out to reverse itself, in so far as this disadvantage is becoming smaller. As we have seen, China has evolved technologi-cally and, being that its products are technology-intensive, it is natural that this is happening. Finally, with respect to SITC 68, there is an undeniable advantage for China in its ability to produce these labor-intensive goods.
The t-statistic analysis also allows us to conclude that all coefficients of the vector are significant, since at a level of significance of 5%, it is possible to reject
the null hypothesis that the coefficient is equal to zero30.
In addition to this model, we have also tested the hypothesis in other models. As a first attempt, we tried to estimate a similar equation, but instead of using data regarding the trade flows between China and the European Union, we used data relating to the trade flows between China and the world. From these data, it was found that the majority of variables were not stationary and there was no co-integration between them. In an estimation by the VAR model in first differ-ences the variable was not statistically significant, namely the effective RER, so the solution was to estimate an OLS model, also in first differences, in which, only the effective RER was shown to influence Chinese exports. Later, we de-cided to include the FDI as an explanatory variable, which afforded an improve-ment in the model, to the extent that the variable “d_l_worldGDP” became sig-nificant. However, these results were supported in too short a time period, between 1995 and 2009, with annual frequency. Another assay resulted in a new specification for the theoretical model, which dropped the RCAs, and the GDP of China and of the world, and allowed for the inclusion of a measure of foreign demand. The results of this method have not been fully satisfactory. The achieve-ment of results was only possible if we followed in full, the methodology ad-opted by Herrero and Koivu (2007). This methodology stemmed from a Johansen
co-integration test for an estimation according to the Engle-Granger method31,
which did not seem consistent. Anyway, the sign of the exchange rate in both as-says is in line with the signal presented here.
30The value of critical-t is 2, by what for values of | t
stat | > tcritc, we reject the null hypothesis of the
coefficient be equal to zero.
Correction of the Imbalance: A Short Essay
Returning the information displayed in Table 1, we build averages for values of necessary Renminbi appreciation against the US dollar, either by the approach for determining the REER, or taking a minimum and a maximum value of appre-ciation.
The approach based on PPP suggests a necessary appreciation of the
Ren-minbi against the US dollar of, on average, 67%32; the FEER estimated an average
of 37.4%, and in its turn, the BEER showed an average of 28%33. As can be seen,
the PPP is the approach that produces the highest estimates, while the values men-tioned in the FEER and BEER are not widely dispersed. Considering only the FEER and BEER approaches, given that the PPP has very high estimates, it was estimated that it would take a minimal appreciation of 28.15% and a maximum appreciation of 32.77%, for the imbalance of the Renminbi’s Real Exchange Rate to be cor-rected.
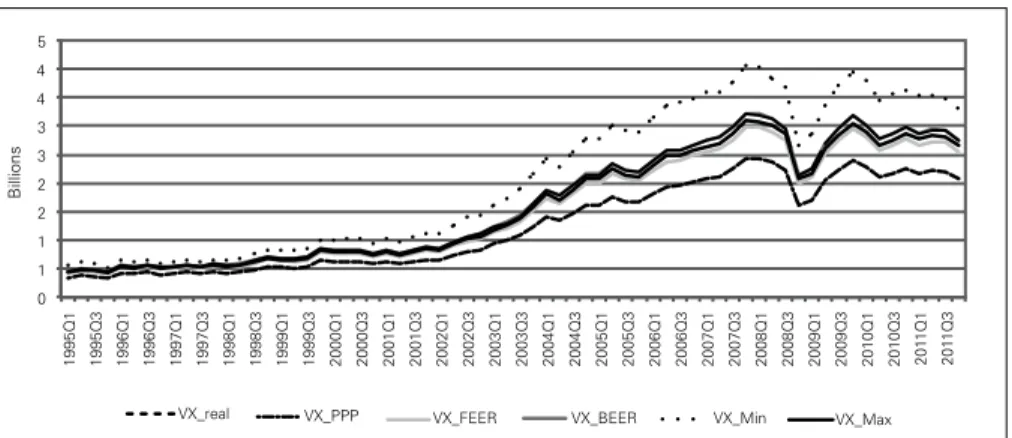
By crossing currency exchange rates, we obtained the corresponding values for the EU15*. In Figure 4 the values of processed products exports checked and cor-rected are given.
Figure 4: Real Exports Value of China by Type of Approach
0 1 1 2 2 3 3 4 4 5
1995Q1 1995Q3 1996Q1 1996Q3 1997Q1 1997Q3 1998Q1 1998Q3 1999Q1 1999Q3 2000Q1 2000Q3 2001Q1 2001Q3 2002Q1 2002Q3 2003Q1 2003Q3 2004Q1 2004Q3 2005Q1 2005Q3 2006Q1 2006Q3 2007Q1 2007Q3 2008Q1 2008Q3 2009Q1 2009Q3 2010Q1 2010Q3 20
11
Q1
20
11
Q3
Billions
VX_real VX_PPP VX_FEER VX_BEER VX_Min VX_Max
Source: Authors’ figure based on data from the research.
As can be seen, after an appreciation of the Renminbi’s real exchange rate against the Euro, exports of processed products from China to EU15* decrease significantly. If China appreciated its currency as suggested by the PPP approach,
32Even with the Balassa-Samuelson, the PPP approach provides rather high estimates for the percentage
of required correction. This value may reflect a bias introduced by the underestimation of the comparable goods international basket price in China.
33 These calculations have not considered either the Big Mac Index or the estimates produced by wang
their exports (in value) would be reduced, on average by 39%. According to the other two approaches, and the minimum and maximum values, this reduction would be around 20%.
This result reveals an “unfair” export advantage, which has negative impacts in terms of European Union macroeconomic performance. In other words, if China allowed greater flexibility of its currency so that its value was determined by the market, it is most likely that its surplus from trade between these two regions would decrease. This assertion is risky in the sense that, given the specificities of the Chi-nese market, the effects of an exchange rate appreciation on imports are somewhat
ambiguous34. If, on the one hand, economic theory postulates that currency
ap-preciation has negative impacts on a country’s imports, on the other hand, since China is a “factory” for re-export, it is natural that its imports retain a growth rate similar to that seen previously. This may provide an opportunity for the European Union countries. They should enjoy their comparative advantage in the production of intermediate goods, intensive in capital, and thus increase their exports to China.
CONCLUSION
As we have seen, the real Exchange rate plays an important role in the policy decisions of an open economy. The effects of exchange rate misalignment are di-verse and when they persist over time, they could generate sufficient negative im-pacts not only on the economy whose currency is over or undervalued, but also on other economies with which it relates directly or indirectly. In this sense, it is im-portant that the exchange rate remains at its equilibrium level.
The methods most commonly employed to estimate a real equilibrium ex-change rate derived from Purchasing Power Parity (PPP) and its extension to the Balassa-Samuelson effect, and from more elaborate models that are based on a set of key variables that influence the behavior of the real exchange rate, are namely the fundamental models (in the text referred to as the FEER) and the behavioral models (in the text referred to as the BEER) of the real exchange rate.
with regard to the Chinese case, it was verified that China has experienced a rapid and strong economic growth mainly supported by exports and foreign invest-ment, and its exchange rate policy is often cited as a determining factor of this growth. This fact has aroused a growing interest in the international community, not only because of its intensity but also because of the relative sustainability of its growth, concomitant with a period in which the world as a whole showed medium economic growth.
Given that processed products represent the more tradable class of products between these two Groups of countries, we estimated an equation for exports,
34In this work, we did not obtain a model to measure the price elasticity of imports compared to the
based on the work undertaken by yue and Hua (2002), and we concluded, as ex-pected by economic theory, that a Renminbi appreciation would have a negative impact on China’s export growth. Then, using the values of Renminbi undervalu-ation, mentioned in the literature about the subject, we recalculated the Chinese real Exchange rate against the euro, trying to correct their misalignment (with an appreciation of about 32%). Assuming that the value of imports remains constant with Exchange rate movements (a very simplistic assumption, but possible), we concluded that the Trade Balance between these two countries reports significant changes (a reduction of around 20%). These results suggest that the maintenance of a low value of the Renminbi’s Real Exchange rate is an important tool for its growth, as reflected in its export capacity.
To this result is added the fact that a Renminbi undervaluation provides a stimulus for investment in China. In this sense, many companies from the Euro-pean Union Member Countries relocated their businesses to the Chinese territory, creating scope for an increase in unemployment in their home countries. Another effect of this strategy (for attracting FDI to modernize their productive structures) is reflected in the growing technological evolution of Chinese products, allowing them greater competitiveness in sectors with a rather significant influence on the European economy and in which they have comparative advantage (SITC7).
REFERENCES
Assche, A.; Hong, C. and V. Slootmaekers (2008), “China’s International Competitiveness: Reassessing the Evidence”, Discussion Paper 205/2008, Licos Centre for Institutions and Economic Perfor-mance.
Balassa, B. (1964), “The Purchasing Power Parity Doctrine: a Reappraisal”, Journal of Political Economy, Vol. 72, No. 6, pp. 584-96.
Balassa, B. (1965). “Trade Liberalization and Revealed Comparative Advantage”, Manchester Scholl of
Economic and Social Studies, Vol. 33, No. 2, pp.99-124.
Beveridge, S. and C. R. Nelson (1981), “A New Approach to Decomposition of Economic Time Series into Permanent and Transitory Components with Particular Attention to Measurement of the Business Cycle”, Journal of Monetary Economics, Vol. 7, No 2, pp. 151-74.
Bouveret, A.; Mestiri, S. and H. Sterdyniak (2006), “The Renminbi Equilibrium Exchange Rate: an Agnostic View”, Observatoire Français des Conjonctures Économiques No. 2006-13, July. Clark, P. and R. MacDonald (1998), “Exchange Rates and Economic Fundamentals: A Methodological
Comparison of BEERs and FEERs”, in R. MacDonald and J.Stein (eds.), Equilibrium Exchange Rates, Kluwer: Amsterdam and IMF working Paper 98/67, March.
Cline, w. (2010), “Renminbi Undervaluation, China’s Surplus, and the US Trade Deficit”, Peterson
Institute for International Economics, Policy Brief 10-20, August.
Cline, w. and J. williamson (2007), “Estimates of Equilibrium Exchange Rate of the Renminbi: Is There a Consensus and, If Not, why Not?”, Peterson Institute for International Economics, Paper Presented at the Conference on China’s Exchange Rate Policy, October.
Cline, w. and J. williamson (2010), “Estimates of Fundamental Equilibrium Exchange Rates”, Peterson
Institute for International Economics, Policy Brief 10-15, November.
Cline, w. and J. williamson (2011), “The Current Currency Situation”, Peterson Institute for
Dickey, D. and w. Fuller (1979), “Distribution of the Estimators for Autoregressive Time Series with a Unit Root”, Journal of American Statistical Association, Vol. 74, No. 366, pp.427-31.
Driver, R. and P. westaway (2004), “Concepts of Equilibrium Exchange Rates”, Bank of England working Paper Nº 248.
Engle, R. and J. Granger (1987), “Co-integration and Error Correction: Representation, Estimation and Testing”, Econometrica, Vol. 55, No. 2, pp. 251-76.
Ferry, J. and Z. Darvas (2010), “The Threat of Currency wars: a European Perspective”, Bruegel, De-cember.
Frankel, J. (2005), “On the Renminbi: The Choice between Adjustment Under a Fixed Exchange Rate and Adjustment Under a Flexible Rate”, National Bureau of Economic Research, working Paper 11274, April.
Harris, R. (1995), “Cointegration Analysis in Econometric Modelling”, Prentice Hall: London. Herrero, A.G. and T. Koivu. (2007), “Can the Chinese Trade Surplus be Reduced Through Exchange
Rate Policy?”, Bank of Finland, BOFIT Discussion Papers 6-2007.
Hodrick, R. and E. C. Prescott. (1997), “Postwar Business Cycles: An Empirical Investigation”, Journal
of Money, Credit and Banking, Vol 29, No. 1, pp. 1-16.
Johansen, S. (1995), “Likelihood – Based Inference in Cointegrated Vector Autoregressive Models”, Advanced Texts in Econometrics, Oxford University Press.
Ligang, L. (2004), “A Structural and Macroeconomic Approach to RMB’s Valuation”, Journal of China
and World Economy, January-February, pp.11-20.
Ma, A. and A. Van Assche (2011), “China’s Role in Global Production Networks”, in A. Sydor (ed.), Trade Policy Research, Special Edition: Global Value Chains – Impacts and Implications, Ottawa:
Department of Foreign Affairs and International Trade, pp.127-56.
Martins, C. (2005), “A Economia Chinesa e a sua Integração na Economia Mundial”, Banco de Portu-gal – Boletim Económico.
Miller, T. (2014), “A Dream of Asian Empire”, Gavekal Dragonomics, Beijing, December.
Montiel, P. (1999), “Estimating Equilibrium Exchange Rates: An Overview”, in L. Hinkle and P. Mon-tiel (eds.), Exchange Rate Misalignment: Concepts and Measurement for Developing Countries,
Oxford University Press, pp. 65-98.
Montiel, P. (2011), “Macroeconomics in Emerging Markets”, Cambridge University Press, 2nd edition. Pereira, R. (2006), “O Novo Papel da China Como Motor de Crescimento e da Integração no Leste Asiático”, Estudos Sobre a China VIII – Vol. 2. Lisboa: Instituto Superior de Ciências Sociais e
Políticas.
Prasad, E. and S. wei (2005), “The Chinese Approach to Capital Inflows: Patterns and Possible Expla-nations”, IMF working Paper Nº 79.
Rodrik, D. (2006), “what’s So Special About China’s Exports?”, National Bureau of Economic Resear-ch, working Paper 1197, January.
Rogoff, K. (1996), “The Purchasing Power Parity Puzzle”, Journal of Economic Literature, Vol. XXXIV, June, pp. 647-68.
Roubini, N. and B. Setser (2005), “China Trip Report”, April, available at: pages.stern.nyu.edu/~nroubini/ chinaTripReport-Roubini-Setser.pdf.
Safatle, C. and D. Rittner (2014), “Xi rejeita hegemonia e quer mais atuação em questões globais”,
Valor Econômico, São Paulo, 14 de Julho de 2014.
Samuelson, P. (1964), “Theoretical Notes on Trade Problems”, in Joseph Stiglitz (ed.), The collected Scientific Papers of Paul A. Samuelson – Vol. II, Cambridge: MIT Press.
Shi, J. (2006), “Are Currency Appreciations Contractionary in China?”, National Bureau of Economics Research, working Paper 12551, September.
Siregar, R. and Rajan, R. (2006), “Models of Equilibrium Real Exchange Rates Revisited: A Selective Review of the Literature”, Centre for International Economic Studies – Discussion Paper Nº 0604, August.
Sun, H. and y. Ma (2005), “Policy Strategies to Deal with Reevaluation Pressures on the Renminbi”,
Tung, C. and S. Baker (2004), “RMB Revaluation will Serve China’s Self-Interest”, China Economic
Review, Vol. 15, No 3, 67-93.
williamson, J. (1983), “The Exchange Rate System”, Policy Analyses in International Economics 5, washington: Institute for International Economics.
yue, C. and P. Hua (2002), “Does Comparative Advantage Explains Export Patterns in China?”, China
Economic Review, Vol. 13, No. 2, pp.276-96.
wang, T (2004), “Exchange Rate Dynamics”, in E. Prasad (ed.), China Growth and Integration into the world Economy: Prospects and Challenges, IMF Occasional Paper 232, washington, DC: Inter-national Monetary Fund.
Appendix
Table A: Description of the Variables
Variable Unit of Measure Frequency Source
GDP at constant prices of 2005 – China Millions of US$ Quarterly Oxford Economics
GDP at market prices – EU15, Sweden, Denmark, United Kingdom
Millions of
national currency Quarterly Eurostat
Price Index (GDP deflator), 2005=100 – EU15,
Sweden, Denmark, United Kingdom National currency Quarterly Eurostat
Nominal Exchange Rate USD/RMB Chinese
currency per US$ Monthly
People’s Bank of China
Nominal Exchange Rate USD/EUR National currency
per US$ Monthly
Bank of England Imports SITCs 5, 6, 7, 8 and Total – from
China to EU15, Sweden, Denmark and United Kingdom
Value in Euros Monthly Eurostat
Exports SITCs 5, 6, 7, 8 and Total – from China to EU15, Sweden, Denmark
and United Kingdom
Value in Euros Monthly Eurostat
Consumer Price Index – EU15, Sweden,
Denmark, United Kingdom 2005=100 Monthly
MEI, Edition October 2012,
OECD