DOI: http://dx.doi.org/10.1590/0102-4698162025
ARTIGO
RELIGION AND SCHOOLING SUCCESS AT THE MUNICIPAL SCHOOL SYSTEM OF RIO DE JANEIRO
Cynthia Paes de Carvalho* Pontifical Catholic University of Rio de Janeiro (PUC-Rio), Rio de Janeiro - RJ, Brazil Maria Elizabete Neves Ramos** Pontifical Catholic University of Rio de Janeiro (PUC-Rio), Rio de Janeiro - RJ, Brazil
ABSTRACT:The paper presents research results about the relation between family belonging to a religious group and the schooling success or failure revealed by student age-grade discrepancy. We have analyzed information from the official register of the students who attended the municipal elementary school system of Rio de Janeiro, illed by parents during their enrollment in the system in 2011. We have used a logistic regression model to investigate to what extent the effect of belonging to a certain religious group inluences the possibilities for the student to be belated. The results indicated a statistically signiicant association between family religion and the schooling discrepancy. We have discussed as well other characteristics and family practices, correlated to the belonging to a certain religious denomination that might promote a successful schooling.
Keywords:Religion. Family. Schooling success. Age-grade discrepancy.
RELIGIÃO E SUCESSO ESCOLAR NA REDE MUNICIPAL DO RIO DE JANEIRO
RESUMO: O artigo traz resultados de pesquisa sobre a relação entre o pertencimento da família a um grupo religioso e o sucesso ou fracasso escolar indicado pela defasagem idade-série do aluno. Foram analisadas informações da icha cadastral de alunos do Ensino Fundamental na rede municipal do Rio de Janeiro, preenchidas por seus responsáveis no ato da matrícula na rede em 2011. Utilizamos um modelo de regressão logística para investigar em que medida o efeito do pertencimento a determinado grupo religioso influencia as possibilidades de o aluno estar defasado.
Os resultados indicaram uma associação estatisticamente significativa entre religião da família e defasagem escolar. Discutimos, também, outras características e práticas familiares, correlatas ao pertencimento a determinada denominação religiosa, que se articulariam para favorecer uma escolarização bem-sucedida.
Palavras-chave: Religião. Família. Sucesso escolar. Defasagem idade-série.
INTRODUCTION
The importance of the relation between family and school, in the education field, is undeniable, and constitutes, for several decades one of the key aspects in sociological investigation, both
in Brazil and abroad (ALVES et al., 2013). At least since the 60s, the strong association between social origin and school performance
is known (BOURDIEU; PASSERON, 1975; COLEMAN, 1966). However, this relation only indicates a strong inluence, rather than
a cause and effect relationship. In this sense, the association between students’ social origin and school performance does not constitute a deterministic relationship, as high school success rate cases in popular
means exist and may be enhanced (LAHIRE, 2004; VIANA, 2000; ZAGO, 2000). According to Bourdieu (2004), both the structure and
the volume of family capital account to different forms of academic performance. The social networks in which a family, and consequently,
their children, circulate are among the factors that inluence each
child’s academic performance. That is to say, they are part of the
diversiied, imbricated and often subtle factors that condition school
success or failure, as Souza e Silva (2003) points out.
Since the 50s and 60s, several ample statistic surveys were conducted in the United States and in Europe (COLEMAN, 1966; PLOWDEN REPORT, 1967), and deined the relevance of
factors associated with social and family origin in children academic performance, identifying their prevalence over typically academic variables. Among the family-related variables identified, parents’ income, occupation and education level, race or skin color, number of children in the family and the child’s position in the siblings’ birth order,
gender, among others, should be highlighted (NOGUEIRA, 1998).
During the two following decades, due to the hegemony of reproduction
theories in ield of sociological investigation on the educational system,
researchers start to perform more profound analyses and to increase data collection on school inequalities, emphasizing the cultural heritage of families, and their expectations regarding children schooling, based
According to these studies, family origin and parents’ education level are more relevant to explain academic performance inequalities
than the school environment itself. Bourdieu’s (1975) opinions on schools start with these indings and investigate cultural and school components that articulate to inluence different school results. In
this sense, the importance of the families’ cultural capital for the
deinition of school paths. A great part of the studies considered
parents’ education level and families’ socioeconomic status as the
variables to be used as parameters to investigate the inluence of family origin on children’s educational performance. Especially in
Brazil, several researches have considered parents’ education level as
proxy for socioeconomic status (SES), based on the high association
between education level and families’ socioeconomic conditions,
identiied in the country (BARBOSA, 2009; SOARES, 2004).
During the 80s, the key role played by families in sociological
studies about education is consolidated with the emergence of what was called from that point on, as “sociology of family-school relationships”. Researches on the area, which have multiplied ever since, started to investigate internal dynamics and family socialization processes, seeking to understand the dispositions and strategies developed by parents regarding their children’s school lives, in addition to analyzing
how these elements contribute to conigure different school outcomes (CHARLOT, 1996; LAHIRE, 1997; NOGUEIRA; ROMANELLI; ZAGO, 2000). Viana (2005), among others, emphasizes the need to
deepen studies about familial socializing processes in different social contexts, seeking hypotheses that explain school success, measured based on more long-lasting paths, for instance. For the author, such socialization processes produce “dispositional traits [that] potentially trigger elements facilitating – or complicating – academic success, based on how close – or how distant – these traits are in relation to school”. (VIANA, 2005, p.121, emphasis added by author).
The present work is designed to contribute to this long tradition
of studies, discussing results of a research investigating the inluence
of some aspects in family conditions and dynamics on elementary school students’ performances. Given the interest in knowing better what takes place in the family environment, which may affect the schooling process, we have investigated how the family’s belonging to
a certain religious group may inluence the student’s academic success.
Although this topic has been little explored, recent research in Brazil
religion in educational performance studies. This article is designed to contribute to this discussion in the Brazilian case.
RELIGIOUS AFFILIATION IN BRAzIL: wHAT DO RESEARCHES REvEAL?
Brazil’s religion composition underwent great changes in the
past decades, evidencing the number of Catholics dropped, as the
number of evangelicals and the number of people who declared themselves as not belonging to any religious group increased. During
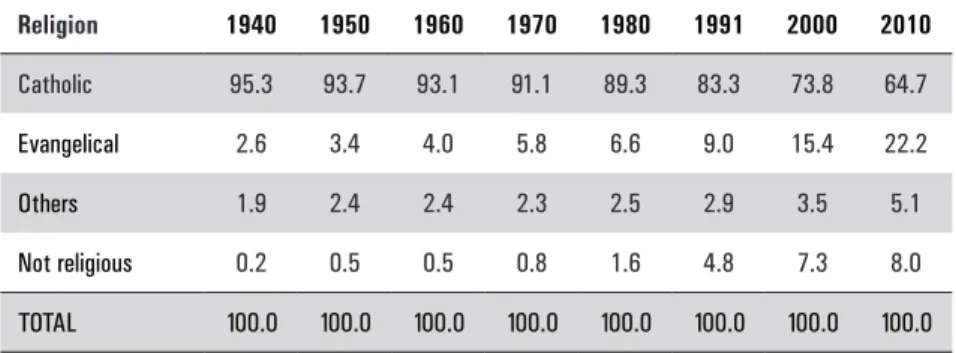
the 40s, Catholics represented 95.3% of the population, whereas between the 40s and the 80s the rate of adhesion to Catholicism dropped 6 percentage points, and 24.6 other percentage points during the following 30 years, reaching 64.7 of the population in 2010.
During this period, the increase in the number of those who identify themselves as not religious, as well as in the group of evangelicals was
signiicant. In the 80s, the group of not religious people represented
1.6 of the population, increasing to 8% in 2010, which represents 6.4 percentage points (equal to 13.4 million inhabitants). The number of evangelicals, however, increased from 6.6% to 22.2% of the
population, representing the religious group which increased the most during the last inter-census period, with an increase of approximately
16 million people, or 15.6 percentage points (NERI, 2005; JACOB; HEES; WANIEZ, 2013), as shown in Table 1 below.
TABLE 1 – Religions in Brazil from 1940 to 2010, in percentage1
Religion 1940 1950 1960 1970 1980 1991 2000 2010
Catholic 95.3 93.7 93.1 91.1 89.3 83.3 73.8 64.7
Evangelical 2.6 3.4 4.0 5.8 6.6 9.0 15.4 22.2
Others 1.9 2.4 2.4 2.3 2.5 2.9 3.5 5.1
Not religious 0.2 0.5 0.5 0.8 1.6 4.8 7.3 8.0
TOTAL 100.0 100.0 100.0 100.0 100.0 100.0 100.0 100.0
Source: Prepared by the authors, based on IBGE’s Demographic Census (1940, 1950, 1960, 1970, 1980, 1991, 2000, 2010).
Although the number of people who declare themselves as not religious is constantly increasing in Brazil, it may be observed that, during the last decade, its increase rate has decreased, as the number of those who declared themselves as not religious went from 7.3% in
third place in the country, considering the statements made for the 2010 census, being located, in relative terms, immediately after
the group of Catholics and the group of evangelicals (JACOB et
al, 2013). In accordance with these authors, demographic censuses
reveal a progressive trend towards religious diversiication in Brazil, with the decrease in number of Catholics, a signiicant increase in
the number of those who declare themselves as not religious, and an exceptional increase in the number of evangelicals, especially from the
Pentecostal group. According to data from the IBGE Demographic Census recorded in Table 1, in 2010, the number of evangelicals increased to 22.2%, totaling 42,275,636, of which 25,370,484 people identiied themselves as Pentecostal evangelicals.
Despite the high number of Pentecostal denominations in
the country, the groups Assembleia de Deus (Assembly of God),
Congregação Cristã no Brasil (Christian Congregation in Brazil) and Universal do Reino de Deus (Universal Church of the Kingdom of God), together, concentrate 64.9% of the Pentecostalists, or 16 million followers (IBGE, 2012). As Mariano (2004) stated, the Pentecostal
expansion is not recent nor episodic, and has been happening for half a
century in a constant manner, which enables Pentecostalism to become
the second greater religious group in the country. While the group of
Pentecostalists has increased 8.9% per year, historical Protestants have increased 5.2%, so that the irst account for two thirds of the evangelicals.
The socioeconomic and demographic proiles of Pentecostal
evangelicals and historical evangelicals are quite different. Data from
the latest census reveal that most Pentecostals have lower income and education level than the average of the Brazilian population. Most of
them earn up to three times the minimum wage and have domestic jobs, usually simple and precarious, at a rate much higher than the national average. In contrast, historical evangelicals have high income and education levels, both much higher than the Brazilian average, and are well distributed in the high school, college and post-graduate educations, and in the income brackets between six and twenty times the minimum wage. Both groups are mostly urban, and the number
of women is higher than the number of men (PIERUCCI, 2004).
As to the distribution of followers by skin color, the average
of black and dark-skinned among Pentecostal evangelicals is higher
than the average of the population, whereas historical evangelicals are
characterized by a large number of white people. Pentecostals hold
more children and teenagers than adults, whereas historical evangelicals
important to emphasize, however, that an under-reporting is assumed, especially in the cases of belonging to African religions, such as umbanda and candomblé. Furthermore, information collection at the demographic census does not allow deeper information on religious mobility situations or belonging to two religions.
As Cunha, Rios-Neto and Oliveira (2014) point out, the history of the Catholic Church in Brazil accompanies the country’s history. From the discovery to the proclamation of the republic, Catholicism was Brazil’s oficial religion. In 1889, when the republic was proclaimed,
Brazil was declared a secular state. In its history, the catholic religion is characterized by including both highly religious people, as well as those who simply attend church to comply with social or passage rites,
but do not consider themselves as active Catholics.
Coutinho (2011) points out, about historical Protestantism in Brazil, that, after the ports were opened and the Portuguese royal family moved to Brazil in early 19th century, British merchants brought the Anglican Church, and German merchants brought
Lutheranism to Brazil. The construction of protestant churches was allowed, as long as they did not intend to convert Brazilians, serving only as worship place for immigrants.
Not until late 19th century were American missionaries able to implement, in Rio Grande do Sul, the irst Anglican communities for Brazilians. In 1855, Robert Reid, a Scottish missionary, founded
congregational churches, which were non-denominational and had no connections with any international churches. Almost at the same
time, in 1862, the Presbyterian Church was founded by Ashbel Green Simonton, in Rio de Janeiro. In 1871, the irst Baptist group settled in Santa Bárbara d’Oeste (SP), brought by American missionaries and immigrants escaping the American Civil War. In 1888, the Brazilian Presbyterian Church Synod was created, disconnecting it from North
American churches. Staring in the 20th century, several divisions also
took place in Presbyterian denominations (COUTINHO, 2011). Classic Pentecostalism started in Brazil with the arrival of two
Swedish men, who had become Baptist pastors in the United States,
to the state of Pará. They founded the Missão de Fé Apostólica (Apostolic Faith Mission), which later was named Assembleia de Deus (Assembly of God). The Congregação Cristã no Brasil (Christian Congregation in Brazil) was brought from the United States to Brazil in 1910, by the Italian-American missionary Louis Francescon, who
worked in Italian communities in south and southeast Brazil. The
from the International Church of the Foursquare Gospel arrived to Brazil and created the National Evangelization Crusade, with a mass
evangelization strategy centered on divine cure – using, above all, the
radio – contributing to the expansion of Pentecostalism in Brazil. They founded the Church of the Foursquare Gospel, which later on originated the denominations: Brazil for Christ, God is Love2, House
of Blessing, among several others. (COUTINHO, 2011).
Considered the third Pentecostal wave, neopentecostalism started on the second half of the 70s, in the United States, and deserves
special attention, as it has been, since then, the wave during which the number of churches increased the most in Brazil. Based on the
Prosperity Theology, neopentecostalism is characterized for preaching
that success, happiness and prosperity may be reached in this earthly life, in contrast with a more ascetic trend that characterizes traditional
evangelicals. Neopentecostals are quite different from historical Protestants and Pentecostals, as they even reject traditional habits and
customs that are considered symbols of conversion and belonging
to Pentecostalism. Although they are more liberal regarding moral
aspects, neopentecostal denominations, as well as all other evangelical denominations, maintain the prohibition of alcohol, tobacco and drug
use, and of extramarital and homosexual sex (MARIANO, 2004).
RELIGIOUS BELONGING AND EDUCATION
The changes through which the country went during the past decades, regarding the population religious composition, draw attention to the possible social, economic, cultural consequences of religious belonging. Literature on education has shown that
social status, gender and color/race are among the most signiicant variables for explaining students’ performance (BARBOSA, 2000; CARVALHO, 2004; ALVES; ORTIGÃO; FRANCO, 2007). In
addition, more recently, several researches have also focused on
the potential inluence of religion – as declared by the families – in the results of high performance schools (COSTA, 2008; COSTA; PRADO; ROSISTOLATO, 2012; CUNHA; RIOS-NETO; OLIVEIRA, 2014), a concern that motivated the present study.
According to Regenerus (2000), religious socialization, understood from the involvement in activities related to a given religious
afiliation, may be a way to provide integration and motivation for school
success, in a process that usually operates besides private belief systems
of social integration whose consequences may be the reinforcement
of values leading to an improved educational performance (CUNHA; RIOS-NETO; OLIVEIRA, 2014; LEHRER, 1999, 2004). Cunha, Rios-Neto and Oliveira (2014), analyzing data from the longitudinal research
conducted by CEDEPLAR/UFMG between 2007 and 2010, involving high school youths from some cities in Minas Gerais, investigated the
relation between religion and educational performance, showing the importance of religion for studying education in Brazil, particularly considering changes in the Brazilian population religious composition
in the past decades. The study developed conirmed that
the religion is, in fact, related to students’ performance in different manners along the grade range, that is, it is associated to a student who has low grades
(for instance, students in the 10% percentile) differently from students who have good grades (for instance, students in the 90% percentile), as demonstrated in
historical protestant students’ Portuguese grades. It is also conirmed that Catholics
had better performances in Mathematics than other students. In addition, as
demonstrated in the nonparametric analysis, the historical protestant group did
better in Portuguese and was the only group to have a performance better
than that of the Catholics, whose grades were higher than those of Pentecostal
and neopentecostal students. A possible explanation for this result is the focus of
historical Protestants in reading the Bible and interpreting texts, activities directly related to the abilities required in learning Portuguese (CUNHA; RIOS-NETO; OLIVEIRA, 2014, p. 108-109, emphasis added by authors).
In our study, given the impossibility to use individual students’ grades in external evaluations aligned with their familial characteristics
listed in the Rio de Janeiro Municipal Education Department
enrollment form, to which we had access, we chose to investigate this relation from the students’ age-grade gap, information also available in the empiricism provided for the study. Thus, the age-grade gap will be our dependent variable, that is, the variable we want to estimate. Other variables are investigated in the logistic regression analysis that studies the ratio of probability that students be in age-grade gap situation, in their schooling process, considering their belonging to a given religious denomination (as stated by the people responsible for them in the enrollment form). The unit of analysis is the student, who
was enrolled from the irst to the ninth year of elementary school in
2011 in the Rio de Janeiro municipal school system,
between their ages and the expected age for the grade is two or more years. The distortion may happen due to late enrollment in the school system, due to leaving or dropping out of school, and, above all, due to being held back. In this situation, students continue their studies, but maintain the gap in the appropriate age considered for each grade, in accordance with what is proposed by education law. In this case, the student will be recorded with the status of age-grade distortion.
Several researchers (KLEIN, 2006; OLIVEIRA; ARAÚJO, 2005; OLIVEIRA; SCHWARTZMAN, 2002) agree that one of
the greatest and chronic problems in Brazilian education is that of students being held back, which is evident not only in the high fail
rates, but also in the age-grade gap rates (CORREA; BONAMINO; SOARES, 2014). As Ribeiro (1991) already pointed out, being held
back once tends to lead to being held back again, contrary to what the Brazilian pedagogical culture suggests, that repeating a grade helps the child to progress in studies. According to the author, the consequences
holding back the population of the irst series in elementary school
have such magnitude that individuals are old in relation to the grade
they are still in and tend to abandon school (SOARES, 2007, p. 138). It is important to emphasize that, from the irst researches performed in Brazil, based on SAEB data, it has become evident that
delay in school, measured by the age-grade gap, has a negative impact
on academic performance (FERRÃO et al., 2001). Finally, we record
Alves, Ortigão and Franco’s (2007) study, which investigates the
association between academic failure and the student’s familial and
sociodemographic characteristics, using data obtained from SAEB
2001. Results found by the authors
[…] reproduce usual literature findings, which already signaled that several sociodemographic variables increase the risk of failure (work, being male,
being black). Economic capital, however, is a failure protection factor. In this
work, we demonstrate that economic capital does not protect everyone equally.
Speciically, high economic capital increases the risk of failure in students who
identify themselves as being black. This result needs to be understood in the context of failure policy dynamics and of allocation of students in schools. In Brazil, approval and failure are, typically, school unit policies, decided in a relatively autonomous way by the schools. The allocation of students in schools
is strongly inluenced by the students’ economic status, especially by way of
the relation between the families’ economic status and their place of residence. Black families in better economic conditions tend to have better living options, which may provide them with access to schools with better teaching conditions. However, this may place their children in the group with higher risk of failing in
Such considerations and research findings reinforce the relevance of this study’s option to use the school gap indicator a
proxy for academic performance, and have inluenced the choice of
variables to be investigated, based on the empirical data to which we had access, as recorded below.
METHODOLOGY
Information used in this study was supplied by the Rio
de Janeiro Municipal Education Department. The research used
information from the enrollment form or registration chart for students in the Rio de Janeiro municipal school system, who were in elementary school in 2011. The basis on which this study was initially
outlined presented a total of 776,023 students enrolled in 2011. Many
times the same student had different codes, cases – for instance – in which the student had requested to be transferred to another school, and his/her student code was still recorded in the origin school, although he/she was being transferred to a different school unit. Furthermore, when the student simply dropped out and, after some time, resumed his/her studies at a different school, he/she frequently was assigned a new code, if the recipient school referred to the SGA4
(Academic Management System) to search for the student’s code and did not ind it. Considering these situations, a meticulous checking and reining work was performed in the database, in which it was
possible to detect perfect homonym cases, in which parents’ names were checked to determine they were not duplication cases.
After this base reinement work, in which repetitions were discarded, the total of students enrolled in 2011 dropped to 732,507
students. After that, we selected only students who were enrolled in the regular elementary school, that is, the ones enrolled between the
irst and ninth grade during that year, reducing the total number of cases in the analyzed universe to 557,400 students.
The enrollment form is completed by the parents or the person responsible for the student and, therefore, it allegedly is more reliable than other questionnaires completed by the students, as is the case
of the student’s contextual questionnaire for the Prova Brasil (Brazil
or persons responsible for the students increases the probability of information consistency. We consider that the indication recorded in the registration chart may be considered, at least, a reasonable approximation for recording the belonging to a certain religious group, or an indicator of probable participation in the social network associated with a given religious denomination.
The registration chart structure includes 53 questions5
organized in an Academic Control System (SCA) used by schools
and by the education departments to control/manage students’ circulation through the system’s schools. In this registration chart, along with the students’ system code, other information is provided, such as the parents’ education level, parents’ occupation, the person with whom the student lives, information on health and/or special education needs, and the respective special treatment code. The form records the school code6, the student’s date of birth, the last school year attended by the student at the school, the grade attended by the student and the last academic result obtained by the student at the school (passed, failed or failed due to absences, whether the student has or had any pending classes in the previous year), as well as the student status (active or inactive). The age/grade gap variable was constructed as a dichotomous variable based on the students’ date of birth in combination with the grade attended by the student in 2011, considering the difference of two years or more between the student’s age and the age expected for that grade.
The registration code also indicates if the student attended
preschool and literacy classes, the student’s Número de Inscrição Social -NIS (Social Registration Number), as well as the declared skin color/ race and the religion speciied by the person responsible for the student.
The question on religion is an open question, systematized by the
Pereira Passos Institute7 as 43 different types. Based on this question, we created the variable “religious denomination”, regrouping the more
than 40 different types of religion into ive categories: catholic, mission or traditional evangelical, other evangelical denominations (Pentecostal,
among others), others, and not religious, which were used in the initial data description stage.
We considered the family’s highest education level as a proxy for socioeconomic level, following the trend of other researches, which have repeatedly stated the high correlation between education level and the families’ socioeconomic status, particularly in Brazil
(BARBOSA, 2009; SOARES, 2004). The variable was developed
form is completed by the people responsible for the students, this information is probably more consistent than the information found
in the Prova Brasil database, obtained by the participating students’
answers to the contextual questionnaires.
Similarly to the students’ case, we used the school students’
parents’ education level average as proxy for the school’s SES,
recording as “high education level” those who had attended high school or higher (even if not complete) and as “low education level” those who had attended only up to elementary school (complete or
not). In the students’ universe, we detected, on average, 35.86% of parents who had high education level. Considering this average found
in the universe of students analyzed, we transformed this proxy into
a dichotomous variable: schools in which over 35.86% of parents had not attended high school (=0), and schools in which over 35.86%
of parents had attended high school or college (=1). Thus, to each
student in each school, a variable (school average SES) was added.
Other context and sociodemographic variables (students’ gender and skin color/race originally expressed based on options used
in IBGE’s demographic census, and whether the student attended
preschool or not) already indicated in the pertinent literature as
relevant for the intended analysis (ALVES; ORTIGÃO; FRANCO, 2007) were also transformed into dichotomous variables8. Similarly
to other studies which have already identiied the relevance of having
attended preschool as a factor that favors a longer and more successful
schooling process (KRAMER, 2006; FELÍCIO; VASCONCELLOS, 2007; BANCO MUNDIAL, 2001), we also considered, in the
analysis, the variable that refers to the family arrangement, whose relevance for school performance has been highlighted in literature
(SILVA; HASEMBALG, 2002). The “family arrangement” variable
was created based on the coding of answers to questions on with whom the student lives (mother only, father only, neither or both).
Finally, based on the student’s Número de Inscrição Social -NIS (Social Registration Number) found on the database built with information on the Municipal Education Department registration charts,
another variable was created, which we consider an indicator of economic
vulnerability for students. The NIS record in the student’s chart indicates the fact that the student and his/her family beneit from some type of welfare - such as the Programa Bolsa Família (Family Stipend Program),
for instance, which was considered a poverty indicator.
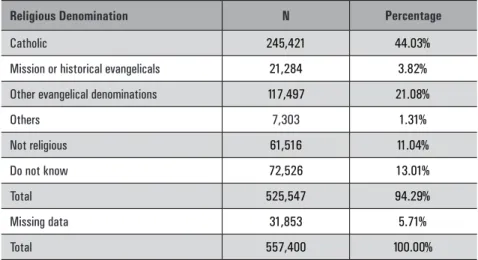
affiliation or denomination on their enrollment records in 2011. Although the group of those families who declare themselves as catholic is predominant, the group of evangelical denominations (traditional, mission or others) is about one fourth of the students.
TABLE 2 – Distribution of regular elementary school students in the Rio de Janeiro municipal system, as per the family’s denomination statement at the registration on the system
Religious Denomination N Percentage
Catholic 245,421 44.03%
Mission or historical evangelicals 21,284 3.82%
Other evangelical denominations 117,497 21.08%
Others 7,303 1.31%
Not religious 61,516 11.04%
Do not know 72,526 13.01%
Total 525,547 94.29%
Missing data 31,853 5.71%
Total 557,400 100.00%
Source: Prepared by the authors based on information from the enrollment database during the year 2011 from the Rio de Janeiro Municipal Education Department.
As the intended analysis depended on information about religion indicated in the registration chart, we decided to consider, as our investigation universe, only students whose registration charts provided information on their religious denomination, which limited the number
of studied cases to 453,021 students, distributed as per table 3 next.
TABLE 3 – Distribution of regular elementary school students in the Rio de Janeiro municipal system, as per the family’s denomination9 statement at the registration on the system
Religious Denomination Frequency Percentage
Catholic 245,421 54.17%
Mission or historical evangelicals 21,284 4.70%
Other evangelical denominations 117,497 25.94%
Others 7,303 1.61%
Not religious 61,516 13.58%
Total 453,021 100%
Table 3 shows that, from a total of 138,781 evangelicals, only 15.4% declared to be historical or mission evangelicals, whereas other evangelical denominations add up to 117,497 students.
Among the evangelical denominations that do not correspond to
historical Protestantism, 114,494 are Pentecostal evangelicals - which corresponds to 97.5% of this total, whereas only 3,003 (2.5%)
belong to undetermined evangelical denominations. The prevalence
of Pentecostal evangelicals in the group of students whose persons
responsible for them indicated they are evangelicals led us to the decision to recode the religious denomination variable into four categories only: catholic, evangelical, other religions, and not religious. Therefore, the category “evangelical” - which, as we saw, may be
essentially characterized as Pentecostal or neopentecostal - ended up totaling 138,781 students, or 30.64% of the students with declared religious afiliations. The group indicated in the category “others” included spiritualists (0.7% of the total), African origin religions, such as umbanda and candomblé (0.3%), and those declared afiliation to other religions, without specifying which (0.2%).
We know that many inferences may be made based on the correlations among the variables. Although the correlation may be a very useful research tool, it does not tell us anything about the
variables’ predictive capabilities (FIELD, 2009). However, through
regression analysis, it is possible to predict one of the variables as a function of the other. Regression analysis enables predicting values of the dependent variable based on one or more independent variables. In this study, the logistic regression model was used, which is a multiple regression, with a dichotomous category output variable. One of the principles of logistic regression is that the dependent
variable behaves in a binary or dichotomous manner (FIELD, 2009,
p. 221). This is a chance model, that is, in which the probability ratio that students whose families declared they belong to a certain religious denomination are in age/grade gap or not - considering
INEP’s deinition, that is, students with a two-year gap or more - in
comparison with students whose parents declare they belong to other religious belonging, keeping other variables constant.
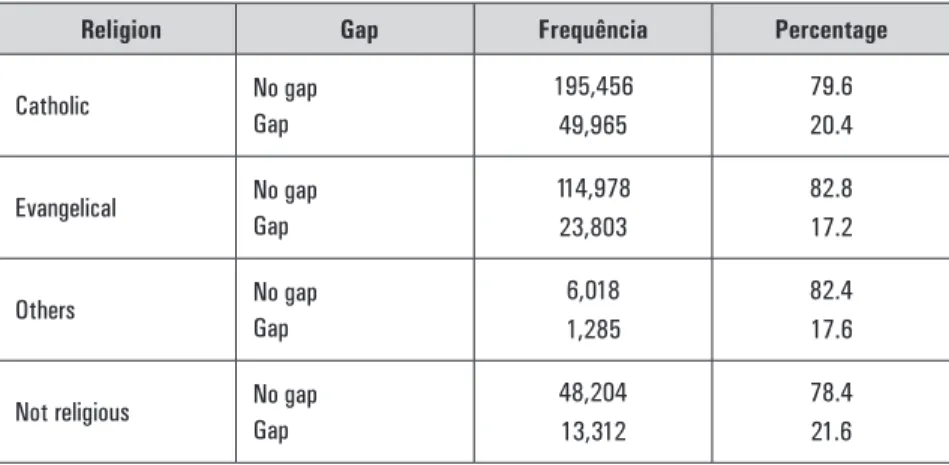
AGE-GRADE GAP AND RELIGIOUS BELONGING
We sought to investigate possible relations between belonging to a given religious group, and the age/grade gap in the schooling process. We consider that belonging to a given religious denomination could have impact on the chance of academic success, measured by the age-grade gap, and we have initially attempted to identify relative
distributions in each case. Table 4 below shows the frequency and
percentage of those displaying a greater or smaller gap, based on their belonging to each religious denomination.
The largest percentage of students who do not have an academic
gap is found in the evangelical groups, with 82.8% of the cases. As
this group presented the largest percentage of students without an academic gap, we chose to consider them as the category or reference group for analysis trough logistic regression, to be provided below.
TABLE 4 – Regular elementary school students in Rio de Janeiro municipal school system, with or without academic gap, according to their belonging to
religious groups, as stated by their families
Religion Gap Frequência Percentage
Catholic No gap
Gap
195,456 49,965
79.6 20.4
Evangelical No gap
Gap
114,978 23,803
82.8 17.2
Others No gap
Gap
6,018 1,285
82.4 17.6
Not religious No gap Gap
48,204 13,312
78.4 21.6
Source: Prepared by the authors based on information from the enrollment database during the year 2011 from the Rio de Janeiro Municipal Education Department.
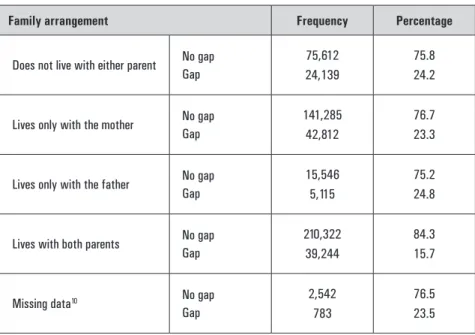
We have also investigated the correlations between the “gap” variable and the “family arrangement” variable - the only categorical variable considered in the analysis other than religion - due to its potential to interact with a given religious group or not. As explained before, the information regarding the family arrangement was based on answers on with whom the student lived, father, mother, both, or neither. Among the students enrolled in the regular elementary school at the Rio de
lived only with their mothers, 3.9% lived only with their fathers, and 13.3% lived with neither. Several studies in the ield of sociology of
education indicated the relevance of family arrangement for academic
success or failure (SILVA; HASEMBALG, 2002), especially among
students from families with more precarious economic conditions. We have also investigated the relation between the “family arrangement”
variable and academic gaps, which resulted in table 5 below.
TABLE 5 – Regular elementary school students in Rio de Janeiro municipal school system, with or without academic gap, according to their family arrangement
Family arrangement Frequency Percentage
Does not live with either parent No gap Gap
75,612 24,139
75.8 24.2
Lives only with the mother No gap Gap
141,285 42,812
76.7 23.3
Lives only with the father No gap Gap
15,546 5,115
75.2 24.8
Lives with both parents No gap Gap
210,322 39,244
84.3 15.7
Missing data10 No gap
Gap
2,542 783
76.5 23.5
Source: Prepared by the authors based on information from the enrollment database during the year 2011 from the Rio de Janeiro Municipal Education Department.
Corroborating other results in several education researches, the highest percentage of students without academic gap (84.3% of
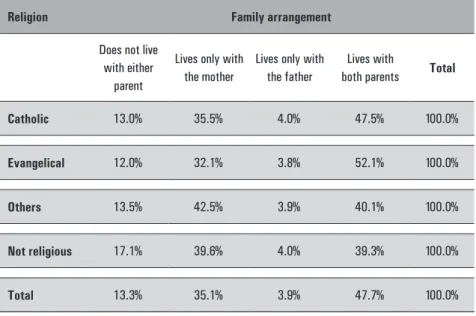
TABLE 6 – Religion declared by regular elementary school students at the Rio de Janeiro municipal school system, and their respective family arrangement types
Religion Family arrangement
Does not live with either
parent
Lives only with the mother
Lives only with the father
Lives with
both parents Total
Catholic 13.0% 35.5% 4.0% 47.5% 100.0%
Evangelical 12.0% 32.1% 3.8% 52.1% 100.0%
Others 13.5% 42.5% 3.9% 40.1% 100.0%
Not religious 17.1% 39.6% 4.0% 39.3% 100.0%
Total 13.3% 35.1% 3.9% 47.7% 100.0%
Source: Prepared by the authors based on information from the enrollment database during the year 2011 from the Rio de Janeiro Municipal Education Department.
Although almost half (47.7%) of the students lived with both
parents, relevant variations may be observed in accordance with the religion declared by those responsible for the students. Table 6 shows a slightly higher concentration of biparental families among those
who declare themselves as catholic or evangelical (47.5% and 52.1%
respectively). Such percentages seem to avow the hypothesis that belonging to the evangelical religions would be positively associated
with biparental family arrangements. Previously mentioned studies (MARIANO, 2004), however, enable us to assume that this religious
belonging would also be associated with the valorization of individual efforts as a strategy for conquering improvements in a social mobility
perspective, especially among the Pentecostal and neopentecostal
evangelicals. In this sense, the association between this effort ethos and biparental arrangements may provide an environment that favors successful schooling and, therefore, with a gap equaling zero. Therefore, belonging to a given religious denomination (evangelical, in particular) could increase the probability of family conditions to be more favorable to successful schooling, constituting sort of a virtuous circle.
In order to estimate the chances that the student has an academic gap, given some control categories, a logistic regression model was used.
CHART 1 – Description of variables used in logistic regression analysis
Variable Variable
type Variable type
DEPENDENT
Age-grade gap/
distortion Dichotomous
Gap = 1 and No gap = 0
INDEPENDENT
Highest family
education level Dichotomous
Education level was evaluated based on the person responsible for the student who had the highest education level: for those who had attended high school or college =1, or for those who did not attend high school = 0
Average
school SES Dichotomous
For schools in which up to 35.86% of the parents had not attended high school = 0
For schools in which over 35.86% of the parents had attended high school or college = 1
Gender Dichotomous Male = 1
and Female = 0
Skin color declared by the family
Dichotomous white = 1 and Non-white = 0
Attended
preschool Dichotomous
Attended preschool = 1 and Did not attend preschool = 0
Family
arrangement Category
Categorized based on with whom the student lived: Living with neither parent = 0;
Living with the mother = 1; Living with the father = 2; and Living with both parents = 3
Biparental family arrangement was considered reference.
Economic vulnerability indicator
Dichotomous
For students who have received or receive some type of welfare or social benefit. In this case, having a NIS = 1,
and not having a NIS = 0.
Religion Category
Divided into four large groups: Catholic = 1;
Evangelicals (traditional or other denominations) = 2; Others = 3;
Not religious = 4.
The evangelical group was considered as reference.
As a regression principle, the analysis of each of the covariations is done in relation to the dependent variable, whereas all other control variables are maintained constant. As pointed out
in Chart 1, for this analysis we used the two situations in which a
greater no-gap student percentage was found: the evangelical group and the biparental family arrangement. In case of dichotomous variables, the reference considered is always equal to one. We also
considered: Exp (B) – 1 = chance, that is, the influence of each
variable on the probability that the student’ schooling process has
a gap. In regression, the reliability level of 95% and the signiicance level lower than 0.05 were imposed.
TABLE 7 – Logistic regression result
B S.E. Exp (B)
Highest education level in the family -0.773 0.011 0.462*
Average school SES -0.208 0.010 0.812*
Gender 0.467 0.009 1.596*
Skin color declared by the family -0.357 0.010 0.700*
Attended preschool -0.573 0.012 0.564*
Family arrangement
Does not live with either parent 0.444 0.016 1.559*
Lives only with the mother 0.424 0.010 1.528*
Lives only with the father 0.539 0.022 1.715*
Economic vulnerability indicator (NIS) 0.090 0.010 1.094*
Religion
Catholic 0.200 0.010 1.222*
Other religions 0.153 0.038 1.166*
Not religious 0.108 0.015 1.115*
Constant -1.536 0.013 0.215*
*All results have proven to be relevant to all significance levels (α < 0.05)
The results provided in Table 7 indicate the statistical signiicance of all variables studied. Students whose parents attended high school or college have a 53.8% reduction in the change to
have an academic gap, if compared to students whose parents only attended up to elementary school. This result corroborates the vast
literature in the sociology of education ield, which states that, the
higher the parents’ education level, the lower the probability of the child having an academic gap. Furthermore, as pointed out by Ferrão et al (2001), the negative impact of the age-grade gap in academic performance may have different magnitudes as per the school attended. In this study, it was possible to determine that the student
who attends a school in which over 35.86% of the parents have high
education level (at least high school or college) reduces the chance of
gap at 18.8%, indicating the possibility of the peer effect, identiied in several researches (ALVES; SOARES, 2007), which most likely
interact with different school processes often associated to school
management. Nevertheless, regarding the specific interest of the present study, indings from other research conducted on the same
education system, albeit with a more qualitative nature, indicate the probable association between these indicators and the belonging to a given religious denomination, not only by the families but also by
other school agents (COSTA, 2008; RAMOS, 2014) in an interaction that seems to reinforce also interschool stratiication mechanisms. In this sense, the very magnitude of the school average SES would
recommend further deeper studies about this analysis level.
The data provided indicate that living only with the father increases
in 71.5% the chance that the student has an academic gap, if compared to
living with both father and mother (biparental family arrangements), thus highlighting the previously pointed out effects of family arrangement on schooling. Once more the possible interaction between this variable
and the values of the respective family religious afiliation (MARIANO, 2004), which would tend to enhance a sort of “virtuous circle” favoring
good academic performance, should be emphasized.
In accordance with numerous sociological studies - since the
Coleman Report in 1966 - about the inluence of socioeconomic origin in school results, having a Número de Inscrição Social -NIS (Social Registration Number) increases in 9.4% the chance that a
student carries an age/grade gap regarding the student who does not have this indication of economic vulnerability. Furthermore, in
the same direction, being white reduces the chance of gap in 30%
school is 48.3% and male presence is 51.7%, the fact of being a boy
increases the student’s age/grade gap probability in 59.6%. Results
as to gender and skin color/race reiterate numerous studies in the
ield of sociology of education which have analyzed the perception
and differentiated evaluation of teachers in accordance with the students’ gender, as they tend to fail boys more frequently than
girls (CARVALHO, 2004) and that indicates that the skin color/
race variable predicts a higher fail risk - and consequent age-grade
gap - (ALVES; ORTIGÃO; FRANCO, 2007). Also confirming
results from other researches previously mentioned on the positive association between attending preschool and school results during
elementary school (KRAMER, 2006), the fact that a student attended preschool reduces the chance of academic gap in 43.6%, in relation
to students who did not attend preschool.
Finally, as to the topic of the present study, the analysis performed indicated that belonging to a family that declared itself as
catholic increases the chance of age/grade gap in 22.2% in relation
to students whose family declared itself evangelical, maintaining all other variables as constant. However, belonging to other religious
denominations increases the chance of academic gap in 16.6% in
relation to students whose families declare to be evangelical. Students whose parents declare to be not religious, on the other hand, increase
their chance of age/grade gap in 11.5%, in relation to students coming
from families who declare themselves evangelical, maintaining all other variables as constant. These results are consistent with those
found by Cunha, Rios-Neto and Oliveira (2014) in a study involving high school students in some cities in the state of Minas Gerais. In
regression analysis, it is possible to compare one of the variables in relation to the other. In the case in question, the logistic regression model enables the comparison between self declared family religious
afiliation, in relation to groups whose parents declare themselves
evangelical. As previously mentioned, logistic relation does not tell
us anything about the variables’ potential to predict (FIELD, 2009).
In addition, it is not possible to infer among groups of religious self
declared afiliation and those from other religious afiliations among themselves, as Mood (2010) already pointed out.
family arrangement, skin color/race, gender and school average socioeconomic status - which may favor the development of “virtuous circles” of academic result construction, which deserve to be more densely analyzed in the field of schooling process sociology, and family-school relation analysis. The investigation performed seems to indicate the relevance of considering religious belonging of families and students and their occasional interactions with other individual and school variables (management characteristics, religious belonging in school agents, internal student evaluation criteria and processes, family-school relations, etc.) as study hypotheses that deserve to be developed
in an articulate manner in future researches in the educational ield.
FINAL CONSIDERATIONS
The study presented indicates that different religious belonging in the families of elementary school students in the Rio de Janeiro municipal school system, among other family, school and social factors
are positively associated with schooling paths, conirming previous inferences found in literature - still scarce in the educational ield -
about the topic. As previously mentioned, given the impossibility to use individual students’ grades in external evaluations aligned with
their family characteristics listed in the Rio de Janeiro Municipal Education Department enrollment form, to which we had access,
we opted to investigate such relation based on the students’ age-grade gap, which was accessible information in the available data11.
Several researches conirm the relevance of using this information as proxy for academic performance (FERRÃO et al., 2001; OLIVEIRA;
ARAÚJO, 2005; OLIVEIRA; SCHWARTZMAN, 2002; ALVES; ORTIGÃO; FRANCO, 2007; CORREA; BONAMINO; SOARES, 2014). These researches, among others, have also guided the selection
of other variables used in the current study, notwithstanding the restrictions of data to which we had access.
This study, it should be noted, was conducted in a single - although large, as it includes half a million students - public education system, based on data collected with the families at the time of enrollment in their units, in the year 2011. Starting with the total number of students enrolled in the Rio de Janeiro public system, we reached
557,400 students in regular elementary school, among which only 453,021 students’ parents speciied the religion to which they belonged
in other states, with different religious belonging distribution, based
on the demographic census performed by IBGE in 2010. It would also be interesting to have more information on the type of religious involvement of families and students, in accordance with their age group and family housing, so as to evaluate better other associations between sociodemographic variables with the issue of belonging to social networks connected to different religious beliefs.
In addition to these limitations, it is important to highlight that,
although education literature (LEE, 2001; FERRÃO; BELTRÃO; SANTOS, 2002) recommends the use of multilevel models, given the
hierarchic nature of educational data, as the relevant dimension observed
of the effect of school average SES on the results also indicated, it was
not possible to gather complementary information about schools that we considered necessary for the present study. We record, therefore, an important limitation we expect to be able to overcome in future research. In this sense, the exploratory nature of this investigation must be registered, as we expect it mobilizes new efforts in the same direction,
enlarging the knowledge buildup in the ield of sociology of education,
about the students’ and their families’ religious belonging.
Everything indicates that considering religious belonging in
sociological analyses on the family-school relation may contribute to
the increase and renewal of knowledge on the ield, favoring a denser
understanding of the schooling processes and a more comprehensive look by school agents on the families of the students they teach. The present study was designed to shed a little light on the issue, bringing
results expected to be useful to the relection on the schooling of
children and youths in the most economically vulnerable populations.
REFERÊNCIAS
ALVES, Fátima; ORTIGÃO, Isabel; FRANCO, Creso. Origem social e risco de repetência:
interação raça-capital econômico. Cadernos de Pesquisa, São Paulo, v. 37, n. 30, p.
161-180, jan./abr. 2007.
ALVES, Maria Teresa G.; SOARES, José Francisco. Efeito-escola e estratiicação escolar:
o impacto da composição de turmas por nível de habilidade dos alunos. Educação em
Revista, Belo Horizonte, n. 45, p. 25-59, jun. 2007.
ALVES, Maria Teresa Gonzaga; SOARES, José Francisco. Contexto escolar e indicadores
educacionais: condições desiguais para a efetivação de uma política de avaliação educacional.
Educação e Pesquisa, São Paulo, v. 39, n. 1, p. 177-194, 2013.
ALVES, Maria Tereza et al. Fatores Familiares e Desempenho Escolar: uma análise multidimensional.
Dados: Revista de Ciências Sociais, Rio de Janeiro, v. 56, n. 3, p. 571-603, 2013.
BANCO MUNDIAL. Brazil Early Child Development: A focus on the impact of
BARBOSA, Maria Lígia de O. Desempenho escolar e desigualdades sociais: resultados preliminares de pesquisa. Preal Debates,Rio de Janeiro, v. 6, p. 1-25, 2000.
BARBOSA, Maria Lígia de O. Desigualdade e desempenho: uma introdução à sociologia
da escola brasileira. Belo Horizonte: Argvmentvm, 2009.
BOURDIEU, Pierre; PASSERON, Jean-Claude. A reprodução. Rio de Janeiro: Francisco
Alves, 1975.
BOURDIEU, Pierre. Futuro de classe e causalidade do provável. In: NOGUEIRA, Maria Alice; CATANI, Afrânio (Org.). Escritos de educação. 6. ed. Petrópolis: Vozes, 2004. p. 81-126.
CARVALHO, Marília P. Quem são os meninos que fracassam na escola? Cadernos de
Pesquisa, São Paulo, v. 34, n. 121, p. 11-40, jan./abr. 2004.
CHARLOT, Bernard. Relação com o saber e com a escola entre estudantes da periferia.
Cadernos de Pesquisa, São Paulo, n. 97, p. 47-63, 1996.
COLEMAN, James S. Equality of Educational Opportunity. Washington: Ofice of
Education: US Department of Health, Education and Welfare, 1966.
CORREA, Erisson V.; BONAMINO, Alicia; SOARES, Tui M. Evidências do efeito da repetência nos primeiros anos escolares. Estudos em Avaliação Educacional, São Paulo,
v. 25, n. 59, p. 242-269, set./dez. 2014.
COSTA, Márcio. Prestígio e hierarquia escolar: estudo de caso sobre diferenças entre escolas
em uma rede municipal. Revista Brasileira de Educação, Rio de Janeiro, v. 13 n. 39, p.
455-469, set./dez. 2008.
COSTA, Márcio; PRADO, Ana; ROSISTOLATO, Rodrigo. “Talvez se eu tivesse algum conhecimento...”: caminhos possíveis em um sistema educacional público e estratiicado.
Interseções, Rio de Janeiro, v. 14, n. 1, p. 165-193, jun. 2012.
COUTINHO, Raquel Z. A carne é fraca: religião, religiosidade e iniciação sexual entre
estudantes do Ensino Médio na Região Metropolitana de Belo Horizonte, 2008. 165 f. Dissertação (Mestrado em Demograia) – Centro de Desenvolvimento e Planejamento Regional da Faculdade de Ciências Econômicas da Universidade Federal de Minas Gerais,
Belo Horizonte, 2011.
CUNHA, Nina M.; RIOS-NETO, Eduardo L. G.; OLIVEIRA, Ana Maria H. C. Religiosidade
e desempenho escolar: o caso de jovens brasileiros da região metropolitana de Belo Horizonte.
Pesquisa e Planejamento Econômico, Brasília, v. 44, n. 1, p. 71-116, abr. 2014.
FELÍCIO, Fabiana de; VASCONCELLOS, Lígia. O Efeito da Educação Infantil sobre o Desempenho Escolar medido em Exames Padronizados. In: ENCONTRO DA ANPEC, 35, Recife, 2007. Anais… Recife: ANPEC, 2007, p. 1-22. Disponível em: <http://www.
anpec.org.br/encontro2007/artigos/A07A093.pdf>. Acesso em: 25 jun. 2015.
FERRÃO, Maria Eugênia et al. O SAEB – Sistema Nacional de Avaliação da Educação Básica:
objetivos, características e contribuições na investigação da escola eicaz. Revista Brasileira
de Estudos de População, Rio de Janeiro, v. 18, n. 1/2, p. 111-130, jan./dez. 2001.
FERRÃO, Maria Eugênia; BELTRÃO, Kaizô I. B.; SANTOS, Denis. Políticas de não repetência e a qualidade da educação: evidências obtidas a partir da modelagem dos dados da 4ª série do SAEB-99. Estudos em Avaliação Educacional, São Paulo: Fundação Carlos Chagas, n. 26, p. 47-73, jul./dez. 2002.
FIELD, Andy. Descobrindo a estatística usando o SPSS. 2. ed. Porto Alegre: Artmed, 2009.
GLANVILLE, Jennifer L.; SIKKINK, David; HERNÁNDEZ, Edwin I. Religious
IBGE. Censo Demográico 2010. Rio de Janeiro, v. 1, 2012. Disponível em: <http://
biblioteca.ibge.gov.br/visualizacao/periodicos/94/cd_2010_religiao_deficiencia.pdf>. Acesso em: 10 fev. 2016.
IBGE. Censo Demográico 1940, 1950, 1960, 1970, 1980, 1991, 2000 e 2010. Disponível
em: <http://memoria.ibge.gov.br/sinteses-historicas/historicos-dos-censos/censos-demograicos>. Acesso em: 10 fev 2016.
JACOB, Cesar R.; HEES, Dora R.; WANIEZ, Philippe. Religião e território no Brasil
[recurso eletrônico]: 1991/2010. Rio de Janeiro: Ed. PUC-Rio, 2013. Disponível
em: <http://www.editora.vrc.puc-rio.br/docs/ebook_religiao_e_territorio_no_ brasil_1991-2010.pdf>. Acesso em: 31 jan. 2015.
KLEIN, Ruben. Como está a educação no Brasil? O que fazer? Revista Ensaio: Avaliação
e Políticas Públicas Educacionais, Rio de Janeiro, v. 14, n. 51, p. 139-172, abr./jun. 2006.
KRAMER, Sonia. As crianças de 0 a 6 anos nas políticas educacionais no Brasil: educação
infantil e/é fundamental. Educação e Sociedade, Campinas, v. 27, n. 96 - Especial, p.
797-818, out. 2006.
LAHIRE, Bernard. Sucesso Escolar nos Meios Populares. São Paulo: Ática, 2004.
LEE, V. E. Using Multilevel Methods to Investigate Research Questions that Involve Nested Data: Examples from Education. Estudos em Avaliação Educacional, São Paulo:
Fundação Carlos Chagas, n. 24, p. 47-68, jul./dez. 2001.
LEHRER, Evelyn. Religion as a determinant of educational attainment: an economic
perspective. Social Science Research, Washington, D.C., v. 28, n. 4, p. 358–379, dec. 1999.
LEHRER, Evelyn. Religion as a determinant of economic and demographic behavior in
the United States. Population and Development Review, New York City, v. 30, n. 4, p.
707-726, 2004.
MARIANO, Ricardo. A expansão pentecostal no Brasil: o caso da Igreja Universal. Estudos
Avançados, São Paulo, v. 18, n. 52, p. 121-138, 2004.
MOOD, Carina. Logistic Regression: why we cannot do what we think we can do, and what
we can do about it. European Sociological Review, Oxford, v. 26, n. 1, p. 67-82, 2010.
Eur Sociol Rev (2010) 26 (1): 67-82.
NERI, Marcelo. A ética pentecostal e o declínio católico. RevistaConjuntura econômica,
Rio de Janeiro, v. 59, n. 5, p. 58-59, 2005.
NOGUEIRA, Maria Alice. Relação família-escola: novo objeto na Sociologia da Educação.
Paidéia, Ribeirão Preto, v. 8, n. 14/15, p. 91-103, 1998.
NOGUEIRA, Maria Alice; ROMANELLI, Geraldo; ZAGO, Nadir. Família & Escola:
trajetórias de escolarização em camadas médias e populares. Petrópolis: Vozes, 2000. OLIVEIRA, Romualdo P.; ARAÚJO, Gilda C. Qualidade do ensino: uma nova dimensão
da luta pelo direito à educação. Revista Brasileira de Educação, Rio de Janeiro, n. 28, p.
5-24, jan./mar. 2005.
OLIVEIRA, João Batista; SCHWARTZMAN, Simon. A escola vista por dentro. Belo
Horizonte: Alfa Educativa, 2002.
PIERUCCI, Antonio F. “Bye, bye, Brasil”: o declínio das religiões tradicionais no Censo
2000. Estudos avançados, São Paulo, v. 18, n. 52, p. 17-28, set./dez. 2004.
PLOWDEN REPORT. Children and their Primary Schools. London: HMSO, 1967.
em escolas públicas com bons resultados escolares. 2014. 129 f. Dissertação (Mestrado
em Educação) – Departamento de Educação, Pontifícia Universidade Católica do Rio de Janeiro, Rio de Janeiro, 2014.
REGNERUS, Mark D. Shaping schooling success: religious socialization and educational
outcomes in metropolitan public schools. Journal for the scientiic study of religion,
New York City, v. 39, n. 3, p. 363-370, sept. 2000.
RIBEIRO, Sergio Costa. A pedagogia da repetência. Estudos Avançados, São Paulo, v. 5,
n. 12, p. 7-21, maio/ago. 1991.
SILVA, Nelson do V.; HASENBALG, Carlos. Recursos familiares e transições educacionais.
Cad. Saúde Pública, Rio de Janeiro, v. 18, supl. p. S67-S76, 2002.
SOARES, José F. O efeito da escola no desempenho cognitivo de seus alunos. Revista Electrónica Iberoamericana sobre Calidad, Eficacia y Cambio en Educación –
REICE, Madri, v. 2, n. 2, p. 83-104, jul./dez. 2004.
SOARES, José F. Melhoria do desempenho cognitivo dos alunos do ensino fundamental.
Cadernos de Pesquisa,São Paulo, v. 37, n. 130, p. 135-160. jan./abr. 2007.
SOUZA E SILVA, Jailson. Por que uns e não outros: caminhada de jovens pobres para a universidade. Rio de Janeiro: Sete Letras, 2003.
VIANA, Maria José B. Longevidade escolar em famílias de camadas populares: algumas condições de possibilidade. In: NOGUEIRA, M. A.; ROMANELLI, G.; ZAGO, N. Família
& Escola: Trajetórias de escolarização em camadas médias e populares. Petrópolis: Vozes,
2000. p. 45-60.
VIANA, Maria José B. As práticas socializadoras familiares como locus de constituição de disposições facilitadoras de longevidade escolar em meios populares. Educação e
Sociedade, Campinas, v. 26, n. 90, p. 107-125, jan-abr. 2005.
ZAGO, Nadir. Quando os dados contrariam as previsões estatísticas: os casos de êxito
escolar nas camadas socialmente desfavorecidas. Paidéia, Ribeirão Preto, FFCLRP-USP,
p. 70-80, 2000.
NOTAS
1Data in Table 1, up to the year 2000, were obtained from Pierucci’s work (PIERRUCI, 2004),
complemented by the authors with information from IBGE’s 2010 Demographic Census (IBGE, 2012), excluding those cases in which the religion was not speciied or identiied.
2 The God is Love Church became very popular among lower income segments of the
population, and is famous for promoting individual and collective exorcisms.
3 In Brazil, the child must enter the irst year of elementary school at the age of six, must
remain in school up to the ninth year, and is expected to complete studies, in this modality, at fourteen years of age. After this period, the child remains for three more years in high school,
completing basic education at the age of 17. When students fail or abandon the studies for
two or more years, during the schooling process, they end up repeating the same grade. In this situation, they continue their studies, with a gap in relation to the age considered appropriate for each year of study, as proposed by the country’s education legislation. These students will be recorded with the status of age-grade distortion. The census is conducted
annually by the Instituto Nacional de Pesquisas Educacionais Anísio Teixeira - INEP (Anísio Teixeira National Education Research Institute), with the support of state and municipal
country. All student enrollment information is captures, including students’ ages. (http://
www.qedu.org.br/ajuda/artigo/265194. Accessed on: January 24, 2016)
4 The SGA (Academic Management System) has been in operation since 2010, replacing the SCA
(Academic Control System) in many schools, which is, however, used in some units. According to the Rio de Janeiro Municipal Education Department consulted, this is an enhancement of
the system used before, without relevant alteration as to the student information collected.
5 Attachment A provides the complete list of items in the chart.
6 The chart also provides information on the school code to which the student was
transferred, the school year and the grade when the transference took place, if applicable.
7 The Pereira Passos Municipal Urban Development Institute (IPP) originated in the RioPlan
Foundation, instituted in 1979 and later changed to Empresa Municipal de Informática e Planejamento - IplanRio (Municipal Information and Planning Company). As the company separated in 1999, the IPP took over the urban planning, cartography production and statistic
activities in Rio de Janeiro. (http://www.rio.rj.gov.br/web/ipp. Accessed on: January 25, 2016)
8 Chart 1, with the set of variables used in logistic regression, provided in the following item,
details all situations described.
9 As previously mentioned, during this initial data description stage, we chose to record
mission or traditional evangelicals separately from other evangelical denominations (pentecostal and others).
10 In this case, information on with whom the student lived was missing from his/her registration charts.
11 The choice to investigate this relation based on the students’ age-grade gap was made
due to the impossibility to establish a communication between INEP’s database and the students’ registration base (Municipal Department of Education), due to the absence of a common identiication code, as Alves and Soares (2013) had already pointed out.
Submission: 03/04/2016 Approbation: 28/06/2016
Contact:
Cynthia Paes de Carvalho Pontifícia Universidade Católica do Rio de Janeiro (PUC-Rio.)
Departamento de Educação Rua Marquês de São Vicente, 225 - Gávea
ATTACHMENT A: ITEMS IN SME/RJ REGISTER (wHITE FORM)
1. Student code in the system
2. Student name
3. Date of birth
4. Gender
5. Nationality
6. Place of birth
7. Father’s name and Mother’s name
8. Father’s occupation and mother’s occupation
9. Religion code (43 different types of codes)
10. Indication of the person responsible for the student
11. Name of the person responsible for the student
12. Address of the person responsible for the student
13. District code of the person responsible for the student
14. City code of the person responsible for the student
15. Postal code of the person responsible for the student
16. Phone number of the person responsible for the student
17. Special education needs’ code
18. Special assistance code
19. Home/school commuting time
20. Home/school commuting means
21. Return home, alone or accompanied
22. Health problems
23. Emergency contact name
24. Emergency contact phone number
25. School code in the system
26. Specifies whether the student attended preschool
27. Specifies whether student’s father is deceased
28. Specifies whether student’s mother is deceased
29. Last school year attended by the student at the school
30. Code of last school year attended by the student at the school
31. Last result of student at school, passed, failed or failed due to absences.
32. Code of school to which the student was transferred
33. School year when student was transferred
35. Specifies whether the student lives with the mother
36. Specifies father’s education level
37. Specifies mother’s education level
38. Specifies if student attended literacy classes
39. Specifies whether the student lives with the father
40. Name of special institute previously attended by the student
41. Specifies whether the student has any pending classes
42. Specifies whether the student had any pending classes in the previous year
43. Student status, active or inactive
44. Code of the last school year attended by the student, for Performance System
45. Specifies whether the final result has changed
46. Specifies whether the father’s name is recorded on the birth certificate
47. Specifies whether the mother’s name is recorded on the birth certificate
48. Skin color/ethnicity code
49. Student’s Número de Inscrição Social -NIS (Social Registration Number)
50. Número de Inscrição Social -NIS (Social Registration Number) of the person responsible for the student