Occupational exposure of
fi
re
fi
ghters to polycyclic aromatic
hydrocarbons in non-
fi
re work environments
Marta Oliveira
a,b, Klara Slezakova
a,b, Adília Fernandes
c, João Paulo Teixeira
d,e, Cristina Delerue-Matos
a,
Maria do Carmo Pereira
b, Simone Morais
a,⁎
aREQUIMTE
–LAQV, Instituto Superior de Engenharia do Porto, Instituto Politécnico do Porto, R. Dr. António Bernardino de Almeida 431, 4200-072 Porto, Portugal b
LEPABE, Departamento de Engenharia Química, Faculdade de Engenharia, Universidade do Porto, R. Dr. Roberto Frias, 4200-465 Porto, Portugal cEscola Superior de Saúde, Instituto Politécnico de Bragança, Avenida D. Afonso V, 5300-121, Bragança, Portugal
dInstituto Nacional de Saúde Pública, Departamento de Saúde Ambiental, Rua Alexandre Herculano 321, 4000-055 Porto, Portugal eUniversidade do Porto, Instituto de Saúde Pública, Rua das Taipas 135, 4050-600 Porto, Portugal
H I G H L I G H T S
•Firefighters' air exposures to PAHs in non-fire work settings were assessed. •Obtained PAH levels fulfilled
occupa-tional limits and air quality guidelines. •Congeners with 2–3 rings were the
pre-dominant contributors to total PAHs levels.
•Exposure sources were mixed ones (both pyrogenic and petrogenic origin). •Incremental lifetime cancer risks exceeded WHO–based guideline at all
fire houses.
G R A P H I C A L A B S T R A C T
a b s t r a c t
a r t i c l e
i n f o
Article history:
Received 27 October 2016
Received in revised form 7 March 2017 Accepted 8 March 2017
Available online 17 March 2017 Editor: D. Barcelo
This work aims to characterize personal exposure offirefighters to polycyclic aromatic hydrocarbons (PAHs) in non-fire work environments (fire stations), and assesses the respective risks. Eighteen PAHs (16 considered by USEPA as priority pollutants, dibenzo[a,l]pyrene and benzo[j]fluoranthene) were monitored in breathing zones of workers atfive Portuguesefire stations during a normal shift. The obtained levels of PAHs fulfilled all existent occupational exposure limits as well as air quality guidelines with total concentrations (ΣPAHs) in range of 46.8–155 ng m−3. Light compounds (2
–3 rings) were the most predominant congeners (74–96% ofΣPAHs) whereas PAHs with 5–6 rings accounted 3–9% ofΣPAHs. Fuel and biomass combustions, vehicular traffic emis-sions, and use of lubricant oils were identified as the main sources of PAHs exposure at the studiedfire corpora-tions. Incremental lifetime cancer risks were below the recommend USEPA guideline of 10−6and thus negligible for all the studied subjects, but WHO health–based guideline level of 10−5was exceeded (9
–44 times) at allfire corporations. These results thus show that even during non-fire situationsfirefighters are exposed to PAHs at levels that may promote some adverse health outcomes; therefore the respective occupational exposures to these compounds should be carefully controlled.
© 2017 Elsevier B.V. All rights reserved. Keywords:
Occupational exposure Firefighters
Polycyclic aromatic hydrocarbons (PAHs) Risk
Indoor air Legislative limits
⁎ Corresponding author.
E-mail address:[email protected](S. Morais).
http://dx.doi.org/10.1016/j.scitotenv.2017.03.081
0048-9697/© 2017 Elsevier B.V. All rights reserved.
Contents lists available atScienceDirect
Science of the Total Environment
1. Introduction
Firefighters (IARC, 2010a) represent one of the most hazardous oc-cupation (Baxter et al., 2014). During their professional conduct,fi re-fighters are exposed to a complex mixture of pollutants including particles (fine and respirable particulate matter) and a wide range of gaseous chemicals (such as carbon monoxide and dioxide, nitrogen ox-ides, carbonyls, volatile and semi-volatile organic compounds;Estrellan and Lino, 2010; Lemieux et al., 2004; Lewtas, 2007; Miranda et al., 2010; Reisen et al., 2006). Among them polycyclic aromatic hydrocarbons (PAHs) are especially relevant due to their mutagenic and genotoxic properties (Annesi-Maesano et al., 2007; IARC, 2002, 2010a, 2010b; Tuntawiroon et al., 2007), some of them being considered as endocrine disrupting chemicals (WHO, 2013). Occupational exposure to PAHs has been associated with increased risks of various cancers (lungs, bladder, skin, urinary and gastrointestinal systems;Boffetta et al., 1997; Diggs et al., 2011; Rota et al., 2014); cell damage via gene mutation (Kamal et al., 2015; Kuang et al., 2013; Poirier, 2004), oxidative stress and car-diovascular diseases (Burstyn et al., 2005; Jeng et al., 2011; Kim et al., 2013; Lee et al., 2011) and cardiovascular mortality (Brucker et al., 2014). Concerning potential exposure and adverse health effects, United States Environmental Protection Agency (USEPA) has identified 16 priority congeners (USEPA, 2014).
From chemical perspective, PAHs are compounds containing only hydrogen and carbon that are composed of multiple aromatic rings. They are abundant in soils and marine sediments, fresh water, and in at-mosphere where the more health hazardous congeners (WHO, 2010) are predominantly bound tofine (i.e. PM2.5) particles (Castro et al., 2011; Slezakova et al., 2011, 2013b). Fire emissions and smoke are the most relevant sources of PAHs exposure forfiremen (Booze et al., 2004; Fent et al., 2013, 2014; Kirk and Logan, 2015a), but the com-pounds are formed by other man-made sources such as industrial pro-cesses, incinerators, coal-fired boilers and power plants, and last but not least, by traffic emissions (Hanedar et al., 2014; Ravindra et al., 2008; Slezakova et al., 2013a, 2013b). In confined spaces, second– hand tobacco smoke, combustion emissions (from cooking stoves and fireplaces) and infiltration of ambient air emissions are responsible for the presence of PAHs (Chen et al., 2012; Qi et al., 2014; Shen et al., 2012; Slezakova et al., 2014). The toxicity of PAHs is largely attributed to their reactive oxygenated metabolites, potential of causing oxidative stress (Kamal et al., 2015) and the adducts of their metabolites with DNA (Rengarajan et al., 2015). The DNA-binding is considered to be es-sential for the carcinogenic effect (Pratt et al., 2011; Tarantini et al., 2011) with DNA adducts being identified in various human tissues (Ziech et al., 2011); cancer is the primarily risk for PAHs exposure (Boström et al., 2002; Kim et al., 2013) and in that view International Agency for Research on Cancer (IARC) has categorised benzo[a]pyrene (B[a]P; a marker of PAHs exposure) as known human carcinogen (Group 1) (IARC, 2010b) whereas other congeners are classified as probable and/or possible ones (Group 2A and 2B, respectively). Further scientific evidence has also linked exposure to PAHs with cardiovascular diseases (Lewtas, 2007; Korashy and El-Kadi, 2006). Adverse health out-comes (hemotoxicity and carcinogenicity;Fabian et al., 2014; Fent and Evans, 2011; Robinson et al., 2008) and also excess morbidity and mor-tality have been reported forfirefighters' occupational exposure, with cardiovascular diseases being the primary cause for the deaths (in ap-proximately 45% offirefighters) and a major cause of the increased mor-bidity (Gaughan et al., 2014a, 2014b; Soteriades et al., 2011); the additional exposure to PAHs may promote and/or worsen the existent cardiovascular diseases offirefighters (Lewtas, 2007). Because of the relevance of this topic, data regardingfirefighters' exposure to PAHs have been emerging. The most extensive studies that assessed expo-sures in various combat situations and scenarios (i.e. training sessions, mainly prescribed burns management, suppression and overhaul of controlled structure burns) have been conducted in USA (Baxter et al., 2014; Bolstad-Johnson et al., 2000; Booze et al., 2004; Fent et al., 2013,
2014; Fent and Evans, 2011; Pleil et al., 2014; Robinson et al., 2008) and Australia (Kirk and Logan, 2015a). In addition, some authors report-ed thatfire-generated contaminants were tracked back tofire stations throughfirefighters' protective gear (gloves, boots and turnout equip-ment) and vehicles (Alexander and Baxter, 2014; Fabian et al., 2014; Fent et al., 2013; Kirk and Logan, 2015a, 2015b; Laitinen et al., 2010; Shen et al., 2015) but only few studies investigated occupational expo-sure to PAHs atfire stations (being mainly conducted in USA). Due to the geographical differences such different materials and construction techniques used for building houses and structures, and due to differ-ences in thefirefighting practices (which can influence the smoke emis-sions and consequently the respective exposure;Reinhardt and Ottmar, 2004; Reisen and Brown, 2009; De Vos et al., 2009), these reported ex-posure data may be significantly different from those of Europeanfi re-fighters. Furthermore, the seasonal trends of PAHs (Liu et al., 2008; Melymuk et al., 2012; Ravindra et al., 2006) may lead to further differ-ences. This study aimed to investigatefirefighters' exposure to PAHs in work (non–fire incident) settings. The levels of 16 PAHs considered by USEPA as priority pollutants, dibenzo[a,l]pyrene (D[a,l]P) and benzo[j]fluoranthene (B[j]F; a monitoring is suggested byDirective 2004/107/EC, 2005) were measured in the breathing air zone offi re-fighters in five Portuguese municipalities. The potential emission sources in the work settings were identified by diagnostic ratios and the occupational risks due to PAHs exposure in the respective environ-ments were assessed.
2. Material and methods
2.1. Sample collection
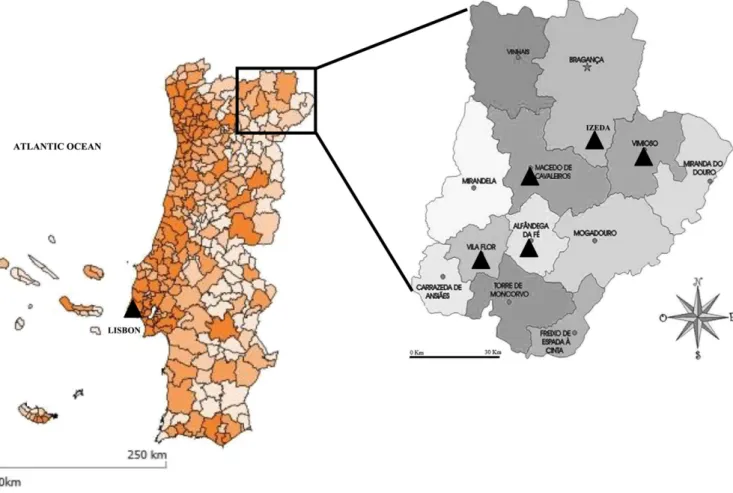
Portugal belongs to thefive Southern European Member States which every year suffer the most forestfires (Joint Research Centre, 2011). Typically, central and northern region of the country are affected the most by forestfires; in 2014 these two regions exhibited a burnt area of 14,938 ha (~ 75% of the total) with northern region also register-ing the prevailregister-ing number offire occurrences (40% of the total number offires) (Joint Research Centre, 2015). The sample collection was thus conducted in northern region in Braganza district (Fig. 1) where annual average air temperature was 12.7 °C and precipitation was 900.2 mm (INE, 2015); summer was hot and dry (average temperature of 28.2 °C, precipitation: 3.6 mm).
The personal sampling was conducted during a period of 28 days (May–June 2014) in subjects (Table 1) who worked as professionalfi re-fighters at corporations offive different municipalities: Vimioso (VMS), Macedo de Cavaleiros (MCC), Izeda (IZD), Vila Flor (VFR), and Alfândega da Fé (AFF). Allfire corporations were located in central zones of rather small towns with relatively low populations (between 1212 and 15,776 at IZD and MCC;Table 1) and were considered as urban back-ground sites. Eachfire station was composed of track/car garages that were in general indirectly connected with working areas, control room and offices, as well as with an area of living quarters (Figs. 1S and 2S). For each subject, additional information (age, weight, gender, education, duration of employment;Table 1) was collected by means of structured questionnaire (WHO, 2016). All participatingfiremen were non-smokers. Information on further PAH exposures such as transportation to work, smoking and diet habits were also registered (Table 1) with participants reporting the most frequently consumed meals as: boiledNroastedNgrilled.
subjects during a continuous 4-h period of a regular shift of a single day. The personal sampling (n= 54) was done according to USEPA IP-10A method (USEPA, 1990) using a personal environmental monitor (PEM™; SKC Ltd., United Kingdom), i.e. single stage impactor (PM2.5) that was placed in breading zone (at height 152–178 cm) of each sub-ject combined with personal air sampling pump (Gilian, model GilAir-3; Sensidyne, USA; airflow rate 2 L min−1) mounted at the waist (total volume of sampled air was 480 L per sample) All subjects moved freely according their needs within the stations and performed regular working tasks as usually. Polytetrafluoroethylene membrane disks (2μm porosity, Ø37 mm; SKC Ltd., UK) were used for the collec-tion of PM2.5. After the sampling,filters were placed in polyethylene containers and stored (at−20 °C) for the chemical analysis.
Allfirehouses were ventilated by opening windows (when needed); air conditionings systems were not available. Smoking was prohibited in all areas offire stations (indoor places, garages/ truck bays). During the sampling a record of potential emission sources (vehicles arrivals and/or departures, vehicles and/or equipment maintenances, use of cooking appliances, etc.), and the general activities of the study subjects were recorded (Table 1S of the Supplementary Material).
2.2. PAHs quantification
PAHs were determined according toCastro et al. (2009, 2011)that in details describe all steps of the validation of the used analytical method, which consisted of extraction (microwave assisted) and quantification by liquid chromatography withfluorescence (17 compounds) and pho-todiode array (acenaphthylene) detection. For readers convenience, the information on the analytical procedure and quality control is also pre-sented in Supplementary Material (Section 1S and Table 2S).
2.3. Risk assessment
The toxicity equivalent concentrations (B[a]Peq) based on the toxic-ity of B[a]P were calculated. Toxicity equivalency factors (TEF) proposed by Nisbet and LaGoy (Boström et al., 2002) were used. The excess life-time risk of lung cancer due to PAH exposure was then estimated by quantitative risk assessment methodology (WHO, 1987, 2000) using unit risk of 8.7 × 10⁻⁵(i.e. 8.7 cases per 100,000 people with chronic in-halational exposure to 1 ng m−3of B[a]P over a lifetime of 70 years) and considering 8 h period for a work shift.
The incremental lifetime cancer risks (ILR) from inhalation ex-posure to particulate PAHs were estimated according to the USEPA methodology (Region III Risk-based Concentration Table; USEPA, 2016); ILR below 10−6are denoted as safe ones, whereas potentially high risks are estimated by values N10−4 (USEPA,
1989). The full details of the methodology and the ILR calculations can be found inOliveira et al. (2016a). The concentrations of PAHs (determined for each subject by personal air sampling) were used and the exposure durations (i.e. years of employment asfi re-fighters), which were obtained for each subject. For reader's conve-nience, Table 3S demonstrates an example of ILR calculations; default parameters are summarized in Tables 4S and 5S.
2.4. Statistical analysis
Statistical analyses were done in SPSS (IBM SPSS Statistics 20), Statistica software (v. 7, StatSoft Inc., USA) and Excel (v. 16.0, Microsoft Corporation, USA). Nonparametric Mann–WhitneyU
test was used to compare the mean values once normal distribu-tion was not observed by Shapiro–Wilk's test. Statistical signifi -cance was defined aspb0.05.
3. Results and discussion
3.1. PAH levels
The levels of PAHs determined in the breathing air zones of studied subjects working atfivefire corporations are summarized inTable 2. The total levels of PAHs (ΣPAHs) in the breathing zones of workers var-ied between thefive corporations. As shown, the lowest levels (i.e. me-dianΣPAHs) were found at VFR (46.8 ng m−3) being signi
ficantly (pb0.001) different than at other corporations (except for AFF;p=
0.169) whereas VMS exhibited the highest concentrations (154 ng m−3), approximately 3 times higher than at VFR. VMS corpora-tion had the highest occupancy rate (more 30–45% of workers than at the remainingfirehouses) and was the only one equipped with a gaso-line station which could have caused the elevated PAH levels. For the otherfire stations, similar levels ofΣPAHs were found at MCC≈IZD (104–107 ng m−3) being higher than those at AFF (77.3 ng m−3). It is noteworthy that, though MCC and IZDfire stations were situated in cit-ies with different populations (15,776 and 1212 inhabitants, respective-ly for MCC and IZD), the overallΣPAHs were rather similar (p= 0.102); bothfirehouses were the most recently constructed ones (2005–2012 as opposed to 1978–1979 (for VMS and VFR, respectively) and 1991 (for AFF)). The building characteristics as well as other factors such as the presence of emission sources and performed activities of occupants, type of microenvironments (physical characteristics of the indoor/out-door places, occupancy, ventilation rates, etc.), and overall pollution
levels (including seasonal, meteorological and geographical differences) influence the personal exposure to a pollutant (Chen et al., 2012; IARC, 2010a, 2010b; Madureira et al., 2016; Oliveira et al., 2015a).
The results inTable 2also show that contribution profiles of PAHs at all stations were somewhat similar. Acy was the predominant PAH at all stations (except for MCC where it was the 2nd most abundant one) ac-counting between 44% (at VMS) and 69% (AFF) of the total PAH content (i.e.ΣPAHs). This PAH is a component of organic material such as coal tar and crude oil. The presence of Acy in air may result from evaporation from these organic materials but it may also be released into the envi-ronment duringfires (Kirk and Logan, 2015a, 2015b); wood combus-tion results in emissions of smoke with predominant abundance of this PAH (Perwak et al., 1982). Nap was the 2ndmost abundant PAH at stations IZD, VFR and AFF, accounting for 12–16% ofΣPAHs with levels much lower than those reported forfire stations in Cincinnati, USA (9.22μg m−3at kitchen area up to 9.24μg m−3at truck bay;Baxter et al., 2014). Although no specific sources of Acy and Nap were identi-fied, higher abundance of Acy could be due secondary transfer (via con-taminated protective material) whereas in indoor air Nap emissions may result from incomplete combustion (wood, tobacco) and from evaporation of Nap-containing materials (such moth repellents air fresheners, crude oil, petroleum products) (Jia and Batterman, 2010). It is necessary to remark that Nap is recognized as relevant indoor pol-lutant by WHO that recommended an annual guideline value in indoor air of 10μg m−3(WHO, 2010). Whereas the levels reportedBaxter et al. (2014)are close to that value, the concentrations in the breathing zones
Table 1
Characterization offire stations and the study population (n= 54): Vimioso (VMS), Macedo de Cavaleiros (MCC), Izeda (IZD), Vila Flor (VFR) and Alfândega da Fé (AFF). Fire station
VMS MCC IZD VFR AFF
Site characterization Urban background Urban background Urban background Urban background Urban background
Location Town Town Town Town Town
Number of inhabitants 4669 15,776 1212 6697 5104 Year of construction 1978 2012 2005 1979 1991
Year of refurbishment 1995 – – 2008 –
Sampling date 28.5.2014 2.6.2014 16.6.2014 24.6.2014 17.6.2014 Meteorological conditions:_
Air temperature (°C) 19.4 (10.3–26.3) 18.6 (8.2–25.5) 19.0 (10.8–25.7) 16.3 (12.8–20.0) 19.5 (9.1–27.4) Relative humidity (%) 57.4 (33.7–86.0) 55.1 (36.6–87.7) 46.5 (27.4–73.6) 80.1 (64.5–90.5) 46.1 (27.4–74.0) Wind speed (m s−1) 2.1 (0.1–6.7) 1.3 (0.1–4.0) 3.0 (0.9–5.6) 0.9 (0.0–3.4) 2.0 (0.2–4.4)
Wind direction S–SW SW–S NE–E S–SW E–SE Solar radiation (kW m−2) 0.1 (0.0
–0.5) 0.2 (0.0–0.5) 0.2 (0.0–0.5) 0.1 (0.0–0.5) 0.2 (0.0–0.5) Precipitation (mm) 0.0 0.0 0.0 0.1 (0.0–1.6) 0.0 Potential outdoor emission
sources
Equipped with gasoline station
Gasoline station approximately 500 m
Gasoline station approximately 1 km
Gasoline station approximately 500 m
Gasoline stations approximately 500 m Vehicles:
Departures 4 5 3 3 3
Arrivals 4 4 4 4 3
Number of workers (firefighters) atfire station
70 50 38 40 45
Floor coating (control center) Polyvinyl chloride Wood Ceramic tiles Ceramic tiles Ceramic tiles Number of windows and doors
(control center)
2 windows; 2 doors
1 window; 1 door
3 windows: 1 door
3 windows (1 opened); 1 door
1 window; 1 door Ventilation at control center:
Beginning of day Yes Yes Yes Yes Yes
During the day Yes Yes Yes Yes Yes
End of the day No No No No No
During cleaning Yes Yes Yes Yes Yes
Cleaning 1 per day 1 per day 1 per day 1 per day 1 per day
Study population (%) 22 22 22 22 12
Gender (%) Male: 75 Female: 25
Male: 75 Female: 25
Male: 50 Female: 50
Male: 100 Male: 100 Age (years) 36 (26–43) 22 (19–24) 33 (12–35) 23 (18–25) 35 (30–40) Weight (kg) 74 (61–88) 68 (63–72) 76 (62–90) 93 (78–101) 87 (73–100) Employment duration (years) 18 (3–25) 4 (2–7) 11 (4–17) 5 (2−10) 15 (12–18) Education Secondary: 75%
Higher: 25%
Secondary: 50% Higher: 50%
Secondary: 100% Elementary: 25% Secondary: 50% Higher: 25%
Elementary 50% Secondary: 50%
Smoking (yes/no) No No No No No
of the studied subjects of this work were well below the recommended guideline. However, it is necessary to remark that Nap (as well as other light–molecular weight PAHs with 2–3 aromatic rings) is predominant-ly found in the gas phase (Oliveira et al., 2015b, 2016b), which was not assessed in this work; thus the respective exposures of studied subjects atfivefire corporations might be underestimated. Therefore, to ade-quately evaluate occupational exposure to PAHs (even during non-fires settings), future works should consider assessment of gaseous PAHs that are commonly not considered (Lui et al., 2017; Montaño-Soto et al., 2017; Oliveira et al., 2015a). At IZD, VFR and AFF, Phe was the 3rd(and 4that IZD) most predominant compound (6–9% ofΣPAHs). At stations VMS and MCC, slightly different profiles of PAHs in breathing zones of workers were observed with high contribu-tions of Ace (43% and 55% ofΣPAHs); the contribution of Nap was 6 and 10% respectively. Overall, light molecular weight PAHs (i.e. with 2–3 rings) were by far the most predominant congeners in the breathing zones of the workers at all stations, with the abundances ranging from 74% (at VFR) to 96% (at VFS) of the total PAH content. PAHs with 5–6 rings accounted for much less content (3–9% ofΣPAHs) with the excep-tion to VFR, where heavy molecular PAHs exhibited higher proporexcep-tion (21% ofΣPAHs). This occurrence was mostly due to the higher contribu-tions of D[a,h]A (6% ofΣPAHs at VFRvs. ~1% at the otherfire houses) and B[ghi]P (8% at VFRvs. ~2–4% at the remaining corporations). The higher
prevalence of these two PAHs indicates a potential contribution from vehicular emissions (Ravindra et al., 2008) at thisfire station.
Occupational Safety and Health Administration (OSHA) regulates occupational exposure to PAHs through “coal tar pitch volatiles” (ATSDR, 2016; i.e. extractable benzene soluble fraction of total particu-lates that includes B[a]A, B[b]F, Chry, Ant, B[a]P, Phe, Pyr and acridine) (Table 6S). The designated limit is expressed as 8–hour time-weighted average (TWA) permissible exposure limit (PEL) of 0.2 mg m−3 (ATSDR, 2016). The National Institute for Occupational Safety and Health (NIOSH) guideline for PAHs exposure in the workplaces is set as the lowest detectable concentration of 0.1 mg m−3for coal tar pitch volatile agents (ATSDR, 2016). The air exposure to these seven PAHs (acridine was not considered in this work) ranged between 4.7 and 46 ng m−3among the investigated subjects being well below the OSHA-mandated limit and NIOSH recommendation. The permitted (0.6 mg m−3) and maximum (1 mg m−3) excursion limits de
fined by American Conference of Governmental Industrial Hygienists (ACGIH; Table 6S) were also fulfilled for total PAHs.
Occupational exposure offirefighters has been associated with in-creased risk of cancers (urothelial, skin, lung, kidney and testicular can-cers) though somefindings remain unclear (Daniels et al., 2013; LeMasters et al., 2006). Once absorbed into blood stream (by inhalation, ingestion, and dermal contact) PAHs are metabolized and distributed
Table 2
Levels (median; min–max) of PM2.5–bound PAHs (ng m
−3) in the breathing air zone offirefighters (n= 54) atfivefire stations (Vimioso (VMS), Macedo de Cavaleiros (MCC), Izeda (IZD),
Vila Flor (VFR), Alfândega da Fé (AFF)).
Compound⁎ Fire station
n= 12 n= 12 n= 12 n= 12 n= 6
VMS MCC IZD VFR AFF
Naphthalene 9.78 (8.98–10.1)
11.0 (2.09–14.0)
16.3 (12.1–22.2)
5.54 (4.59–14.5)
8.98 (7.16–9.80) Acenaphthylene 68.7
(42.7–125.4)
24.0#
(24.0–95.4)
37.3 (24.0–52.6)
24.0+(24.0
–24.0) 53.0 (24.0–101) Acenaphthene 65.8
(1.62–75.6)
58.2 (28.7–94.1)
25.0 (22.9–25.5)
1.62α
(1.62–8.85)
1.62α
(1.62–8.94) Fluorene 0.405
(0.272–0.460)
0.665 (0.272–6.01)
1.36 (0.993–1.57)
0.272 (0.272–0.491
0.697 (0.422–0.823) Phenanthrene 3.54
(3.26–3.89)
4.51 (3.45–17.8)
9.55 (8.14–11.1)
3.14 (2.72–3.85)
4.35 (4.21–9.05) Anthracene 0.223+
(0.223–0.223)
0.223α
(0.223–0.551)
0.330 (0.317–0.367)
0.223+
(0.223–0.223)
0.223+
(0.233–0.233) Fluoranthene 0.351+
(0.351–0.351)
0.351α
(0.351–0.811)
1.82 (1.12–2.94)
0.716α
(0.351–1.28)
0.596#
(0.351–0.867) Pyrene 0.292α
(0.292–0.653)
0.568α
(0.292–0.878)
2.24 (0.929–3.99)
0.553α
(0.292–0.942)
0.719 (0.292–1.45) Benz[a]anthracene 0.205#
(0.205–0.783)
0.205e
(0.205–0.205)
0.257α
(0.205–0.325)
0.205e
(0.205–0.205)
0.205e
(0.205–0.205) Chrysene 0.145e
(0.145–0.145)
0.145&
(0.145–0.271)
0.937α
(0.145–1.80)
0.561&
(0.145–0.803)
0.390α
(0.145–0.784) Benzo[b + j]fluoranthene 0.844+
(0.844–0.844)
0.844+
(0.844–0.844)
0.844 (0.844–1.34)
1.51 (0.844–2.21)
0.844+
(0.844–0.844) Benzo[k]fluoranthene 0.134+
(0.134–0.134)
0.134+
(0.134–0.134)
0.181 (0.134–0.252)
0.281 (0.134–0.403)
0.134+
(0.134–0.134) Benzo[a]pyrene 0.277+
(0.277–0.277)
0.277+
(0.277–0.277)
0.277+
(0.277–0.277)
0.977 (0.277–1.16)
0.449 (0.277–0.570) Dibenzo[a,l]pyrene 0.671+
(0.671–0.671)
0.671+
(0.671–0.671)
0.671+
(0.671–0.671)
0.671+
(0.671–0.671)
0.671+
(0.671–0.671) Dibenz[a,h]anthracene 0.499+
(0.499–0.499)
0.499+
(0.499–0.499)
0.499+
(0.499–0.499)
2.79α
(0.499–3.43)
1.11&
(0.499–2.10) Benzo[ghi]perylene 2.50
(0.355–3.04)
4.16 (0.355–4.74)
6.23 (5.28–7.55)
3.52 (3.10–4.42)
3.13 (2.80–3.39) Indeno[1,2,3-cd]pyrene 0.185+
(0.185–0.185)
0.185+
(0.185–0.185)
0.185+
(0.185–0.185)
0.185+
(0.185–0.185)
0.185&
(0.185–0.626)
ΣPAHs 154ab
(67.4–218)
107abc
(66.8–172)
104bce
(92.6–119)
46.8de
(40.1–54.9)
77.3cde
(47.4–130) Note: When a concentration of a compound was below the respective LOD, the value of LOD/√2 was used (Hornung and Reed, 1990).
a,b,c,d,eDifferent letters correspond to statistically different median (p
b0.05; non-parametric Mann–WhitneyUtest) between each group.
⁎ Detection frequency of each compound was 100% (unless otherwise indicated);
# 80%≤detection frequency b100%.
α 60%≤detection frequency
b80%. & 15%≤detection frequency
b60%. + Detection frequency
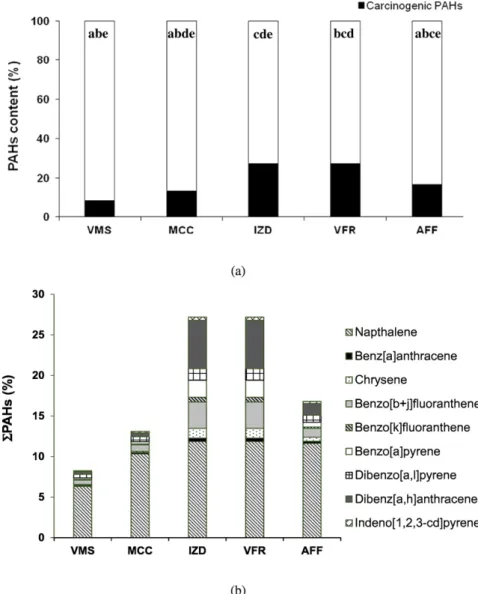
within the human body, being mostly eliminated through the urine in the form of glucuronide and sulphate conjugates (Kamal et al., 2015). Within this biological process, some reactive metabolites are formed and tend to bind with some macromolecules, including the DNA, thus leading to the formation of mutations and tumours that can evolve to cancer (Abdel-Shafy and Mansours, 2016). Out of 18 analysed PAHs, nine are considered as possible or probable carcinogens (IARC, 2002, 2010b) (Nap, B[a]A, Chry, B[b]F, B[j]F, B[k]F, D[a,l]P, D[a,h]A and InP) whereas B[a]P is classified as human known (class 1) carcinogen. Re-garding the obtained levels, the highest median ofΣPAHscarcwas ob-served at IZD (20.2 ng m−3) being rather similar (p= 0.129–0.796) at the remainingfire corporations (12.7–14.0 ng m−3). These concentra-tions ranged from 8.2% (VMS) to 27% ofΣPAHs (at VFR) (Fig. 2a). Nap (Fig. 2b) was the most predominant carcinogen and accounted for 44% (IZD and VFR) to 59% ofΣPAHscarc(at MCC). The concentrations of this carcinogenic obtained in the breathing zones of the characterized firefighters were below the recommended guidelines of 50 mg m−3 designated by NIOSH for the occupational exposure (Table 6S). D[a,h]A was the another abundant carcinogenic PAH (accounted for 9–22% ofΣPAHscarcat IZD, VFR and AFF) being followed by B[b + j]F (2–12% ofΣPAHscarc). Finally, B[a]P accounted for 2–8% ofΣPAHscarc. Its levels in breathing zone offirefighters (in non-fire settings) fulfilled
the ambient air guideline of 1 ng m−3(Directive 2004/107/EC, 2005) (as no specific occupational guideline is established for this PAH).
3.2. Source identification
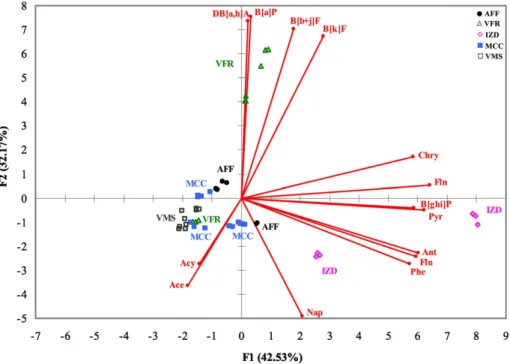
Fig. 3shows principal component analysis (PCA) for PAHs data set obtained in this work. Factors with eigenvaluesN1 were extracted and
Kaiser-Meyer-Olkin measure of sampling adequacyN0.5 was used
(B[a]A was excluded as it presented valueb0.5). The PCA model
result-ed in two significant factors (F1 and F2) that represented 74.70% of the total variability (Table 7S). F1 contributed 42.53% of the original data with high loadings (square cosines valuesN0.712) for Flu, Phe, Ant,
Fln, Pyr, Chry, and B[ghi]P. This factor allowed discrimination of mainly subjects of IZDfire stations from the other corporations, and in some ex-tend also from VMS. High loadings of Flu, Ant, Fln and Pyr indicates wood combustion or biomass burning (Deka et al., 2016; Lu et al., 2016). Coal combustion also release PAHs such as Phe and Chry (Deka et al., 2016; Harrison et al., 1996; Ho et al., 2002; Simcik et al., 1999). High loadings of Fln, Pyr and B[ghi]P were also reported for vehicular emissions (Khalili et al., 1995). The values obtained for Fln/ (Fln + Pyr) diagnostic ratio (Table 3), that can differentiate between coal combustion (0.52) and vehicular emissions (0.40–0.50), points
Fig. 2.Carcinogenic PAHs in breathing zones of studied population offirefighters atfivefire stations (Vimioso (VMS), Macedo de Cavaleiros (MCC), Izeda (IZD), Vila Flor (VFR), Alfândega da Fé (AFF)): (a) contribution (%) of carcinogenic PAHs (ΣPAHscar) vs. total PAH (ΣPAHs) content; and (b) individual carcinogenic PAHs.a, b, c, d, eSame letters in a box plot indicate that
towards the latter source; the respective values ranged between 0.40 (at AFF) and 0.50 (at VMS). However, the results of InP/(InP + B[ghi]P (distinguishes between vehicular emissions, wood, and coal combus-tions;Kavouras et al., 2001; Rogge et al., 1993a; Sicre et al., 1987; Grimmer et al., 1983; Pio et al., 2001) and B[ghi]P/B[a]P (vehicular emis-sions vs. road dust;Oda et al., 2001; Rogge et al., 1993a, 1993b) were in-conclusive. Thus, it seems that F1 represented contributions from mixed sources. It is though necessary to remark that both these ratios contained B[ghi]P, a considered marker of vehicular (diesel) emissions. However, some studies that investigated PAHs origin in different Portu-guese metropolitan areas (Alves et al., 2016; Cachada et al., 2012; Castro et al., 2009; Slezakova et al., 2010, 2011, 2013a, 2013b), did not report B[ghi]P as the predominant compound (though it was abundant, and traffic emissions were identified as the major source). Instead, the au-thors reported higher abundances of other indicators: Pyr, B[b + j]F, D[a,h]A (Callén et al., 2013; Ravindra et al., 2008).
F2 represented 32.17% of the original data variance and allowed the discrimination of VFR individuals from the others. F2 was highly loaded (square cosinesN0.747) for B[b + j]F, B[k]F, B[a]P and DB[ah]A), and
much less for Nap (square cosines value of 0.389). The high loadings of B[b]F and B[a]P were reported for gasoline emissions (Chen et al., 2016; Guo et al., 2003), whereas high loadings of B[k]F, B[a]P and DB[ah]A are indicative of diesel emissions (Ravindra et al., 2008; Teixeira et al., 2013). In general, vehicular emissions are a common major source of PAHs in ambient air (Slezakova et al., 2010, 2013a, 2013b) and indoor infiltrations result from poorlyfitted windows, doors, building cracks, and ventilation systems (WHO, 2010). In agree-ment, B[a]A/Chry (N0.35 at allfire houses) indicated fuel combustion
and car exhausts (Krugly et al., 2014) and the values of B[b]F/B[k]F ratios (N0.5 at allfire corporations) also pointed towards impacts of traffic emissions at the fire houses, specifically from diesel emissions (Ravindra et al., 2008). Thesefindings were expected. Firstly, diesel is the most used car fuel in Portugal (~80% of the total car fuel consump-tion;INE, 2015), and secondly it was the fuel used for vehicles and firefighting trucks in allfire facilities. The ambient air emissions and car exhausts (from garages/truck bays) may infiltrate indoors (to living quarters, common areas and control centers). Nevertheless, B[b + k]F/-B[ghi]P that can differentiate between various vehicle emissions (1.60: diesel; 0.33: gasoline;Li and Kamens, 1993) indicated a contribution
mostly from gasoline exhausts at allfire corporations. In addition, B[a]P/(B[a]P + Chry) and Flu/(Flu + Pyr) ratios that can also be used to distinguish between both types of exhausts (Ravindra et al., 2008) suggested predominance of gasoline emissions at VFR, diesel emissions at IZD, and mixed contribution from both diesel and gasoline emissions atfirehouses VMS, MCC and AFF.
Nap results from unburned fossil derived fuel or alkyl substituted PAHs and indicates petrogenic source (Chen et al., 2016). In addition, petrogenic origin of unburned petroleum, gasoline and diesel emissions have been reported for dominant 2–and 3–ring PAHs (Yunker et al., 2002). In agreement, the diagnostic ratios of low molecular PAHs vs. high molecular weight congeners (Table 3) wereN1 indicating
contri-butions of petrogenic sources at allfire corporations. Petrogenic sources were also identified with Phe/(Phe + Ant) valuesN0.7, implying the use
of lubricant oils (Mirante et al., 2013). F2 thus represented a mixed con-tribution of petrogenic and pyrogenic sources. Still, it is necessary to em-phasize that diagnostic ratios are merely rudimentary indicators of PAHs origin (Galarneau, 2008). Numerous studies have highlighted the limitations of this method as values can be altered to a different ex-tent due to environmental degradation and phase transfers (Dvorská et al., 2011; Galarneau, 2008; Katsoyiannis et al., 2007, 2011; Tobiszewski and Namieśnik, 2012; Usenko et al., 2010) and/or reactions between PAHs and other gaseous pollutants (ozone, nitrogen oxides; Ravindra et al., 2008). Some of the technical literature concerning PAHs emission signatures is rather old and lacks information on molec-ular signatures of new generation vehicles, biomass burning technolo-gies, boilers and waste treatment plants (Finardi et al., 2015); the available reference values of currently used diagnostic ratios may be un-usable to clearly assign PAHs to specific sources.
3.3. Risk assessment of PAHs
Because of its high TEF, D[a,h]A was the predominant PAH to ΣB[a]Peq(~80% at VMS, MCC and IZD; ~90% at VFR and AFF;Table 4) being followed by B[a]P (6–7% at VFR and AFF; 9% VMS, MCC and IZD). B[a]Peqwere also assessed using TEF values by Muller (Boström et al., 2002; Table 8S) who included D[a,l]P (TEF of 100); this PAH was the largest contributor (95–99%) toΣB[a]Peq. Despite strong arguments that support monitoring and assessment of D[a,l]P (Boström et al., 2002;
Okona-Mensah et al., 2005), thesefindings need to be carefully implied as at allfire stations D[a,l]P levels were below its LOD (Table 2). Nap (~6–16% ofΣPAHs;Table 2) contributedb1% toΣB[a]Peq(Table 4and 8S).
At allfire corporations lung cancer risks (8.9 × 10⁻⁵–4.4 × 10⁻⁴) exceeded (9–44 times) the WHO health–based recommend guideline of 10−5(Boström et al., 2002).
Total ILR (Fig. 4) were the lowest at MCC (median of 1.94 × 10⁻⁸) and the highest at AFF (median of 1.22 × 10⁻⁷); the remaining three fire corporations exhibited similar levels (p= 437–0.630) risks. Both total and individual ILR (Table 9S) wereb10−6and thus considered as
negligible. Corporations VMS and VFR exhibited higher ILR ranges than at other stations. At VMS, high ILR maxima were caused by long ex-posure duration offirefighting subjects (employedN25 years;Table 1).
At VFR, high values were due to overall higher exposure of some sub-jects (ΣPAHs up to 731 ng m−3). ILR pro
files of these subjects (results not shown) were dominated by D[a,h]A (70%), B[a]P (18%), B[j + j]F (3%). These PAHs (considered as traffic emissions markers) were the major contributors to F2 of PCA (Fig. 3) and allowed differentiation (67%) of VFR subjects; the respective workers spent majority of their shift in garage/truck bays (repair tasks). Nap contributed ~23% of total ILR (11% at VFR–34% at IZD). It needs to be emphasize that in a view of its existing guidelines (occupational exposure and indoor air quality),
Table 3
Diagnostic ratios for PM2.5–bound PAHs in the breathing zone offirefighters atfivefire stations (Vimioso (VMS), Macedo de Cavaleiros (MCC), Izeda (IZD), Vila Flor (VFR), Alfândega da Fé
(AFF)).
Ratio This study Value Source Reference VMS MCC IZD VFR AFF
ΣPAHsLMW/ΣPAHsHMWa 30.9
± 13.5 16.1 ± 6.8 7.0 ± 4.3 5.8 ± 4.0 9.3 ± 4.4
N1 Petrogenic (Zhang et al., 2008) b1 Pyrogenic
Fln/(Fln + Pyr) 0.50 ± 0.09 0.46 ± 0.09 0.48 ± 0.07 0.44 ± 0.26 0.40 ± 0.16
0.40–0.5 Vehicular traffic
(Kavouras et al., 1999; Yunker et al., 2002; Zencak et al., 2007; Rogge et al., 1993a; Oda et al., 2001)
N0.5 Coal
combustion 0.42, 0.52 Road dust InP/(InP + B[ghi]P) 0.06
± 0.04 0.05 ± 0.03 0.03 ± 0.01 0.10 ± 0.08 0.07 ± 0.06
0.21–0.22 Gasoline cars (Gogou et al., 1996; Grimmer et al., 1983; Kavouras et al., 2001; Pio et al., 2001; Ravindra et al., 2008; Rogge et al., 1993a; Sicre et al., 1987) 0.35–0.70 Diesel
emissions 0.56 Coal
combustion 0.62 Wood
combustion 0.36 Road dust B[ghi]P/B[a]P 12.6
± 9.6 13.4 ± 4.6 22.7 ± 4.5 6.0 ± 3.9 8.0 ± 2.2
1.2–2.2 Diesel cars (Oda et al., 2001; Rogge et al., 1993a, 1993b) 2.5–3.3 Gasoline cars
0.86, 0.91 Road dust B[a]A/Chry 2.36
± 1.88 1.25 ± 0.32 0.80 ± 0.87 0.87 ± 0.63 0.64 ± 0.56 N
0.35 Fuel combustion
(Krugly et al., 2014) B[b]F/B[k]F 8.1
± 3.6 6.3 ± 2.3 5.5 ± 1.18 6.3 ± 1.1 6.0 ± 0.5
N0.5 Diesel (Ravindra et al., 2008)
B[a]A/(B[a]A + Chry) 0.64 ± 0.13 0.55 ± 0.07 0.38 ± 0.31 0.41 ± 0.20 0.40 ± 0.19 0.40, 0.38–0.64
Diesel (Li and Kamens, 1993; Manoli et al., 2004; Sicre et al., 1987) 0.76 Gasoline
0.43 Wood combustion B[b + k]F/B[ghi]P 0.41
± 0.15 0.30 ± 0.15 0.19 ± 0.01 0.45 ± 0.12 0.30 ± 0.04
1.60 Diesel cars (Li and Kamens, 1993) 0.33 Gasoline cars
2.18 Wood combustion B[a]P/(B[a]P + Chry) 0.71
± 0.11 0.66 ± 0.07 0.49 ± 0.37 0.72 ± 0.17 0.52 ± 0.22
0.5 Diesel (Ravindra et al., 2008) 0.73 Gasoline
Flu/(Flu + Pyr) 0.59 ± 0.22 0.60 ± 0.19 0.53 ± 0.16 0.39 ± 0.11 0.44 ± 0.08 N
0.5 Diesel (Ravindra et al., 2008)
b0.5 Gasoline
Phe/(Phe + Ant) 0.95 ± 0.03 0.95 ± 0.01 0.97 ± 0.01 0.95 ± 0.03 0.96 ± 0.01
N0.7 Lubricant oils
and fossil fuels
(Mirante et al., 2013)
Nap–naphthalene, Acy–acenaphthylene; Ace–acenaphthene, Flu–fluorene, Phe–phenanthrene, Ant–anthracene, Fln–fluoranthene, Pyr–pyrene, B[a]A–benz[a]anthracene, Chry–
chrysene, B[b + j]F–benzo[b + j]fluoranthene, B[k]F–benzo[k]fluoranthene, B[a]P–benzo[a]pyrene, D[a,h]A–dibenz[a,h]anthracene, B[ghi]P–benzo[ghi]perylene, InP–indeno[1,2,3–
cd]pyrene;
aΤotal concentration of 2
–and 3–rings PAHs (ΣPAHsLMW), and 4–6–rings PAHs (ΣPAHsHMW);
Table 4
Toxicity equivalent concentrations based on toxicity of benzo[a]pyrene (B[a]Peq) of PM2.5–
bound PAHs (pg m−3) in the breathing air zone of
firefighters atfivefire stations (Vimioso (VMS), Macedo de Cavaleiros (MCC), Izeda (IZD), Vila Flor (VFR), Alfândega da Fé (AFF)) using toxic equivalency factors (TEF) set by Nisbeth and LaGoy (Boström et al., 2002).
Compound TEF VMS MCC IZD VFR AFF Naphthalene 0.001 9.78 11.01 16.33 5.54 8.98 Acenaphthylene 0.001 68.70 24.01 37.26 24.01 53.02 Acenaphthene 0.001 65.79 58.22 25.01 1.62 1.62 Fluorene 0.001 0.40 0.67 1.36 0.27 0.70 Phenanthrene 0.001 3.54 4.51 9.55 3.14 4.35 Anthracene 0.01 2.23 2.23 3.30 2.23 2.23 Fluoranthene 0.001 0.35 0.35 1.82 0.72 0.60 Pyrene 0.001 0.29 0.57 2.24 0.55 0.72 Benz[a]anthracene 0.1 20.50 20.50 25.65 20.50 20.50 Chrysene 0.01 1.45 1.45 9.37 5.61 3.90 Benzo[b + j]fluoranthene 0.1 84.43 84.43 84.43 151.3 84.43 Benzo[k]fluoranthene 0.1 13.39 13.39 18.06 28.11 13.39 Benzo[a]pyrene 1 276.5 276.5 276.5 977.5 448.5 Dibenzo[a,l]pyrene n.a.
Dibenz[a,h]anthracene 5 2495 2495 2495 13,933 5566 Benzo[ghi]perylene 0.01 25.02 41.62 62.34 35.19 31.35 Indeno[1,2,3-cd]pyrene 0.1 18.53 18.53 18.53 18.53 18.53
ΣB[a]Peq − 3086 3053 3087 15,208 6260 ΣB[a]Peqcarc − 2920 2921 2944 15,140 6165
Nap should be routinely monitored when assessing the respective risks. Finally, the risk analysis of Nap might be underestimated to some ex-tent; unlike other considered PAHs (B[a]A, Chry, B[b]F, B[k]F, B[a]P, D[a,h]A and InP) Nap is predominantly present in vapour phase (Castro et al., 2011; Ravindra et al., 2006, 2008; Slezakova et al., 2011) which was not included in this work.
4. Conclusions
This study reports information concerning occupational exposure to PAHs forfirefighters in non-fire settings once limited information (and from non-European) settings exists. The obtained levels of PAHs ful-filled all existent occupational exposure limits as well air quality guide-lines. Light molecular weight PAHs (2–3 rings) were the most predominant congeners (74–96% ofΣPAHs) whereas compounds with 5–6 rings accounted for much less content (3–9% ofΣPAHs). The source analysis indicated mixed contributions from pyrogenic and petrogenic sources (fuel and wood combustions, vehicular emissions from both diesel and gasoline fuelled cars, and usage of lubricant oils) for personal PAHs exposure at the studiedfire corporations.
The incremental lifetime cancer risks (based on USEPA methodolo-gy) due to exposure to airborne PAHs were below the recommend guideline of 10−6and thus can be considered as negligible for studied subjects. However, WHO health–based guideline level of 10−5was exceeded at allfivefire corporations (9–44 times). Therefore, the re-spective exposures to these compounds should be carefully controlled for these occupational settings. From the health perspective, monitoring of the potential occupational health effects should be carried on in order to better understand PAH quantitative exposure–response relationships.
Finally, the present study included assessment of occupational expo-sure to PAHs during a summer season when the risks and frequency of forestfires are the highest. However, as demonstrated, atmospheric emissions impacted on background levels of occupational exposure of firefighters. Therefore, future studies evaluating occupational exposure should be also conducted during cold seasons when concentrations of ambient PAHs are increased, typically due to house heating emissions.
Funding
This work was supported by European Union (FEDER funds through COMPETE) and National Funds (Fundação para a Ciência e Tecnologia)
through projects UID/QUI/50006/2013, POCI/01/0145/FEDER/007265 and UID/EQU/00511/2013, by the FCT/MEC with national funds and co-funded by FEDER in the scope of the P2020 Partnership Agreement. Additionalfinancial support was provided by Fundação para Ciência e Tecnologia through fellowships SFRH/BD/80113/2011 and SFRH/BPD/ 105100/2014.
Ethical statement
All participants of the study were informed and signed the respec-tive consent forms.
Acknowledgments
This work was supported by European Union (FEDER funds through COMPETE) and National Funds (Fundação para a Ciência e Tecnologia) through projects UID/QUI/50006/2013, POCI/01/0145/FEDER/007265 and UID/EQU/00511/2013-LEPABE, by the FCT/MEC with national funds and co-funded by FEDER in the scope of the P2020 Partnership Agree-ment. Additionalfinancial support was provided byFundação para Ciência e Tecnologiathrough fellowships SFRH/BD/80113/2011 and SFRH/BPD/105100/2014.
The authors are thankful to allfirefighters involved in the study and to collaborators from Escola Superior de Saúde from Instituto Politécnico de Bragança.
Appendix A. Supplementary data
Supplementary data to this article can be found online athttp://dx. doi.org/10.1016/j.scitotenv.2017.03.081.
References
Abdel-Shafy, H.I., Mansours, M.S.M., 2016.A review on polycyclic aromatic hydrocarbons: source, environmental impact, effect on human health and remediation. Egypt. J. Pet. 25, 107–123.
Agency for Toxic Substances and Disease Registry (ATSDR), 2016. Environmental Health and Medicine Education–Polycyclic Aromatic Hydrocarbons, Agency for Toxic Sub-stances and Disease Registry. (available from:).http://www.atsdr.cdc.gov/csem/ pah/docs/pah.pdf.
Alexander, B.M., Baxter, C.T., 2014.Plasticizer contamination offirefighter personal pro-tective clothing–a potential factor in increased health risks infirefighters. J. Occup. Environ. Hyg. 11, D43–D48.
Alves, C.A., Vicente, A.M.P., Gomes, J., Nunes, T., Duarte, M., Bandowe, B.A.M., 2016. Poly-cyclic aromatic hydrocarbons (PAHs) and their derivatives (oxygenated-PAHs, nitrated-PAHs and azaarenes) in size-fractionated particles emitted in an urban road tunnel. Atmos. Res. 180 (1), 128–137.
Annesi-Maesano, I., Moreau, D., Caillaud, D., Lavaud, F., Le Moullec, Y., Taytard, A., Pauli, G., Charpin, D., 2007.Residential proximityfine particles related to allergic sensitisation and asthma in primary school children. Respir. Med. 101, 1721–1729.
Baxter, C.T., Hoffman, J.D., Knipp, M.J., Reponen, T., Haynes, E.N., 2014.Exposure offi re-fighters to particulates and polycyclic aromatic hydrocarbons. J. Occup. Environ. Hyg. 11, D85–D91.
Boffetta, P., Jourenkova, N., Gustavsson, P., 1997.Cancer risk from occupational and envi-ronmental exposure to polycyclic aromatic hydrocarbons. Cancer Causes Control 8, 444–472.
Bolstad-Johnson, D.M., Burgess, J.L., Crutchfield, C.D., Storment, S., Gerkin, R., Wilson, J.R., 2000.Characterization offirefighter exposures duringfire overhaul. Am. Ind. Hyg. Assoc. J. 61 (5), 636–641.
Booze, T.F., Reinhardt, T.E., Quiring, S.J., Ottmar, R.D., 2004.A screening-level assessment of the health risks of chronic smoke exposure for wildlandfirefighters. J. Occup. En-viron. Hyg. 1, 296–305.
Boström, C.E., Gerde, P., Hanberg, A., Jernstrom, B., Johansson, C., Kyrklund, T., Rannug, A., Tornqvist, M., Victorin, K., Westerholm, R., 2002.Cancer risk assessments, indicators, and guidelines for polycyclic aromatic hydrocarbons in the ambient air. Environ. Health Perspect. 10, 451–488.
Brucker, N., Charão, M.F., Moro, A.M., Ferrari, P., Bubols, G., Sauer, E., Fracasso, R., Durgante, J., Thiesen, F.V., Duarte, M.M., Gioda, A., Castro, I., Saldiva, P.H., Garcia, S.C., 2014.Atherosclerotic process in taxi drivers occupationally exposed to air pollu-tion and co-morbidities. Environ. Res. 131, 31–38.
Burstyn, I., Kromhout, H., Partanen, T., Svane, O., Langård, S., Ahrens, W., Kauppinen, T., Stücker, I., Shaham, J., Heederik, D., Ferro, G., Heikkilä, P., Hooiveld, M., Johansen, C., Randem, B.G., Boffetta, P., 2005.Polycyclic aromatic hydrocarbons and fatal ischemic heart disease. Epidemiology 6 (6), 744–750.
Fig. 4.Incremental lifetime cancer risks (ΣILR;■Median;□25–75%, and range) in breathing zones of studied population offirefighters atfivefire stations (Vimioso (VMS), Macedo de Cavaleiros (MCC), Izeda (IZD), Vila Flor (VFR), Alfândega da Fé (AFF)).a, b, c, d, eSame letters in a box plot indicate that given means are not statistically different
Cachada, A., Pato, P., Rocha-Santos, T., da Silva, E.F., Duarte, A.C., 2012.Levels, sources and potential human health risks of organic pollutants in urban soils. Sci. Total Environ. 430, 184–192.
Callén, M.S., López, J.M., Iturmendi, A., Mastral, A.M., 2013.Nature and sources of particle associated polycyclic aromatic hydrocarbons (PAH) in the atmospheric environment of an urban area. Environ. Pollut. 183, 166–174.
Castro, D., Slezakova, K., Delerue-Matos, C., Alvim-Ferraz, M., Morais, S., Pereira, M.C., 2011.Polycyclic aromatic hydrocarbons in gas and particulate phases of indoor envi-ronment influenced by tobacco smoke: levels, phase distribution and health risks. Atmos. Environ. 45, 1799–1808.
Castro, D., Slezakova, K., Oliva-Teles, M.T., Delerue-Matos, C., Alvim-Ferraz, M.C., Morais, S., Pereira, M.C., 2009.Analysis of polycyclic aromatic hydrocarbons in atmospheric particulate samples by microwave–assisted extraction and liquid chromatography. J. Sep. Sci. 32, 501–510.
Chen, Y.C., Chiang, H.C., Hsu, C.Y., Yang, T.T., Lin, T.Y., Chen, M.J., Chen, N.T., Wu, Y.S., 2016.
Ambient PM2.5-bound polycyclic aromatic hydrocarbons (PAHs) in Changhua Coun-ty, Central Taiwan: seasonal variation, source apportionment and cancer risk assess-ment. Environ. Pollut. 218, 372–382.
Chen, C., Zhao, B., Zhou, W.T., Jiang, X.Y., Tan, Z.C., 2012.A methodology for predicting par-ticle penetration factor through cracks of windows and doors for actual engineering application. Build. Environ. 47, 339–348.
Daniels, R.D., Kubale, T.L., Yiin, J.H., Dahm, M., Hales, T.R., Baris, D., Zahm, S.H., Beaumont, J.J., Waters, K.M., Pinkerton, L.E., 2013.Mortality and cancer incidence in a pooled co-hort of USfirefighters from San Francisco, Chicago, and Philadelphia (1950–2009). Occup. Environ. Med. 71 (6), 388–397.
Deka, J., Sarma, K.P., Hoque, R.R., 2016.Source contributions of polycyclic aromatic hydro-carbons in soils around oilfield in the Brahmaputra Valley. Ecotoxicol. Environ. Saf. 133, 281–289.
De Vos, A.J.B.M., Reisen, F., Cook, A., Devine, B., Weinstein, P., 2009.Respiratory irritants in Australian bushfire smoke: air toxics sampling in a smoke chamber and during pre-scribed burns. Arch. Environ. Contam. Toxicol. 56, 380–388.
Diggs, D.L., Huderson, A.C., Harris, K.L., Myers, J.N., Banks, L.D., Rekhadevi, P.V., Niaz, M.S., Ramesh, A., 2011.Polycyclic aromatic hydrocarbons and digestive tract cancers: a per-spective. J. Environ. Sci. Health C Environ. Carcinog. Ecotoxicol. Rev. 29 (4), 324–357.
Directive 2004/107/EC, 2005.Directive of the European Parliament and of the council re-lating to arsenic, cadmium, mercury, nickel and polycyclic aromatic hydrocarbons in ambient air. Off. J. Eur. Union L23, 3–16.
Dvorská, A., Lammel, G., Klánová, J., 2011.Use of diagnostic ratios for studying source ap-portionment and reactivity of ambient polycyclic aromatic hydrocarbons over Central Europe. Atmos. Environ. 45, 420–427.
Estrellan, C.R., Lino, F., 2010.Toxic emissions from open burning. Chemosphere 80, 193–207.
Fabian, T.Z., Borgerson, J.L., Gandhi, P.D., Baxter, C.S., Ross, C.S., Lockey, J.E., Dalton, J.M., 2014.Characterization of firefighter smoke exposure. Fire. Technol 50, 993–1019.
Fent, K.W., Eisenberg, J., Snawder, J., Sammons, D., Pleil, J.D., Stiegel, M.A., Mueller, C., Horn, G.P., Dalton, J., 2014.Systemic exposure to PAHs and benzene infirefighters suppressing controlled structurefires. Ann. Occup. Hyg. 58, 830–845.
Fent, K.W., Eisenberg, J., Evans, D., Sammons, D., Robertson, S., Striley, C., Snawder, J., Mueller, C., Kochenderfer, V., Pleil, J., Stiegel, M., Horn, G.P., 2013.Evaluation of der-mal exposure to polycyclic aromatic hydrocarbons infirefighters. Health Hazard Evaluation Report No. 2010-0156-3196. United States Department of Health and Human Services, Centers for Disease Control and Prevention, National institute for Occupational Safety and Health.
Fent, K.W., Evans, D.E., 2011.Assessing the risk tofirefighters from chemical vapors and gases during vehiclefire suppression. J. Environ. Monit. 13, 536–543.
Finardi, S., Radice, P., Cecinato, A., Gariazzo, C., Gherardi, M., Romagnoli, P., 2015. Seasonal variation of PAHs concentration and source attribution through diagnostic ratios analysis. Urban Clim. (in press).10.1016/j.uclim.2015.12.001.
Galarneau, E., 2008.Source specificity and atmospheric processing of airborne PAHs: im-plications for source apportionment. Atmos. Environ. 42, 8139–8149.
Gaughan, D.M., Piacitelli, C.A., Chen, B.T., Law, B.F., Virji, M.A., Edwards, N.T., Enright, P.L., Schwegler-Berry, D.E., Leonard, S.S., Wagner, G.R., Kobzik, L., Kales, S.N., Hughes, M.D., Christiani, D.C., Siegel, P.D., Cox-Ganser, J.M., Hoover, M.D., 2014a.Exposures and cross-shift lung function declines in wildlandfirefighters. J. Occup. Environ. Hyg. 11, 591–603.
Gaughan, D.M., Siegel, P.D., Hughes, M.D., Chang, C.-Y., Law, B.F., Campbell, C.R., Richards, J.C., Kales, S.F., Chertok, M., Kobzik, L., Nguyen, P.-son., O'Donnell, C.R., Kiefer, M., Wagner, G.R., Christiani, D.C., 2014b.Arterial stiffness, oxidative stress, and smoke ex-posure in wildlandfirefighters. Am. J. Ind. Med. 57, 748–756.
Gogou, A., Stratigakis, N., Kanakidou, M., Stefanou, E.G., 1996.Organic aerosols in eastern Mediterranean: components source reconciliation by using molecular markers and atmospheric back trajectories. Org. Geochem. 25, 79–96.
Grimmer, G., Jacob, J., Naujack, K.W., Dettbarn, G., 1983.Determination of polycyclic aro-matic compounds emitted from brown-coal-fired residential stoves by gas chroma-tography/gas spectrometry. Anal. Chem. 55, 892–900.
Guo, H., Lee, S.C., Ho, K.F., Wang, X.M., Zou, S.C., 2003.Particle-associated polycyclic aro-matic hydrocarbons in urban air of Hong Kong. Atmos. Environ. 37, 5307–5317.
Hanedar, A., Alp, K., Kaynak, B., Avşar, E., 2014.Toxicity evaluation and source apportion-ment of polycyclic aromatic hydrocarbons (PAHs) at three stations in Istanbul, Turkey. Sci. Total Environ. 488–489, 437–446.
Harrison, R.M., Smith, D.J.T., Luhana, L., 1996.Source apportionment of atmospheric poly-cyclic aromatic hydrocarbons collected from an urban location in Birmingham, UK. Environ. Sci. Technol. 30, 825–832.
Ho, K.F., Lee, S.C., Chiu, G.M.Y., 2002.Characterization of selected volatile organic com-pounds, polycyclic aromatic hydrocarbons and carbonyl compounds at a roadside monitoring station. Atmos. Environ. 36, 57–65.
Hornung, R.W., Reed, L.D., 1990.Estimation of average concentration in the presence of nondetectable values. J. Occup. Environ. Hyg. 5, 46–51.
IARC Working Group on the Evaluation of Carcinogenic Risks to Humans (IARC), 2002.
Some traditional herbal medicines, some mycotoxins, naphthalene and styrene. IARC Monogr. Eval. Carcinog. Risks Hum. 82, 1–556.
IARC Working Group on the Evaluation of Carcinogenic Risks to Humans (IARC), 2010a.
Painting,firefighting and shiftwork. IARC Monogr. Eval. Carcinog. Risks Hum. 98, 9–764.
IARC Working Group on the Evaluation of Carcinogenic Risks to Humans (IARC), 2010b.
Some non-heterocyclic polycyclic aromatic hydrocarbons and some related expo-sures. IARC Monogr. Eval. Carcinog. Risks Hum. 92, 1–853.
Instituto Nacional de Estatística (INE), 2015.Statistical Yearbook of Norte Region 2014. Instituto Nacional de Estatística, I.P., Lisbon Portugal.
Jeng, A., Pan, C.H., Diawara, N., Chang-Chien, G.P., Lin, W.Y., Huang, C.T., Ho, C.K., Wu, M.T., 2011.Polycyclic aromatic hydrocarbon-induced oxidative stress and lipid peroxida-tion in relaperoxida-tion to immunological alteraperoxida-tion. Occup. Environ. Med. 68 (9), 653–658.
Jia, C., Batterman, S., 2010.Critical review of naphthalene sources and exposures relevant to indoor and outdoor air. Int. J. Environ. Res. Public Health 7, 2903–2939.
Joint Research Centre, 2011.Forestfires in Europe 2010. Report 11. Joint Research Centre, Institute for Environment and Sustainability, Luxembourg: Publications Office of the European Union.
Joint Research Centre, 2015.Forestfires in Europe, Middle East and North Africa 2014. JRC Technical Reports, Joint Research Centre, Institute for Environment and Sustainabili-ty, Luxembourg: Publications Office of the European Union.
Kamal, A., Cincinelli, A., Martellini, T., Malik, R.N., 2015.Review of PAH exposure from the combustion of biomass fuel and their less surveyed effect on the blood parameters. Environ. Sci. Pollut. R. 22 (6), 4076–4098.
Katsoyiannis, A., Sweetman, A.J., Jones, K.C., 2011.PAH molecular diagnostic ratios applied to atmospheric sources: a critical evaluation using two decades of source inventory and air concentration data from the UK. Environ. Sci. Technol. 45, 8897–8906.
Katsoyiannis, A., Terzi, E., Cai, Q.-Y., 2007.On the use of PAH molecular diagnostic ratios in sewage sludge for the understanding of the PAH sources. Is this use appropriate? Chemosphere 69, 1337–1339.
Kavouras, I.G., Koutrakis, P., Tsapakis, M., Lagoudaki, E., Stephanou, E.G., Von Baer, D., Oyola, P., 2001.Source apportionment of urban particulate aliphatic and polynuclear aromatic hydrocarbons (PAHs) using multivariate methods. Environ. Sci. Technol. 35, 2288–2294.
Kavouras, I.G., Lawrence, J., Koutrakis, P., Stephanou, E.G., Oyola, P., 1999.Measurement of particulate aliphatic and polynuclear aromatic hydrocarbons in Santiago de Chile: source reconciliation and evaluation of sampling artifacts. Atmos. Environ. 33, 4977–4986.
Khalili, N.R., Scheff, P.A., Holsen, T.M., 1995.PAH sourcefingertrips for coke ovens, diesel and gasoline engines, highway tunnels, and wood combustion emissions. Atmos. En-viron. 29, 533–542.
Kim, K.H., Jahan, S.A., Kabir, E., Brown, R.J., 2013.A review of airborne polycyclic aromatic hydrocarbons (PAHs) and their human health effects. Environ. Int. 60, 71–80.
Kirk, K.M., Logan, M.B., 2015a.Firefighting instructors' exposures to polycyclic aromatic hydrocarbons during livefire training scenarios. J. Occup. Environ. Hyg. 12 (4), 227–234.
Kirk, K.M., Logan, M.B., 2015b.Structuralfirefighting ensembles: accumulation and off-gassing of combustion products. J. Occup. Environ. Hyg. 12 (6), 376–383.
Korashy, H.M., El-Kadi, A.O.S., 2006.The role of aryl hydrocarbon receptor in the patho-genesis of cardiovascular diseases. Drug Metab. Rev. 38 (3), 411–450.
Krugly, E., Martuzevicius, D., Sidaraviciute, R., Ciuzas, D., Prasauskas, T., Kauneliene, V., Stasiulaitiene, I., Kliucininkas, L., 2014.Characterization of particulate and vapor phase polycyclic aromatic hydrocarbons in indoor and outdoor air of primary schools. Atmos. Environ. 82, 298–306.
Kuang, D., Zhang, W., Deng, Q., Zhang, X., Huang, K., Guan, L., Hu, D., Wu, T., Guo, H., 2013.
Dose-response relationships of polycyclic aromatic hydrocarbons exposure and oxi-dative damage to DNA and lipid in coke oven workers. Environ. Sci. Technol. 47 (13), 7446–7456.
Laitinen, J., Mäkelä, M., Mikkola, J., Huttu, I., 2010.Firefighting trainers' exposure to car-cinogenic agents in smoke diving simulators. Toxicol. Lett. 192, 61–65.
Lee, M.S., Magari, S., Christiani, D.C., 2011.Cardiac autonomic dysfunction from occupational exposure to polycyclic aromatic hydrocarbons. Occup. Environ. Med. 68 (7), 474–478.
LeMasters, G.K., Genaidy, A.M., Succop, P., Deddens, J., Sobeih, T., Barriera-Viruet, H., Dunning, K., Lockey, J., 2006.Cancer risk amongfirefighters: a review and meta-analysis of 32 studies. J. Occup. Environ. Med. 48 (11), 1189–1202.
Lemieux, P.M., Lutes, C.C., Santoianni, D.A., 2004.Emissions of organic air toxics from open burning: a comprehensive review. Prog. Energ. Combust. 30, 1–32.
Lewtas, J., 2007.Air pollution combustion emissions: characterization of causative agents and mechanisms associated with cancer, reproductive, and cardiovascular effects. Mutat. Res.–Rev. Mutat. 637, 95–133.
Li, C.K., Kamens, R.M., 1993.The use of polycyclic aromatic hydrocarbons as source signa-tures in receptor modelling. Atmos. Environ. 27, 523–532.
Liu, S., Tao, S., Liu, W., Dou, H., Liu, Y., Zhao, J., Little, M.G., Tian, Z., Wang, J., Wang, L., Gao, Y., 2008.Seasonal and spatial occurrence and distribution of atmospheric polycyclic aromatic hydrocarbons (PAHs) in rural and urban areas of the North Chinese Plain. Environ. Pollut. 156 (3), 651–656.
Lu, W., Yang, L., Chen, J., Wang, X., Li, H., Zhu, Y., Wen, L., Xu, C., Zhang, J., Zhu, T., Wang, W., 2016.Identification of concentrations and sources of PM2.5-bound PAHs in North China during haze episodes in 2013. Air Qual. Atmos. Health 9 (7), 823–833.
Madureira, J., Paciência, I., Rufo, J., Severo, M., Ramos, E., Barros, H., de Oliveira Fernandes, E., 2016.Source apportionment of CO2, PM10 and VOCs levels and health risk assessment in naturally ventilated primary schools in Porto, Portugal. Build. Environ. 96, 198–205.
Manoli, E., Kouras, A., Samara, C., 2004.Profile analysis of ambient and source emitted particle-bound polycyclic aromatic hydrocarbons from three sites in northern Greece. Chemosphere 56, 867–878.
Melymuk, L., Robson, M., Helm, P.A., Diamon, M.L., 2012.PCBs, PBDEs, and PAHs in Toron-to air: spatial and seasonal trends and implications for contaminant transport. Sci. Total Environ. 429, 272–280.
Miranda, A.I., Martins, V., Cascão, P., Amorim, J.H., Valente, J., Tavares, R., Tchepel, O., Borrego, C., Cordeiro, C.R., Ferreira, A.J., Viegas, D.X., Ribeiro, L.M., Pita, L.P., 2010.
Monitoring offirefighters exposure to smoke duringfire experiments in Portugal. En-viron. Int. 36, 736–745.
Mirante, F., Alves, C., Pio, C., Pindado, O., Perez, R., Revuelta, M.A., Artiñano, B., 2013. Or-ganic composition of size segregated atmospheric particulate matter, during summer and winter sampling campaigns at representative sites in Madrid, Spain. Atmos. Res. 132–133, 345–361.
Montaño-Soto, T., Garza-Ocañas, L., Badillo-Castañeda, C., Garza-Ulloa, H., 2017. Determi-nation of polycyclic aromatic hydrocarbons in ambient particulate matter PM2.5 and 1-hydroxypyrene in children from an area near an oil refinery in Northeast Mexico. Hum. Ecol. Risk. Assess. 23 (1), 125–140.
Oda, J., Nomura, S., Yasuhara, A., Shibamoto, T., 2001.Mobile sources of atmospheric poly-cyclic aromatic hydrocarbons in a roadway tunnel. Atmos. Environ. 35, 4819–4827.
Okona-Mensah, K.W., Battershill, J., Boobis, A., Fielder, R., 2005.An approach to investigat-ing the importance of high potency polycyclic aromatic hydrocarbons (PAHs) in the induction of lung cancer by air pollution. Food Chem. Toxicol. 43, 1103–1116.
Oliveira, M., Slezakova, K., Delerue-Matos, C., Pereira, M.C., Morais, S., 2016a.Assessment of air quality in preschool environments (3-5 years old children) with emphasis on elemental composition of PM10 and PM2.5. Environ. Pollut. 214, 430–439.
Oliveira, M., Slezakova, K., Delerue-Matos, C., Pereira, M.C., Morais, S., 2016b.Assessment of polycyclic aromatic hydrocarbons in indoor and outdoor air of preschool environ-ments (3–5 years old children). Environ. Pollut. 208, 382–394.
Oliveira, M., Slezakova, K., Delerue-Matos, C., Pereira, M.C., Morais, S., 2015a.Polycyclic ar-omatic hydrocarbon emissions from forestfires: assessment offirefighters' exposure. In: Boone, C. (Ed.), Polycyclic Aromatic Hydrocarbons, Series: Environmental Science. Engineering and Technology. Nova Science Publishers, Hauppauge, New York, pp. 59–94.
Oliveira, M., Slezakova, K., Delerue-Matos, C., Pereira, M.C., Morais, S., 2015b.Polycyclic ar-omatic hydrocarbons: levels and phase distributions in preschool microenvironment. Indoor Air 25 (5), 557–568.
Perwak, J., Byrne, M., Coons, S., Goyer, M., Harris, J., Cruse, P., DeRosier, R., Moss, K., Wendt, S., 1982.An exposure and risk assessment for benzo[u]pyrene and other polycyclic aromatic hydrocarbons. Benzo[a]pyrene, Acenaphthylene, Benz[a]anthracene, Benzo[b]fluoranthene, Benzo[k]fluroanthene, Benzo[g,h,i]perylene, Chrysene, Dibenz[a,h]anthracene, and Indeno[l,2,3-c,a]pyrene. Volume 4. US Environmental Protection Agency, Office of Water Regulations and Standards, Washington, D.C.
Pleil, J.D., Stiegel, M.A., Fent, K.W., 2014.Exploratory breath analysis for assessing toxic dermal exposures offirefighters during suppression of structural burns. J. Breath Res. 8, 037107.
Pio, C.A., Alves, C.A., Duarte, A.C., 2001.Identification, abundance and origin of atmospher-ic organatmospher-ic partatmospher-iculate matter in a Portuguese rural area. Atmos. Environ. 35, 1365–1375.
Poirier, M.C., 2004.Chemical-induced DNA damage and human cancer risk. Nat. Rev. Can-cer 4, 630–637.
Pratt, M.M., John, K., MacLean, A.B., Afework, S., Phillips, D.H., Poirier, M.C., 2011. Polycy-clic aromatic hydrocarbon (PAH) exposure and DNA adduct semi-quantitation in ar-chived human tissues. Int. J. Environ. Res. Public Health 8 (7), 2675–2691.
Qi, H., Li, W.-L., Zhu, N.-Z., Ma, W.-L., Liu, L.-Y., Zhang, F., Li, Y.-F., 2014.Concentrations and sources of polycyclic aromatic hydrocarbons in indoor dust in China. Sci. Total Envi-ron. 491–492, 100–107.
Ravindra, K., László Bencs, L., Wauters, E., de Hoog, J., Felix Deutsch, F., Edward, Roekens E., Bleux, N., Berghmans, P., Van Grieken, R., 2006.Seasonal and site-specific variation in vapour and aerosol phase PAHs over Flanders (Belgium) and their relation with an-thropogenic activities. Atmos. Environ. 40 (4), 771–785.
Ravindra, K., Sokhi, R., Grieken, R.V., 2008.Atmospheric polycyclic aromatic hydrocarbons: source attribution, emission factors and regulation. Atmos. Environ. 42, 2895–2921.
Reinhardt, T.E., Ottmar, R.D., 2004.Baseline measurements of smoke exposure among wildlandfirefighters. J. Occup. Environ. Hyg. 1, 593–606.
Reisen, F., Brown, S.K., 2009.Australianfirefighters' exposure to air toxics during bushfire burns of autumn 2005 and 2006. Environ. Int. 35, 342–352.
Reisen, F., Brown, S., Cheng, M., 2006.Air toxics in bushfire smoke:firefighter's exposure during prescribed burns. Forest Ecol. Manag. 234, S144.
Rengarajan, T., Rajendran, P., Nandakumar, N., Lokeshkumar, B., Rajendran, P., Ikuo Nishigaki, I., 2015.Exposure to polycyclic aromatic hydrocarbons with special focus on cancer. Asian Pac. J. Trop. Biomed. 5 (3), 182–189.
Robinson, M.S., Anthony, T.R., Littau, S.R., Herckes, P., Nelson, X., Poplin, G.S., Burgess, J.L., 2008.Occupational PAH exposures during prescribed pile burns. Ann. Occup. Hyg. 52, 497–508.
Rogge, W.F., Hildemann, L.M., Mazurek, M.A., Cass, G.R., Simoneit, B.R.T., 1993a.Sources of fine organic aerosol. 2. Noncatalyst and catalystequipped automobiles and heavy-duty diesel trucks. Environ. Sci. Technol. 27, 636–651.
Rogge, W.F., Hildemann, L.M., Mazurek, M.A., Cass, G.R., Simoneit, B.R.T., 1993b.Sources of fine organic aerosol. 3. Road dust, tire debris and organometallic brake lining dust: roads as sources and sinks. Environ. Sci. Technol. 27, 1892–1904.
Rota, M., Bosetti, C., Boccia, S., Boffetta, P., La Vecchia, C., 2014.Occupational exposures to polycyclic aromatic hydrocarbons and respiratory and urinary tract cancers: an
updated systematic review and a meta-analysis to 2014. Arch. Toxicol. 88 (8), 1479–1490.
Shen, G., Wei, S., Zhang, Y., Wang, R., Wang, B., Li, W., Shen, H., Huang, Y., Chen, Y., Chen, H., Wei, W., Tao, S., 2012.Emission of oxygenated polycyclic aromatic hydrocarbons from biomass pellet burning in a modern burner for cooking in China. Atmos. Envi-ron. 60, 234–237.
Shen, B., Whitehead, T.P., McNeel, S., Brown, F.R., Dhaliwal, J., Das, R., Israel, L., Park, J.-S., Petreas, M., 2015.High levels of polybrominated diphenyl ethers in vacuum cleaner dust from Californiafire stations. Environ. Sci. Technol. 49, 4988–4994.
Sicre, M.A., Marty, J.C., Saliot, A., Aparicio, X., Grimalt, J., Albaiges, S., 1987.Aliphatic and aromatic hydrocarbons in different sized aerosols over the Mediterranean Sea: occur-rence and origin. Atmos. Environ. 21, 2247–2259.
Simcik, M.F., Eisenreich, S.J., Lioy, P.J., 1999.Source apportionment and source/sink rela-tionships of PAHs in the coastal atmosphere of Chicago and Lake Michigan. Atmos. Environ. 33, 5071–5079.
Slezakova, K., Castro, D., Begonha, A., Delerue-Matos, C., Alvim-Ferraz, M.C., Morais, S., Pereira, M.C., 2011.Air pollution from traffic emissions in Oporto, Portugal: health and environmental implications. Microchem. J. 99, 51–59.
Slezakova, K., Castro, D., Delerue-Matos, C., Alvim-Ferraz, M.C.M., Morais, S., Pereira, M.C., 2013a.Impact of vehicular traffic emissions on particulate-bound PAHs: levels and associated health risks. Atmos. Res. 127, 141–147.
Slezakova, K., Castro, D., Pereira, M.C., Morais, S., Delerue-Matos, C., Alvim-Ferraz, M.C., 2010.Influence of traffic emissions on the carcinogenic polycyclic aromatic hydrocar-bons in outdoor breathable particles. J. Air Waste Manage. Assoc. 60, 393–401.
Slezakova, K., Castro, D., Delerue-Matos, C., Morais, S., Pereira, M.C., 2014.Levels and risks of particulate-bound PAHs in indoor air influenced by tobacco smoke: afield mea-surement. Environ. Sci. Pollut. R. 21, 4492–4501.
Slezakova, K., Pires, J.C.M., Castro, D., Alvim-Ferraz, M.C.M., Delerue-Matos, C., Morais, S., Pereira, M.C., 2013b.PAH air pollution at a Portuguese urban area: carcinogenic risks and sources identification. Environ. Sci. Pollut. R. 20 (6), 3932–3945.
Soteriades, E.S., Smith, D.L., Tsismenakis, A.J., Baur, D.M., Kales, S.N., 2011.Cardiovascular disease in USfirefighters-a systematic review. Cardiol. Rev. 19, 202–215.
Tarantini, A., Maitre, A., Lefebvre, E., Marques, M., Rajhi, A., Douki, T., 2011.Polycyclic ar-omatic hydrocarbons in binary mixtures modulate the efficiency of benzo[a]pyrene to form DNA adducts in human cells. Toxicology 279, 36–44.
Teixeira, E., Mattiuzi, C., Agudelo-Castañeda, D., de Oliveira Garcia, K., Wiegand, F., 2013.
Polycyclic aromatic hydrocarbons study in atmosphericfine and coarse particles using diagnostic ratios and receptor model in urban/industrial region. Environ. Monit. Assess. 185, 9587–9602.
Tobiszewski, M., Namieśnik, J., 2012.PAH diagnostic ratios for the identification of pollu-tion emission sources. Environ. Pollut. 162, 110–119.
Tuntawiroon, J., Mahidol, C., Navasumrit, P., Autrup, H., Ruchirawat, M., 2007.Increased health risk in Bangkok children exposed to polycyclic aromatic hydrocarbons from traffic-related sources. Carcinogenesis 28, 816–822.
Usenko, S.L., Massey Simonich, K.J., Haggeman, J.E., Schrlau, L., Geiser, L., Campbell, D.H., Appleby, P.G., Landers, D.H., 2010.Sources and deposition of polycyclic aromatic hy-drocarbons to western U.S. National Parks. Environ. Sci. Technol. 44, 4512–4518.
U.S. Environmental Protection Agency (USEPA), 1989.Risk Assessment Guidance for Superfund, Vol. I: Human Health Evaluation Manual, EPA/540/1–89/002. Office of Emergency and Remedial Response, Washington, DC.
U.S. Environmental Protection Agency (USEPA), 1990.Compendium of methods for the determination of air pollutants in indoor air. Atmospheric Research and Exposure As-sessment Laboratory. Research Triangle Park, NC.
U.S. Environmental Protection Agency (USEPA), 2014. Priority pollutant list. Code of Fed-eral Regulations: 40 CFR Part 423, Appendix A Available from.https://www.epa.gov/ sites/production/files/2015-09/documents/priority-pollutant-list-epa.pdf. U.S. Environmental Protection Agency (USEPA), 2016. Risk–Based Concentration Table.
(retrieved from.bhttp://www.epa.gov/reg3hwmd/risk/human/rb-concentration_ table/usersguide.htmN, accessed in June 2016).
World Health Organization (WHO), 1987.Air Quality Guidelines for Europe. WHO Re-gional Office for Europe, Copenhagen, Denmark.
World Health Organization (WHO), 2000.Air Quality Guidelines for Europe. second ed. WHO Regional Office for Europe, Copenhagen, Denmark.
World Health Organization (WHO), 2010.WHO Guidelines for Indoor Air Quality: Select-ed Pollutants. Regional Office for Europe of the World Health Organization, Copenha-gen, Denmark.
World Health Organization (WHO), 2013.State of the Science of Endocrine Disrupting Chemicals 2012. United Nations Environment Programme and the World Health Or-ganization, Geneva.
World Health Organization, 2016. World health survey B–individual questionnaire 2002. World Health Organization Evidence and Information Policy (accessed in June 2016, available from:http://www.who.int/healthinfo/survey/whslongindividuala.pdf). Yunker, M.B., Macdonald, R.W., Vingarzan, R., Mitchell, R.H., Goyette, D., Sylvestre, S.,
2002.PAHs in the Fraser River basin: a critical appraisal of PAH ratios as indicators of PAH source and composition. Org. Geochem. 33, 489–515.
Zencak, Z., Klanova, J., Holoubek, I., Gustafsson, Ö., 2007.Source apportionment of atmo-spheric PAHs in theWestern Balkans by natural abundance radiocarbon analysis. En-viron. Sci. Technol. 41, 3850–3855.
Zhang, W., Zhang, S., Wan, C., Yue, D., Ye, Y., Wang, X., 2008.Source diagnostics of polycy-clic aromatic hydrocarbons in urban road runoff, dust, rain and canopy through fall. Environ. Pollut. 153, 594–601.