Tortuosity variation in a low density binary particulate bed
Ricardo Dias, Jos´e A. Teixeira, Manuel Mota
∗, Alexander Yelshin
Centro de Eng. Biol´ogica, IBQF, University of Minho, Campus de Gualtar, 4710-057 Braga, Portugal
Received 19 June 2005; received in revised form 26 January 2006; accepted 27 January 2006
Abstract
The importance of particle size ratio and particle composition in the properties of a mixed bed is well known. Nevertheless, the dependence of the bed channel tortuosityTon the porosityεin the formT= 1/εn, wherenis assumed to be a constant, shows that the value ofndepends on the properties
of the packed bed. For loose packing, experimental data for binary mixtures of glass beads of a size ratio from 1 up to 53.8 was analysed in terms of porosity, tortuosity and permeability. The packing procedure was performed without intensive compacting methods e.g. vibration, etc. Obtained results show that the parameternis a function of the volume fraction of large particlesxDand, for spherical particles, lies in the range 0.4–0.5. The
explanation for this variation is (1) a distortion effect on the small particles arrangement occurring near the large particle surface; (2) in the region of minimum porosity, near contact points of large particles, the occurrence of dead zones that are free of small particles. A relationship accounting for this effect is proposed that may be useful for the analysis of transport phenomena in granular bed filters, chromatographic columns, etc. © 2006 Elsevier B.V. All rights reserved.
Keywords: Particle mixtures; Binary spheres packing; Size ratio; Porosity; Tortuosity
1. Introduction
Mixed beds of particles have a wide application in industry and sciences. Granular beds and, in particular, packing of par-ticles with different sizes display a wide range of values of the porosity (ε) and pore tortuosity (T)[1–5]. Models of the binary particle beds porosity[6–14]and permeability[15–19]versus the volume fraction of the mixture components have been thor-oughly described.
The tortuosity is defined asT=Le/L, whereLeis the average flow pathway length andLis the bed thickness. Investigations on T are concentrated on the establishment of a relationship between the overall porosity and tortuosity [20]. For granular packings, the main effort has been focused on the determination of a fixed tortuosity value[14,21,22].
For a mixed bed of particles significantly different in size, to take into account the influence of the porosity on the permeabil-ity through the tortuospermeabil-ity is of major importance[16]. Due to the different methods applied for packing preparation, the values of bed porosity lie between “loose” and “dense” packing values, making of key importance to know how tortuosity is related with packing porosity.
∗Corresponding author. Tel.: +351 253604400
E-mail address:[email protected](M. Mota).
Among the proposed relations describing the relationshipT
versusε[23–27], for granular packings, a power law relationship is the most frequently used:
T = 1
εn (1)
wherenis a numerical value.
There are many evidences that n depends on the packing properties. For binary mixtures, Klus´acek and Schneider[28] admitted that n is not a constant. Assuming that in a porous medium there aremclasses of pores and that each class occu-pies the same portion of the total porosity, Millington and Quirk[29]suggested, for unconsolidated systems,nto be 1/3. Zhang and Bishop [30]and Mota et al. [31] applied n= 0.5. For loose packed spherical particles mixtures the best fit of
T versus ε was obtained for n= 0.4 [27,32]. n= 0.4 gives a good approach for tortuosity (1.47 average value) measured in a spheres packing with porosity between 0.363±0.030 [21]. Based on these observations, it may be speculated that the expo-nent index for granular beds describing the dependence of tortu-osity on portortu-osity ranges from 0.4 (loose packing) to 0.5 (dense packing).
The above-mentioned assumption can be confirmed by the data of Currie [1] (for sphere mixtures; sand mixtures; spheres/sand mixture) plotted inFig. 1together with the plot
Fig. 1. Dependence of the tortuosityTon the packing porosityε. Points are plot-ted using the data from[1]for sphere mixtures, sand mixtures and spheres/sand mixture. Lines represent Eq.(1)fornvalues of 0.4 and 0.5.
of Eq.(1)atn= 0.4 and 0.5. As can be seen, most of the data lies between the two functions.
Mota et al.[33]investigated a binary mixture spheres at dif-ferent olume fractions of large particlesxDfor particle ratiosD/d of 13.3, 20, and 26.7. Experiments with the binary particulate bed show that the dependence ofnon the fractional contentxD lies in the range of 0.5 (for the monosize packing) up to∼0.4 (in the region of the minimum porosity of the binary bed).
A justification for the variation of the parameternin Eq.(1)is required with the purpose of establishing a relationship between the binary packed bed porosity, fractional content, tortuosity and, hence, the permeability.
2. Experimental basis
Loose packed binary mixtures of glass beads of a size ratio from D/d= 1 up to 53.8 were analysed in terms of porosity, tortuosity and permeability. Most of the experimental data has been obtained in previous works[27,33]and additional exper-iments for high D/d ratio were performed using previously described procedures[33–35]. The packing procedure was per-formed without intensive compacting methods e.g. vibration, etc.
Packing porosity was measured by the volumetric method, whereas the tortuosity and the parameternin Eq.(1)were deter-mined based on the measurement of permeability.
The permeabilitykof a mixed bed is characterised by the relation[3,27]:
k= d
2 avε3 {36K0T2(1−ε)2}
(2)
wheredavis the average particle size in the bed and for the binary mixture of large particles of sizeDand small particles ofd is defined asdav= 1/{xD/D+ (1−xD)/d};xDis the volume fraction of large particles in the bed; complexK0T2=Kis the Kozeny’s coefficient and for granular bedsK= 4.2/5.0;Tis the tortuosity;
K0is the shape factor depending on the shape of a capillary pore cross-section area and may be assumed to beK0= 2.0 for the spheres packing[27,33].
The values of n were calculated from the known porosity, average particle size and permeability using Eq.(3) (obtained from(1)and(2)):
n=ln{36kK0(1−ε)
2/(ε3d2 av)}
2 ln(ε) (3)
3. Analysis and discussion
Data presented in a previous work[33]shows that the parame-ternis a function ofxDat the size ratioD/d= 13.3, 20, and 26.7. Measurements were made for mixtures with xD from 0 up to
xDmin, this value corresponding to a minimum packing porosity
εmin(xDminwas around 0.65–0.7). It was shown that the parti-cle arrangement in the binary mixtures atεminis characterised as a loose packing density. As a result, the tortuosity becomes lower being this reflected in the reduction of the parameter n
from 0.5 (for monosize packing) up to∼0.4 (at the minimum binary packing porosity).
The reason fornvariation may be explained by the distortion effect of the small particles packing occurring near the large par-ticles surface. InFig. 2, a sketch of a binary packing atD/d= 20 is shown, where the distortion effect is represented. Two types of distortion may be considered: when the volume fraction in the mixture,xD, is below the minimum porosity region (the skeleton formation in the mixture[34,35]),Fig. 2a, the main distortion occurs near the large particles surface; whenxDapproaches the region of minimum porosity, where large particles tend to form aggregates, becoming the skeleton at∼xDmin, a small particles jam occurs near the contact points of large particles and dead zones free of small particles are formed,Fig. 2b. Both types of distortion are responsible fornbecoming smaller than 0.5.
The volume of the packing involved in the distortion presents a complex dependence onδ=d/D[33,35]and increases, when
δis reduced from 1.0, reaches its maximum value atδbetween 0.1 and 0.01, and diminishes when the loose packing minimum porosity approaches the dense packing values at δ< 0.01. At
δ→0 loose and dense packing properties are convergent, hence,
n= 0.5 may be expected.
To verify that the packing density obtained in the experiments atxDmincorresponds to a loose packing, comparison with the data presented in works [27,33]as well as with the boundary limits [33]of loose (Eq.(4)) and dense (Eq.(5)) packings at
xD≤xDminwas done.
εmin=
ε0d(1−xDmin)exp(1.2264x1/ √
δ Dmin) 1−ε0dxDmin
(4)
εmin=εmin+(ε0d−εmin)exp
0.25
1−1
δ
(5)
Fig. 2. Representation of a binary packing atD/d= 20 showing the distortion effect in the small size particle fraction: (a)xDbelow the skeleton formation in
the mixture; (b)xDin the region of the minimum porosity.
InFig. 3, experimental values of the minimum porosity are plotted versus particle size ratioδ together with the boundary values obtained by Eqs.(4)and(5)(curves 1–4). Curves 1 and 2, represent values obtained at xDmin= 0.71 for ε0d= 0.41 and 0.38, using Eq.(4). Curves 3 and 4, are obtained with Eq.(5), forεmin= 0.16 and 0.1296, respectively. These values, ifε0D= ε0d is assumed, correspond to the monosize packing porosities of 0.4 (εmin= 0.16) and 0.36 (εmin= 0.1296). Curves 1 and 2 outline the loose packing region, whereas curves 3 and 4 show a dense packing area. As can be seen fromFig. 3, all the discussed experimental values belong to the loose packing region.
Using Eq. (3) it is possible to know whether n is a con-stant or a variable at different fractional contentsxD. Obtained results are shown inFig. 4together with Boltzmann fitting curves (http://www.originlab.com).
It is clearly seen that n is not a constant and lies in range 0.4–0.5 for the investigated loose packings. The reduction ofn
Fig. 3. Dependence the binary packing minimum porosityεminon the ratio
δ=d/Dbased on previous obtained[27,33]and recent experimental data. Curves 1 and 2, Eq.(4), calculated atxDmin= 0.71 forε0d= 0.41 and 0.38. Curves 3 and
4, Eq.(5), whenεmin= 0.16 and 0.1296, respectively.
when the system approaches minimum porosity can be explained with the small size particle packing distortion in the regions close to the large particles surface and the particles jamming in the void of the large particles skeleton,Fig. 2. FromFig. 3, it is also possible to consider that an increase in particles size ratio diminishes this effect. As no data is available forD/d higher 53.8, a theoretical approach is presented below.
The converging of the loose and dense packingεminmay be explained by the reduction in the distortion effects of both types forδ≪1.0. This fact is confirmed by the results presented by Bouvard and Lange[36]. These authors simulated a coordinate number in a binary system of spherical particles of different size for two cases: (1) when inclusions touch a matrix particle (coordinate numberZ) and (2) when they touch a plane wall (coordinate numberZw). The obtained dependence ofZw/Zon
δis shown in Fig. 5, being clearly shown that the coordinate number ratio approaches unity at the same region of δ as in Fig. 3.
Fig. 5. Dependence ofZw/Zonδaccording to Bouvard and Lange[36].
In previous works[33,35], different regions corresponding to different types of packing effects could be identified, based in the obtained relation ofεminversusδ. According to the mentioned results, regions may be identified as: (1) a region ofδ> 0.1−0.2 where a displacement mechanism acts upon particles with tran-sition to a linear – mixing model with a decrease ofδand where displacement and mixing effects in conjunction with packing distortion reach a maximum aroundδ∼0.1; (2) a region of par-tially disturbed arrangement of small particles in the void of the skeleton, 0.01 <δ< 0.1; (3) a region of small particles arrange-ment approaching monosize packing,δ< 0.01.
As a first step, it is possible to assume that the distortion effects at the loose packing correspond to a statistical “noise” or “defects” distribution acting on the dependence ofnversusδ. The simplest representation of this effect would be a Gaussian distribution functionn = f(δ), but due to the non-linear scale of propagation of the different effects along the axisδa lognormal distribution function is more adequate (Fig. 6).
The results presented inFig. 6 confirm the above consid-ered assumptions. Lognormal distribution minima and width
Fig. 6. Fitted lognormal distribution functions of the determined dependence of nonδfor differentxD: 1–0.25, 2–0.45, 3–0.6, and 4–0.65 (minimum porosity
packing region).
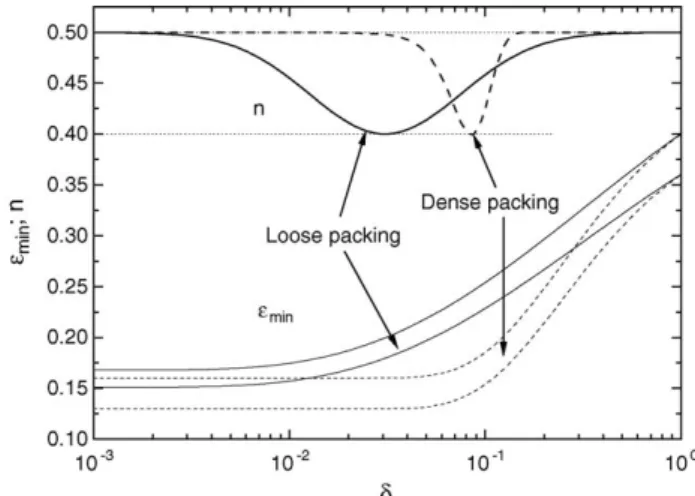
Fig. 7. Dependence ofnandεmin(fromFig. 3) onδ. Solid and dashed lines
represent loose and dense packings, respectively, forεminvs.δas well fornvs.
δ. Dependencenvs.δrepresents for loose and dense packings by Gaussian and lognormal distribution functions, respectively.
correspond to the region where the maximum distortion effect is observed[33,35]. It is well seen that the coordinate number ratio approaches unity at the same region ofδas inFig. 6. The mini-mumn(maximum distortion) moves to lower values ofδas the packing goes from monosize packingxD= 0 to binary packing atxDmaxas the contact area between small and large particles reaches its maximum value.
For dense packings, the distortion effect is minimal and it is likely that the “defects” distribution function is of the Gaussian type. Comparison of the dependence ofnandεmin(fromFig. 3) on δ for both loose (solid lines) and dense packings (dashed lines) is shown inFig. 7. For both packings, the dependence of
n onδ is represented by lognormal and Gaussian distribution functions. Lognormal and Gaussian peak positions and width do agree with the regions where the maximum distortion effect is observed.
Let us consider, for a loose packing, a possible error at the region of minimumn(δas 0.03) in comparison with the conven-tionally usedn= 0.5, as well as a similarity between loose and dense packings. For this purpose, Eq.(2)can be converted into the dimensionless formk/d2=ε3/(K0T2(1−)2) making it pos-sible to calculate the ratio ofk/d2for the two above mentioned cases for the minimum porosityεminand tortuosity(1).
In the first case, for the minimum value ofn= 0.4, the porosity is εmin∼0.19 and, consequently, the error in the calculation is (k/d2)n=0.5/(k/d2)n=0.4= 1.394. This is a significant value for permeability determination.
For the second case, atδ= 0.03, for the dense packingn= 0.5 and εmin∼0.145 can be used. The resulting ratio becomes (k/d2)Loose/(k/d2)Dense= 4.58. As a result of the expected dif-ferences innfor the loose and dense packings together with the differences in porosity, a significant gap in the packing perme-ability (k/d2)Loose/(k/d2)Densemust be observed in the region of
δ∼0.02–0.25.
4. Conclusion
The complexity of the processes involved in the formation of granular beds results in the inter-dependence of the main parameters included in the permeability: packing porosity and tortuosity. The bed porosity in the region ofεminis affected by particle size ratio and packing fractional content.
The obtained results show that the parameternin the tortu-osity formula T= 1/εnis a function of the packing contentxD and lies in the range 0.4–0.5. The reason fornvariation may be explained by the distortion effect of the small particles arrange-ment occurring near the large particle surface and a jamming effect. It was shown that for the loose packing the most probable deviation from the permeability calculated atn= 0.5 is expected to be in a wider range ofδ than for the dense packing with a maximum aroundδ= 0.03.
The relationship accounting for this effect may be useful for transport phenomena analysis in granular media.
Acknowledgements
The authors wish to thank Fundac¸˜ao para a Ciˆencia e Tec-nologia (FCT) for having provided the funds to perform this work through the project POCTI/EQU/37500/2001, as well as for the grant accorded to A. Yelshin. This project was partially funded by FEDER.
References
[1] J.A. Currie, Br. J. Appl. Phys. 11 (1960) 318–324.
[2] C.N. Satterfield, Mass Transfer in Heterogeneous Catalysis, MIT Press, Cambridge, 1970.
[3] J. Bear, Dynamics of Fluids in Porous Media, Elsevier, New York, 1972. [4] J. Bear, Y. Bachmat, Fundamentals of transport phenomena in porous
media, in: J. Bear, M.Y. Corapcioglu (Eds.), NATO ASI Series E: Applied Sciences, vol. 82, Nijhoff Publisher, The Netherlands, 1984, pp. 3–61. [5] R.H. Perry, D.W. Green, J.O. Maloney (Eds.), Perry’s Chemical Engineers
Handbook, McGrow-Hill, 1988, pp. 5–54.
[6] N. Ouchiyama, T. Tanaka, Ind. Eng. Chem. Fundam. 20 (1981) 66–71.
[7] A.B. Yu, R.P. Zou, N. Standish, Ind. Eng. Chem. Res. 35 (1996) 3730–3741. [8] Z.Z. Hulewicz, Int. Chem. Eng. 27 (1987) 566–573.
[9] M. Suzuki, K. Makino, M. Yamada, K. Iinoya, Int. Chem. Eng. 21 (1981) 482–488.
[10] K. Gotoh, T. Chuba, A. Suzuki, Int. Chem. Eng. 22 (1982) 107–115. [11] M. Kuramae, Int. Chem. Eng. 22 (1982) 666–673.
[12] A.B. Yu, N. Standish, Ind. Eng. Chem. Res. 30 (1991) 1372–1385. [13] O. Mac´e, J. Wei, Ind. Eng. Chem. Res. 30 (1991) 909–918.
[14] M.J. MacDonald, C.-F. Chu, P.P. Guilloit, K.M. Ng, AIChE J. 37 (1991) 1583–1588.
[15] R. Jeschar, Arch Eisenh¨uttenwesen 35 (1964) 91–108.
[16] R. Ben Aim, P. Le Goff, P. Le Lec, Powder Technol. 5 (1971) 51–60. [17] F.A.L. Dullien, Chem. Eng. J. 10 (1975) 1–34.
[18] R.S. Maier, D.M. Kroll, H.T. Davis, R.S. Bernard, J. Colloid Interface Sci. 217 (1999) 341–347.
[19] D. Wu, L. Song, B. Zhang, Y. Li, Chem. Eng. Sci. 58 (2003) 3995–4004. [20] A. Revil, J. Colloid Interface Sci. 212 (1999) 503–522.
[21] D.G. Huizenga, D.M. Smith, AIChE J. 32 (1986) 1–6.
[22] T. Wright, D.M. Smith, D.L. Stermer, Ind. Eng. Chem. Res. 26 (1987) 1227–1232.
[23] F.-G. Ho, W. Strieder, Chem. Eng. Sci. 36 (1981) 253–258. [24] H. Pape, L. Riepe, J.R. Schopper, Colloids Surf. 27 (1987) 97–122. [25] M.R. Riley, F.J. Muzzio, H.M. Buettner, S.C. Reyes, Biotechnol. Bioeng.
49 (1996) 223–227.
[26] E. Mauret, M. Renaud, Chem. Eng. Sci. 52 (1997) 1807–1817.
[27] M. Mota, J.A. Teixeira, A. Yelshin, Trans. Filtration Soc. 1 (2001) 101– 106.
[28] K. Klus´acek, P. Schneider, Chem. Eng. Sci. 36 (1981) 523–527. [29] R.J. Millington, J.P. Quirk, Trans. Faraday Soc. 57 (1961) 1200–1207. [30] T.C. Zhang, P.L. Bishop, Water Res. 28 (1994) 2279–2287.
[31] A. Yelshin, M. Mota, J. Teixeira, Proceedings of the International Confer-ence on Filtech Europa-97, D¨usseldorf, Filtration Society, Horsham, UK, October 14–16, 1997, pp. 327–334.
[32] M. Mota, J.A. Teixeira, A. Yelshin, in: Ed. Feyo de Azevedo, E. Ferreira, K. Luben, O Osseweijer (Eds.), Proceedings of the Second European Sympo-sium on Biochemical Engineering Science, Univ. of Porto, Porto, Portugal, September 16–19, 1998, pp. 93–98.
[33] M. Mota, J.A. Teixeira, R. Dias, A. Yelshin, Proceedings of the Ninth World Filtration Congress, New Orleans, Louisiana, AFS, Paper 316-3, April 18–22, 2004, pp. 1–30.
[34] R. Dias, J.A. Teixeira, M. Mota, A. Yelshin, Sep. Purif. Technol. 37 (2004) 69–80.
[35] R. Dias, J.A. Teixeira, M. Mota, A. Yelshin, Ind. Eng. Chem. Res. 43 (2004) 7912–7919.
![Fig. 1. Dependence of the tortuosity T on the packing porosity ε. Points are plot- plot-ted using the data from [1] for sphere mixtures, sand mixtures and spheres/sand mixture](https://thumb-eu.123doks.com/thumbv2/123dok_br/17000015.764326/2.892.83.423.94.332/dependence-tortuosity-packing-porosity-points-mixtures-mixtures-spheres.webp)
![Fig. 3. Dependence the binary packing minimum porosity ε min on the ratio δ = d/D based on previous obtained[27,33] and recent experimental data](https://thumb-eu.123doks.com/thumbv2/123dok_br/17000015.764326/3.892.58.418.96.734/dependence-binary-packing-minimum-porosity-previous-obtained-experimental.webp)