Influence of the test procedure for setting the external air movement on
the thermal performance of open multideck display case
G. G. HEIDINGER, S. M. NASCIMENTO, P. D. GASPAR, P. D. SILVA
Department of Electromechanical Engineering
University of Beira Interior
Rua Fonte do Lameiro, Edifício das Engenharias, 6201-001 Covilhã
Portugal
[email protected]
Abstract: - This paper reports the experimental results with an open multideck display case with dual air curtain. Manufacturers seek during the design phase of the equipment to certify its suitability to the testing standards with the lowest energy consumption and ensuring food safety. The testing standard ISO 23953 is usually followed to determine the equipment's thermal cooling load. However, some manufacturers use different procedures to set the external air velocity. The thermal cooling load will depend upon it. According to ISO 23953, the mean horizontal air velocity, with the refrigerated display case switched off, shall be 0.2 m/s. Thus, this paper reports the experimental results of tests where the initial procedure of setting the air velocity was performed by two different methods: (1) with the display case cooling on (2) and switched off as required by ISO 23953. The comparison of experimental results for the two conditions (switched off relatively to switched on) provide the quantitative variation of frost formation (-24%) and condensed water (+180%) on the evaporator coil and how this phenomena affects the distribution and magnitudes of air velocity (+7%); inlet (+5.9°C) and outlet temperatures (+5.5°C); the components of the total sensible (+10%) and latent (+15%) heat loads; and the average product temperatures (+176%). The analysis of experimental data provides the necessary basis to conclude that the initial procedure how the air movement is set affects significantly the performance of the equipment under testing. The results show that air movement procedure defined in the standard, although providing a higher thermal cooling load, is the most appropriated since the equipment will be able to operate correctly under more demanding ambient conditions and thus its design provides a better thermal performance. Key-Words: - Refrigeration, Display case, experimental testing, heat loads, frost formation, airflow distribution.
1 Introduction
This study aims to understand the influence of the external air velocity on the performance of display case evaporators knowing that 46% of the total display refrigerators are open vertical meat, deli and dairy refrigerators [1]. The infiltration load of a vertical open refrigerated display case (VORDC), corresponds, between 67% and 81% of the total heat load [2-4]. The infiltration load is strongly connected to the environmental conditions of the store in which they are placed, to the air curtain velocity, width and thickness and rate of air curtain agitation [3]. The air curtain agitation can be caused by shoppers passing and interfering on the air curtain to achieve some product or also by external air currents from the outputs of air conditioning systems, fans and pressure differences that originate mass flows. The increase of the air curtain agitation increases the condensation rate and the frost formation on the heat exchanger, which in turn requires a greater frequency of daily defrosting.
This condition increases the heat load due the need to recover the preservation temperature of food products after defrosting. Additionally, it promotes the temperature instability of the exposed products.
Air movement in laboratory tests shall be provided to simulate field conditions. The air movement must be parallel to the plane of the VORDC opening and to the longitudinal axis. With the VORDC switched off, the air velocity shall be 0.2 m/s [5]. Gaspar et al. [2] quantified experimentally the total heat load of a VORDC when the external airflow changes its direction and magnitude. At the reference experiment, the air velocity was fixed at 0.2 m/s and the direction of the airflow was parallel to the plane of the display opening (0°). The total heat load increased 4.6% when the airflow was oblique (45°) and increased 6% when the airflow was perpendicular (90°). When the airflow velocity was changed to 0.4 m/s parallel to the frontal opening of the VORDC (0°), the total and latent heat loads increased 54% and 77%
respectively. Gaspar et al. [6-7] developed a detailed CFD model of a refrigerated display cabinet to design a set of parametric studies. Based on that models the influence of airflow (0°, 45° and 90°) and heat transfers impact in thermal entrainment was simulated numerically [8-9]. When the air movement goes from parallel to perpendicular there an increase of air infiltration into the refrigerated space, and consequently occurs an increase in circulating air temperatures and condensation rate. The product temperatures were above the food safety limits in all experimental tests. Additionally, Gaspar et al. [10] studied numerically the dependency of air curtain performance on the discharge air velocity (grille and back panel) of open refrigerated display cabinets.
This paper follows the work developed by [11-14] and describes the results of 24-hours experimental tests following different test preparation procedures. The initial procedure to ensure an air velocity of 0.2 m/s at the front of the VORDC was performed considering the: (1) display case switched off as required by ISO 23953-2:2005 [5] and (2) switched on as followed by some equipment manufacturers. From now on, the experimental tests following these two procedures are named DCOFF and DCON respectively. This paper compares and discusses the experimental results and performance parameters obtained for the different tests. Its aim is to increase the awareness of all food chain players about the suitability of the initial procedure for setting the air movement defined in the standard. Although providing a higher thermal cooling load, it is the most appropriated since the VORDC will be able to operate correctly under more demanding ambient conditions and thus its design provides a better thermal performance.
2 Experimental Procedure
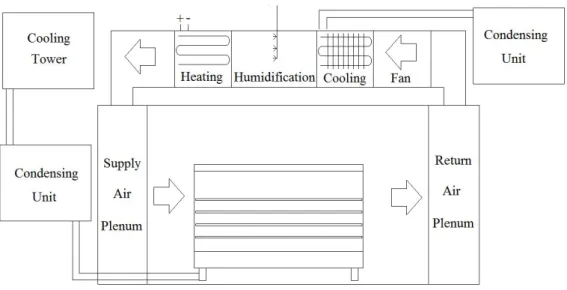
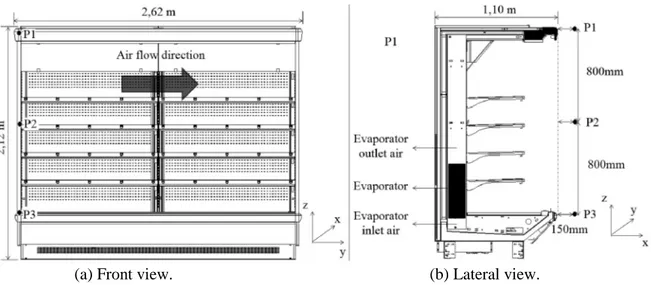
Tests were conducted in an environmental test chamber (Fig. 1) constructed according to ISO 23953 [5].The cooling equipment selected for the experiments is a VORDC (1.10m×2.62m×2.12m) with a dual air curtain (Fig. 2) used for displaying meat products, which temperature should be maintained between -1 °C and 5 °C (ISO 23953-2:2005 class M1). After reaching steady state conditions using the different procedures of setting the external air movement (DCOFF and DCON), each test period to analyse the thermal performance of the VORDC and its evaporator lasted 24 hours.
Thus, each experimental test followed a different procedure concerning the test room preparation:
- Experimental test DCOFF (according to ISO 23953-2:2005 [5]):
- Average value of the air movement parallel to the frontal opening of the VORDC switched off is set to 0.2 m/s (±10%) in each of the three air flow measuring points (P1, P2 and P3) shown in Fig. 2b;
- After reaching steady state conditions, the VORDC is switched on, and the experimental test runs for 24 hours.
- Experimental test DCON (followed by some equipment manufacturers):
- With the VORDC switched on, the air movement parallel to the frontal opening of the VORDC is adjusted to meet a value of 0.2 m/s (±10%) in each of the three air flow measuring points (P1, P2 and P3) shown in Fig. 2b;
- The experimental test runs for 24 hours after reaching steady state conditions.
(a) Front view. (b) Lateral view. Fig. 2. Open vertical refrigerated display case with dual air curtain.
(a) Experimental apparatus. (b) Virtual CV of evaporator. Fig. 3. Division of evaporator into virtual control volumes (CV). Data acquisition related to air and products
temperature, relative humidity, velocity and pressure drop was conducted at 1-minute interval in order to analyse variations of these values over time. To measure physical parameters on the R22 refrigerant side and external airflow velocity, data was collected according to the recommendations provided by ISO 23953:2005 [5].
To measure physical quantities on the airside, sensors were positioned at five equidistant points from the air inlet and outlet along the length (y) of the evaporator (Fig. 2a). Thus, the evaporator was divided into 5 virtual control volumes (CV), so that air temperature, humidity and velocity in each CV are considered constants (Fig. 3b). With this procedure, it was possible to determine the air distribution in the evaporator as well as which zones are more or less likely to form frost. The mass of water condensed during defrosting was manually collected and measured during each test period. The
outlet mass flow of the liquid coolant, which passed through the evaporator during each operating period, was monitored by a Coriolis flow monitor.
The manufacturer of the VORDC recommends for ideal operation an evaporation temperature of -10 ºC, ensuring products temperature within the prescribed limit range: -1 ºC to 5 ºC. Initially, the VORDC defrosts 10 times per day, and each defrost period lasts 12 minutes. The defrosting control system consists of stopping the cooling system while maintaining the fans in operation in order to defrost the ice on the evaporator surface by flowing ambient-temperature air. For testing purposes, there is no controller limiting the compressor work, whether a thermostat that ceases its operation depending on temperature, or some other mechanism, which turns off the compressor during the operating period. The compressor is only switched off when the defrosting process begins.
3 Mathematical Model
The total heat load of the cooling system on the refrigerant liquid side, QTOT, is determined by calculating the difference in enthalpies between inlet, ir,i, and outlet, ir,o, and the mass flow of the liquid refrigerant, m , as described in ISO 23953 [5]r and shown in eq. (1).
r,o r,i
r
TOT m i i
Q (1)
In order to determine the total heat load and its components on the airside, the airflow rates and the condensation and freezing rates of water for each cooling cycle were determined. The mass flow of air, m , was determined by eq. (2), assuminga uniform rates of outflow for each CV, and using the average values of air velocity, Va, and density,a, at the inlet and outlet (experimental measurements based on the principle of conservation of mass areas) of the evaporator of cross section, A.
A V ρ
ma a a (2)
The absolute humidity of the air at inlet, ,a,i and outlet, , areas of the evaporator wasa,o measured using psychrometric concepts using the average values of air temperature and relative humidity in these locations. Thus, the mass flow of condensed water is determined for the period in which the refrigeration was turned on, mw,OP, and for the period in which the refrigeration was turned off, mw,DEF, using eq. (3). The mass flow of water collected in experimental sampling during the defrosting period, mw,EXP, given by eq. (3.4), is the sum of the mass flow of ice formation on the evaporator during the operation period, m , andI
DEF w,
m . A small part of the mw,OP was drained without freezing. This mass flow, mw,DRAIN, is determined by eq. (5).
a,i a,o
a w m m (3) DEF w, I EXP w, m m m (4) I OP w, DRAIN w, m m m (5)The total heat load can be determined by the sum of the heat load components expressed by eq. (6) to
eq. (310), according to Sweetser [15]. These components are: Qa,COLD = latent heat load of air-cooling (air passing through the evaporator);
COND w,
Q = Sensible heat load of water vapour condensation; Qw,FREEZE = sensible heat due to freezing of condensate water; QI,COLD = latent heat load of ice cooling.
a,i a,o
COND w, COLD a, Q m i i Q a (6) w OP w, COND w, m h Q (7)
DEW FREEZE
w p, I COLD w, m c T T Q (8) h m Qw,FREEZE I I (9)
T T
c m QI,COLD I p,I FREEZE I (10)The total, sensible and latent heat loads can be determined by eq. (11), eq. (12) and eq. (13), respectively. COLD I, FREEZE w, COLD w, COND w, COLD a, TOT Q Q Q Q Q Q (11) FREEZE w, COND w, LAT Q Q Q (12) COLD I, COLD w, COLD a, SENS Q Q Q Q (13)
Correspondingly, two methods of determining the refrigeration heat load are obtained. The results of these two calculation methods are compared and discussed.
4 Analysis and Discussion of Results
4.1 External air velocity
During the phase of preparation of testing the VORDC and general test procedures, the external air velocity was set by two different methods: DCOFF and DCON. According to standard ISO 23953:2005 [5], the air velocity shall be 0.2 m/s (±10%) at the three reference points (P1, P2 and P3) with the VORDC switched off (DCOFF). Although, some equipment manufacturers instead of performing this initial procedure with the ORDC switched off, they switch it on (DCON) to adjust the external air movement to meet a mean value of 0.2 m/s of the horizontal air velocity measured during 1
min with a maximal interval of 5 s at each of the points P1, P2 and P3.
For both tests, after accomplishing this condition, 24-hour tests to the VORDC were performed. The comparison of these experimental results allows to evaluate the influence of the initial procedure used to set the external air movement on the thermal load and consequently on the energy consumption. Additionally, allows quantifying the effect of the
two methods on the evaporator’s performance.
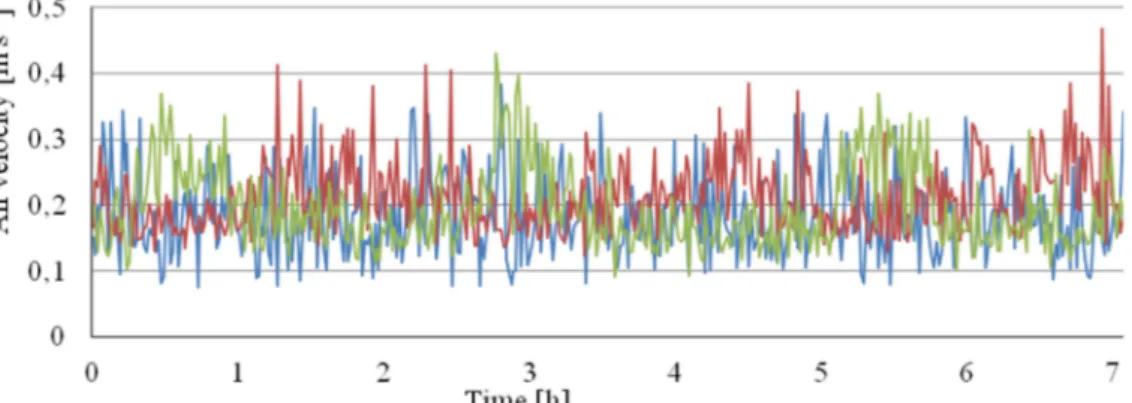
Fig. 4 shows the measured values of the air velocity on points P1, P2 and P3 for the DCOFF test. Fig. 4a shows the air velocities measured during the initial procedure of velocity adjustment with VORDC switched off. This procedure last 7 hours until steady state conditions were accomplished inside the test chamber and VORDC. The average three points velocity was 0.193 m/s (±10%), which complies with standard. Then, the 24-hour test with VORDC switched on was started. The air velocities measured during this test are shown in Fig. 4b.
For the initial procedure used in DCOFF, when the 24-hour test began, the values of the air velocity on the test chamber is significantly changed from the 0.2 m/s previously set. The air velocity at P1 and
P2 increases and at P3 decreases (see Fig. 4b and Table 1). The average three points velocity is 0.353 m/s (±10%), so the external air movement becomes higher than 0.2 m/s (±10%).
This fact is due to the interaction of the ambient airflow with the amount of cold air that escapes from the air curtain that creates an area of greater restriction to airflow at the bottom of the test chamber.
For the initial procedure used in DCON, the value of the external air movement was adjusted for 0.2 m/s with the equipment operating, i.e., with the influence of the air curtain flow. Thus, the values of air velocity at points P1, P2 and P3 during the 24-hour test are within the range (0.2 m/s ± 10%), described in the standard. Table 1 shows the average air velocity at reference points P1, P2 and P3 with the two different methods during the 23-hour tests.
Table 1. Average air velocity during 24-hour tests. Test VP1[m/s] VP2[m/s] VP3[m/s]
DCON 0.17 0.19 0.20
DCOFF 0.52 0.39 0.15
Difference +206% +105% -25%
(a) Velocities measured during the initial procedure of velocity adjustment with VORDC switched off.
(b) Velocities measured during the 24-hour test with VORDC switched on. Fig. 4. Case DCOFF: External air velocities at sensor P1 (−), P2 (−) and P3 (−).
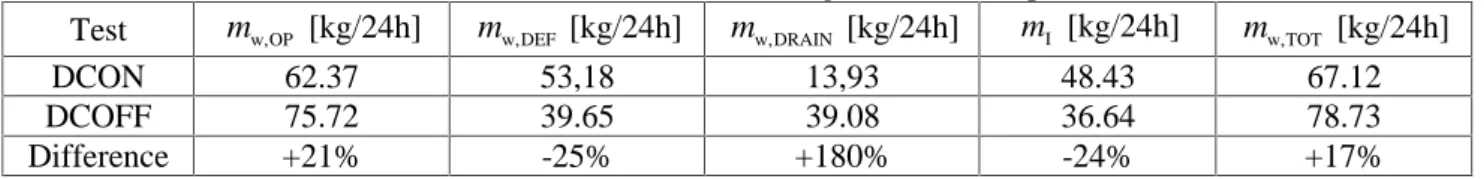
Table 2. Values of condensation and freezing of water in experimental tests.
Test mw,OP [kg/24h] mw,DEF [kg/24h] mw,DRAIN [kg/24h] m [kg/24h]I mw,TOT [kg/24h]
DCON 62.37 53,18 13,93 48.43 67.12
DCOFF 75.72 39.65 39.08 36.64 78.73
Difference +21% -25% +180% -24% +17%
The DCOFF method promotes a greater non-uniformity of air temperature inside the VORDC than the DCON method. This condition is due to the increased interaction between the external air movement and the air curtain.
4.2 Air humidity, condensation and freezing
of water
The rates of condensation and freezing of water between the evaporator fins increase with the parallel velocity of the ambient air. The aim of this experimental study was to measure how representative is the increase of ambient air velocity on the rates of condensation and freezing during the operation and defrost periods.
The experimental results obtained for the tests conducted for DCON and DCOFF methods are shown in Table 2. Comparing these experimental results, it can be concluded that in DCOFF method: (1) the total quantity of condensed water in the evaporator is 17% greater; (2) the quantity of water that solidifies between fins is 25% lower; and (3) the quantity of water that drains during the operating period is 180% greater.
Such figures prove the significant influence of the air movement setting procedure on the operation of the evaporator regarding its frost formation.
4.3 Air distribution and pressure loss in the
evaporator
For both 24-hour tests with different air movement setting procedures, the distribution of airflow was evaluated at two separate times: when the evaporator was completely clean, i.e. after defrosting the coil, and immediately before defrosting it. The percentage distribution of airflow in the five virtual CV of the evaporator is shown in Fig. 5. From the analysis of Fig. 5, it is stated that after defrosting, airflow is equally distributed in each CV for both initial procedures for setting the air movement (DCOFF and DCON).
The
CV2 possesses the largest airflow and the largest air velocity passing between fins. The lower quantity of airflow circulating in CV1 and CV5 can be attributed to extremities effects (friction and consequent pressure drop) on the evaporator. When the evaporator is ready to be defrosted, the percentage distribution of airflow is significantly different from after defrosting.(a) DCOFF. (b) DCON.
This fact is attributed to the irregular formation of frost. The airflow through CV1 is less than in other CV. The frost most likely will form in this region because the airflow has the first contact with the air curtain in this area (this result is in accordance with the numerical simulations of Gaspar et al. [6]. For DCOFF, the airflow reduction (more frost) is more significant, as before defrosting only 4% of the airflow circulating in the evaporator goes through this region. This drastic reduction suggests that the frost formation grows significantly as a function of air velocity magnitude. The increase in the percent airflow mainly in CV2 and CV4 is due to these regions are less likely to form frost and therefore, as the resistance to outflow is less, they become the preferred paths for air. During the cooling period, the total absolute airflow decreased 23% for DCON and 13% for DCOFF.
4.4 Influence of frost formation on air and
product temperatures
Fig. 6 shows the variation of air temperature entering and leaving the evaporator for DCOFF and DCON methods. The air temperature at the evaporator outlet is lower for DCON. This is due to the lower external air velocity. For DCOFF, the air inlet and outlet temperature values are much greater because the air curtain is strongly affected by the increase of external air velocity. This fact explains the lower ice formation and greater condensation when the DCOFF is used to set the external air velocity. The average product temperatures is 3.4 °C for DCON and 9.4 °C (+176%) for DCOFF. The limit to maintain the proper preservation of products is 5 °C.
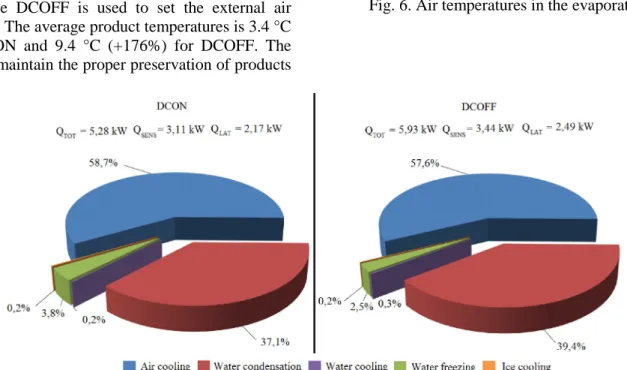
4.5 Heat loads
The total heat load and its components are shown in Fig. 7. The heat load of the equipment increased 12% from DCON to DCOFF. In DCON, the latent heat load (condensation and freezing of water) represents 41% of the total heat load, with the remaining 59% due to sensible heat of cooling the air, the water and frost. The latent heat due to freezing of water represents only 4% of the total load and the sensible heat load due to cooling the water and ice represents only 0.4% of the total load. For DCOFF, the latent heat load represents 42% of the total heat load, with the remaining 58% due to sensible heat of cooling the air, water and ice. The latent heat due to freezing the water represents only 2.5% of the total load and the sensible heat load due to cooling water and ice represents only 0.5% of the total load.
Fig. 6. Air temperatures in the evaporator.
5 Conclusions
Experimental tests are performed for different air movement setting procedures, when the open refrigerated display case is switched off (DCOFF) and switched on (DCON). The main conclusions of this study are: (1) the procedure defined in the ISO 23953, i.e., setting the air movement with the display cabinet switched off (DCOFF), is the correct procedure to afterward testing the equipment. It results in a higher requirement for the products safety because when the display cabinet is operating the average air velocity in front of the equipment will be higher due to the interaction with the air curtain. (2) The thermal load is 12% higher when the DCOFF method is used; (3) By opposition, if the air movement is set to 0.2 m/s (±10%) with the display cabinet switched on (DCON), the effective value of the horizontal air movement is lower as it already considers the contribution of the air curtain velocity. Thus, the ambient condition simulated is less demanding; (4) The increase in internal temperature of the display case means that less ice is formed between fins of the evaporator, but more water is condensed during the operation, thus reducing the frequency of periodic defrost; (5) The area most affected by the ice formation on the evaporator is the extremity located on the side where the ambient air is coming from.
This paper verifies that the air movement procedure defined in the testing standard is the most suited since the display case will be able to operate correctly under more demanding ambient conditions and thus its design provides a better thermal performance. However, the equipment certification following strictly the testing procedure defined in ISO 23953 will provide an equipment with higher energy consumption. Nevertheless, these equipments are able to handle with adverse ambient conditions ensuring the food safety.
Nomenclature:
A Area (m²)
CV Control Volume
p
c Specific heat (kJ/kg K)
DCOFF Display case switched off DCON Display case switched on
h Latent heat (kJ/kg)
i Specific enthalpy (kJ/kg)
m Mass flow (kg/s)
P Reference point
Q Heat load of cooling (kW)
T Temperature (°C)
V Velocity (m/s)
Absolute humidity (kgwat/kgair) Greek symbols Specific mass (kg/m³) T Temperature difference (°C) Subscripts a Air COLD Cooling COND Condensation DEF Defrosting DEW Dew DRAIN Drain EXP Experimental FREEZE Freezing i Inlet I Ice LAT Latent o Outlet OP Operation P1 Reference point 1 P2 Reference point 2 P3 Reference point 3 r Refrigerant fluid SENS Sensible TOT Total W Water References:
[1] Navaz, H.K., Faramarzi, R., Gharib, M., Dabiri, D., Modarress, D. 2000, The application of advanced methods in analyzing the performance of the air curtain in a refrigerated display case, J Fluids Eng 124(3): 756-764. [2] Gaspar, P., Gonçalves, L., Pitarma, R. 2011,
Experimental analysis of the thermal entrainment factor of air curtains in vertical open display cabinets for different ambient air conditions, App Therm Eng 31 (5): 961-969. [3] ASHRAE 2010, ASHRAE Handbook:
Refrigeration, ASHRAE, Inc.
[4] Faramarzi, R. 1999, Efficient display case refrigeration, ASHRAE Journal, Nov.: 46–51. [5] ISO 23953-2 2005, Refrigerated display
cabinets - Part 2: Classification, requirements and test conditions, International Organization for Standardization (ISO).
[6] Gaspar, P.D., Gonçalves, L.C.C., Pitarma, R.A. 2012. Detailed CFD modelling of open refrigerated display cabinets, Modelling and
Simulation in Engineering, Hindawi Publishing Corporation, Volume 2012
[7] Gaspar, P.D., Gonçalves, L.C.C., Pitarma, R.A. 2012. CFD parametric studies for global performance improvement of open refrigerated display cabinets, Modelling and Simulation in Engineering, Hindawi Publishing Corporation, Volume 2012.
[8] Gaspar, P., Gonçalves, L., Ge, X. 2010, Influence of ambient air velocity orientation in thermal behaviour of open refrigerated display cabinets, ASME ESDA 2010 - 10th Biennial Conf. on Eng. Systems Design and Analysis. [9] Gaspar, P.D., Gonçalves, L.C.C., Ge, X. 2010,
CFD parametric study of ambient air velocity magnitude influence in thermal behaviour of open refrigerated display cabinets, 5th European Conference on Computational Fluid Dynamics (ECCOMAS CFD 2010), Lisbon, Portugal.
[10] Gaspar, P.D., Gonçalves, L.C.C., Vogeli, A. 2009, Dependency of air curtain performance on discharge air velocity (grille and back panel) in open refrigerated display cabinets, ASME International Mechanical Engineering Congress and Exposition, Lake Buena Vista, Florida, U.S.A.
[11] Heidinger, G.G., Nascimento, S.M., Gaspar, P.D., Silva, P.D. 2013, Impact of environmental conditions on the performance of open multideck display case evaporators, 2nd IIR International Conference on Sustainability and the Cold Chain (ICCC 2013), Paris, France. April 02 - 04.
[12] Nascimento, S.M., Heidinger, G.G., Gaspar, P.D., Silva, P.D. 2013. Experimental quantitative evaluation of thermal performance in refrigerated displays case with variation of the thickness of the air curtain and perforation density of the back panel, 2nd IIR International Conference on Sustainability and the Cold Chain, International Institute of Refrigeration (IIR), Paris, France, April 2-4, 2013.
[13] Nascimento, S.M., Heidinger, G.G., Gaspar, P.D., Silva, P.D. 2013. Experimental evaluation and qualitative increase of thermal load in open refrigerated display cases due to breakage of the air curtain, 2nd IIR International Conference on Sustainability and the Cold Chain, International Institute of Refrigeration (IIR), Paris, France, April 2-4, 2013.
[14] Nascimento, S.M., Heidinger, G.G., Gaspar, P.D., Silva, P.D. 2014. Performance variation of vertical open refrigerated display cases in-situ operation and testing according to ISO and
ASHRAE standards, 3rd IIR International Conference on Sustainability and Cold Chain (ICCC 2014), London, United Kingdom, June 23-25, 2014.
[15] Sweetser R. 2000, Investigation of relative humidity impacts on the performance and energy use of refrigerated display cases, University of Groningen, GAS Research Institute, Final Report.