F
F
i
i
n
n
a
a
n
n
c
c
i
i
a
a
l
l
(
(
i
i
n
n
)
)
s
s
t
t
a
a
b
b
i
i
l
l
i
i
t
t
y
y
a
a
n
n
d
d
i
i
n
n
d
d
u
u
s
s
t
t
r
r
i
i
a
a
l
l
g
g
r
r
o
o
w
w
t
t
h
h
:
:
T
T
h
h
e
e
c
c
a
a
s
s
e
e
s
s
o
o
f
f
I
I
t
t
a
a
l
l
y
y
a
a
n
n
d
d
P
P
o
o
r
r
t
t
u
u
g
g
a
a
l
l
R
R
i
i
c
c
a
a
r
r
d
d
o
o
P
P
a
a
e
e
s
s
M
M
a
a
m
m
e
e
d
d
e
e
D
D
e
e
z
z
e
e
m
m
b
b
r
r
o
o
d
d
e
e
2
2
0
0
1
1
4
4
W
W
P
P
n
n
.
.
º
º
2
2
0
0
1
1
4
4
/
/
1
1
1
1
DOCUMENTO DE TRABALHO WORKING PAPER*
DINÂMIA’CET – IUL and ISCTE – IUL.Financial (in)stability and industrial growth:
The cases of Italy and Portugal
1*
Ricardo Paes Mamede
WP n.º 2014/11
DOI: 10.7749/dinamiacet-iul.wp.2014.11
1. Introduction ... 1
2. Investment dynamics ... 6
3. The determinants of investment dynamics ... 10
4. The cost of financing and its determinants ... 11
5. The evolution of industry structure and its main determinants ... 16
6. The main determinants of growth in building and construction activities ... 17
7. The main determinants of growth in manufacturing industries ... 18
8. Summing-up... 20
9. Other impacts of financial (in)stability on the relative performance of industries ... 21
9.1. Real exchange rate appreciation ... 21
9.2. Fierce competition in the credit market for house purchase and real estate activities ... 23
9.3. Increasing indebtedness of firms and households ... 23
10. Conclusion ... 25
11. References ... 26
1 This paper was written as contribution to Deliverable 8.07 (“Paper on the relationship between stability and instability of the financial system and industrial growth performance within the EU”) of the FESSUD project (“Financialisation, economy, society and sustainable development”), financed by the 7th Framework Programme of the European Commission (Grant agreement no. 266800). The paper benefits from previous work developed by the DINÂMIA’CET - IUL team of FESSUD (see Lagoa et al., 2013).
2
DINÂMIA’CET – IUL, Centro de Estudos sobre a Mudança Socioeconómica e o Território ISCTE-IUL – Av. das Forças Armadas, 1649-026 Lisboa, PORTUGAL Tel. 210464031 - Extensão 293100 E-mail: dinamia@iscte.pt www.dinamiacet.iscte.pt
Financial (in)stability and industrial growth:
The cases of Italy and Portugal
Abstract:
This paper discusses the relation between financial stability/instability and industrial growth in Italy and Portugal, taking as point of departure the similarities and differences between Portugal and Italy. Although with different intensities, both Italy and Portugal experienced very modest levels of economic growth in the years that preceded the global recession, both have seen the costs of finance increase after 2010, both had to respond with the implementation of severe austerity measures and, partially as result of this, both countries experienced a sharp drop in economic activity and a substantial increase in unemployment rates. Portugal and Italy also share a significant exposure to competitive pressures from emerging economies, due to the weight of traditional, low technology-intensive industries in their economies. In spite of all the common features, Italy and Portugal display important differences in the timing and strength of the aforementioned trends. The paper argues that the evolution of the manufacturing industry in both countries is largely a result of factors that are essentially unrelated with financial (in)stability, although some indirect impacts of the latter on industrial growth can be identified.
3
DINÂMIA’CET – IUL, Centro de Estudos sobre a Mudança Socioeconómica e o Território ISCTE-IUL – Av. das Forças Armadas, 1649-026 Lisboa, PORTUGAL Tel. 210464031 - Extensão 293100 E-mail: dinamia@iscte.pt www.dinamiacet.iscte.pt
1. INTRODUCTION
Portugal and Italy are among the countries most affected by the crisis that erupted in the Eurozone in the aftermath of the international recession of 2008/2009. Like Greece and Ireland, Portugal had to resort to international financial assistance (in May 2011), in order to avoid a debt default, in the face of rapidly escalating interest rates on government bonds (see Figure 1). In turn, the Italian government (like the Spanish one) was able to avoid a direct bailout by international institutions, although Italy’s financial stability remained highly dependent on the intervention by the European Central Bank (ECB). As such, both the Italian and the Portuguese authorities had to adopt severe austerity policies, thereby deepening economic recession and unemployment growth in the medium term.
Moreover, Italy and Portugal share a distinctive feature among the countries most affect by the Eurozone crisis: both have experienced very modest levels of economic growth in the years preceding the global recession (see Figure 2). In fact, while the Spanish, the Greek, and the Irish economies grew above the EU average in the period 2000-2007 (at an annual average of 3,4%, 4,2%, and 5%, respectively), Portugal and Italy registered the two lowest average rates of GDP growth in the EU (1,1% and 1,3%, respectively). During those years, the two countries also registered below average levels of private consumption and investment growth, similarly to the patterns found in Germany in the same period.
Figure 1 - Interest rates on ten-year government bonds (%)
Figure 2 – Annual average GDP growth between 2000 and 2007 (%)
4
DINÂMIA’CET – IUL, Centro de Estudos sobre a Mudança Socioeconómica e o Território ISCTE-IUL – Av. das Forças Armadas, 1649-026 Lisboa, PORTUGAL Tel. 210464031 - Extensão 293100 E-mail: dinamia@iscte.pt www.dinamiacet.iscte.pt
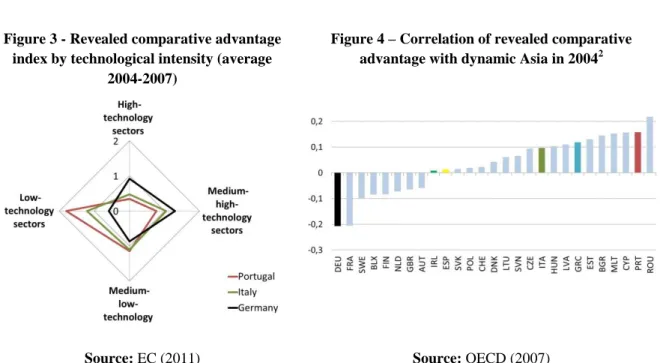
In contrast with Germany, however, during this period Italy and Portugal have been exposed to harsh competitive pressures from outside the EU. Being overspecialized in low and medium-low technology industries (see Figure 3), these southern European countries – especially Portugal – have faced increasing competition from the emerging economies of Asia, whose specialization profile overlaps to a greater extent with theirs then with more technology-intensive EU economies (see Figure 4).
Figure 3 - Revealed comparative advantage index by technological intensity (average
2004-2007)
Figure 4 – Correlation of revealed comparative advantage with dynamic Asia in 20042
Source: EC (2011) Source: OECD (2007)
Starting from the similarities between Portugal and Italy with regard to recent financial hurdles, to aggregate economic performance in the years preceding the global crisis, and to the specialization of their economies, this paper discusses the relation between financial stability/instability and industrial growth in these countries.
In this paper the level and volatility of real interest rates are taken as proxies of financial stability/instability. Five distinct periods can be roughly identified in the relation between that concept and the overall economic performance of Italy and Portugal in the past three decades (Figure 5 and Figure 6):
(i) the second half of the 1980s was marked by strong economic growth, in the context of volatile interest rates;
5
DINÂMIA’CET – IUL, Centro de Estudos sobre a Mudança Socioeconómica e o Território ISCTE-IUL – Av. das Forças Armadas, 1649-026 Lisboa, PORTUGAL Tel. 210464031 - Extensão 293100 E-mail: dinamia@iscte.pt www.dinamiacet.iscte.pt
(ii) financial instability peaked in the first half of the 1990s, with the crisis of the European Monetary System leading to high exchange rate and interests rate instability, and a Europe-wide recession in 1993;
(iii) the second half of the 1990s was marked by the so-called ‘nominal convergence’ in the preparation of the European Monetary Union (EMU), translating into a steep drop in interest rates, exchange rate stability, and decreasing inflation in most EU15 countries; during this period Portugal registered the fourth highest GDP growth rate (4,2%) in the EU15 (after Ireland, Luxemburg, and Finland), while the Italian economy experienced one of the lowest rates of growth (1,9%), only slightly above the German one;
(iv) from 2000 until 2007 nominal and real interest rates remained low and stable in Italy and in Portugal, while GDP grew at a rather modest pace (Figure 2); and, finally,
(v) from 2008 until 2012 real interest rates increased in Italy and, especially, in Portugal, with both economies receding to GDP levels unseen since the early 2000s.
3 Idem.
4 German data refers to West Germany before 1991.
Figure 5 – Annual GDP growth (%)3 Figure 6 – Real long-term interest rates, GDP deflator (%)4
6
DINÂMIA’CET – IUL, Centro de Estudos sobre a Mudança Socioeconómica e o Território ISCTE-IUL – Av. das Forças Armadas, 1649-026 Lisboa, PORTUGAL Tel. 210464031 - Extensão 293100 E-mail: dinamia@iscte.pt www.dinamiacet.iscte.pt
The following questions, arising from the analysis above, are worth considering in the present context:
1) Why did Portugal grow significantly faster than Italy in the second half of the 1990s?
2) Why did GDP growth came to a halt after 2000 in both Italy and Portugal, in spite of the low levels of real interest rates?
3) To what extent is this related with the development of the financial systems of each country and their (in)stability?
4) How did this affect the structure of each economy and, in particular, the growth of industry?
The following sections will provide tentative answers to these questions. We start from the analysis of the investment dynamics (section 2) and its determinants (section 3). The subsequent sections of the paper deal with the costs of finance (section 4), the evolution of industry structures (section 5), and the indirect impacts of financial (in)stability on industrial growth. Section 7 concludes the paper.
2. INVESTMENT DYNAMICS
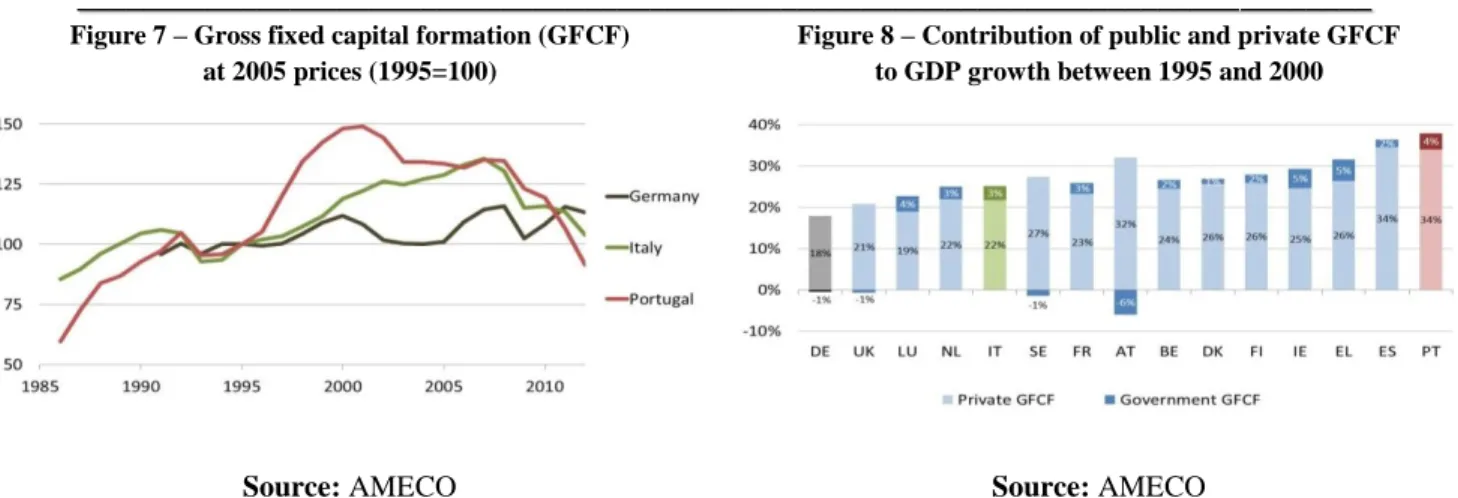
The fast GDP growth experienced in Portugal in the second half of the 1990s is strongly associated with what can be designated as an investment surge. In fact, between 1995 and 2000, gross fixed capital formation (GFCF) increased by nearly 50% in Portugal (in volume), which compares with 19% in Italy and 12% in Germany (Figure 7). In this period Portugal was the EU15 country in which GFCF gave the highest contribution to GDP growth (Figure 8), which is all the more impressive given the high rate of GDP growth during those years. After reaching a peak in 2000/2001, GFCF in Portugal decreased by nearly 10% from 2001 to 2008, dropping further until 2012 to nearly 60% of its peak level (as a result of the successive crises that affected the Portuguese economy since 2008). In contrast, investment in Italy grew steadily until 2007, falling by nearly ¼ between this year and 2012.
7
DINÂMIA’CET – IUL, Centro de Estudos sobre a Mudança Socioeconómica e o Território ISCTE-IUL – Av. das Forças Armadas, 1649-026 Lisboa, PORTUGAL Tel. 210464031 - Extensão 293100 E-mail: dinamia@iscte.pt www.dinamiacet.iscte.pt
Figure 7 – Gross fixed capital formation (GFCF) at 2005 prices (1995=100)
Figure 8 – Contribution of public and private GFCF to GDP growth between 1995 and 2000
Source: AMECO Source: AMECO
Far from being a phenomenon exclusively related with a specific type of investment (such as dwellings or other buildings), the impressive growth of GFCF in Portugal in the second half of the 1990s affected all types of investment assets and all types of industries. In fact, Portugal and Italy (and Germany) followed similar patters with respect to the relative pace of investment growth across investment types (Figure 9): the highest growth was registered in transport equipment, other machinery and equipment, and intangible fixed assets; investments in dwellings and other buildings and structures grew below the average in this period.
These patterns suggest that the growth of investment in 1995-2000, both in Italy and in Portugal, was to some extent directed towards industries other than construction and real estate. This is confirmed by the analysis of GFCF by industry (Figure 10), which shows that investment grew above the average in information and communication and in manufacturing, and below the average in construction and real estate activities, both in Italy and in Portugal (the same applying to Germany).
Figure 9 – Total gross fixed capital formation in 2000 by type of asset, in volumes (1996=100)
Figure 10 – Gross fixed capital formation in 2000 by industry, in volumes (1995=100)
8
DINÂMIA’CET – IUL, Centro de Estudos sobre a Mudança Socioeconómica e o Território ISCTE-IUL – Av. das Forças Armadas, 1649-026 Lisboa, PORTUGAL Tel. 210464031 - Extensão 293100 E-mail: dinamia@iscte.pt www.dinamiacet.iscte.pt
As was shown in Figure 7, after 2000, Italy and Portugal displayed divergent trends in GFCF: investment steadily increased in Italy, while Portugal registered a substantial drop in GFCF. In fact, Portugal was the only EU country experiencing a decline in GFCF (in volumes) between 2000 and 2007 (Figure 11), at an average annual rate of -1,3% (which compares with +1,9% in Italy).
The differences between Portugal and Italy in the growth of total GFCF after 2000 are essentially related with opposite trends in investments in dwellings: these dropped steeply in Portugal from 2000 onwards, while increasing in Italy until 2007 (Figure 12). In contrast, investments in machinery and other equipment grew at a similar pace in the two countries between 2000 and 2007.
Figure 11 – Average annual gross fixed capital formation growth between 2000 and 2007 (%)
Figure 12 – Contribution to the change in gross fixed capital formation between 2000 and 2007 (%)
Source: Eurostat Source: Eurostat
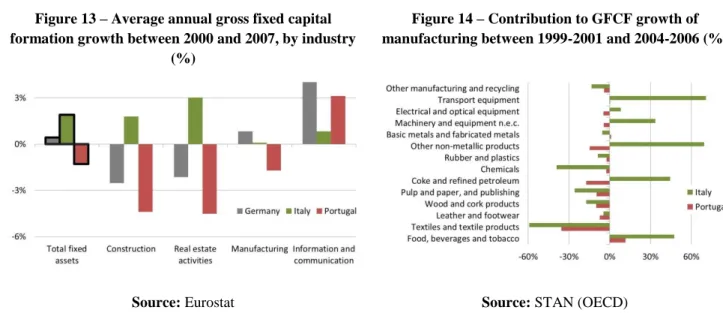
The analysis above, which is based on the GFCF by type of asset, suggests that the differences between Italy and Portugal in investment dynamics after 2000 are most pronounced in construction and real estate-related activities, and less so in other industries. This is confirmed in Figure 13, which shows, for example, that investment in information and communication activities grew faster in Portugal than in Italy during this period.
By checking the contribution of different industry branches to the overall change in manufacturing investment (Figure 14), one realizes that the growth in manufacturing GFCF in Italy has been driven by a handful of industries (namely, other non-metallic products, transport equipment, food, beverages, and tobacco, and other machinery and equipment), which were able to offset the steep decrease of GFCF in other industries (notably, textiles and chemicals). On the contrary, in the case
9
DINÂMIA’CET – IUL, Centro de Estudos sobre a Mudança Socioeconómica e o Território ISCTE-IUL – Av. das Forças Armadas, 1649-026 Lisboa, PORTUGAL Tel. 210464031 - Extensão 293100 E-mail: dinamia@iscte.pt www.dinamiacet.iscte.pt
of Portugal, the fall in investment in traditional industries (textiles, footwear, wood and cork) was not compensated by the growth of GFCF in other manufacturing industries.
Figure 13 – Average annual gross fixed capital formation growth between 2000 and 2007, by industry
(%)
Figure 14 – Contribution to GFCF growth of manufacturing between 1999-2001 and 2004-2006 (%)
Source: Eurostat Source: STAN (OECD)
In sum, in what regards investment dynamics in Portugal and Italy in the last two decades, one can say that:
(i) Portugal experienced a distinctive investment surge between 1995 and 2000, which was felt in all types of assets and industries;
(ii) the faster growth of total GFCF in Italy after 2000, as compared to Portugal, is essentially explained by the steep fall in investment in dwellings in Portugal and the gradual growth of this type of investments in Italy until 2007;
(iii) in both countries there was a decrease of GFCF in traditional industries, which in the case of Italy was compensated by the growth of investment in other industries.
These assertions suggest that there may be different relevant forces at work in determining the dynamics of investment in Portugal and Italy in recent decades. We turn now to this discussion.
10
DINÂMIA’CET – IUL, Centro de Estudos sobre a Mudança Socioeconómica e o Território ISCTE-IUL – Av. das Forças Armadas, 1649-026 Lisboa, PORTUGAL Tel. 210464031 - Extensão 293100 E-mail: dinamia@iscte.pt www.dinamiacet.iscte.pt
3. THE DETERMINANTS OF INVESTMENT DYNAMICS
The investment dynamics is both a cause and a result of economic growth: high growth expectations foster new investments, which in turn contribute to stimulate further growth.
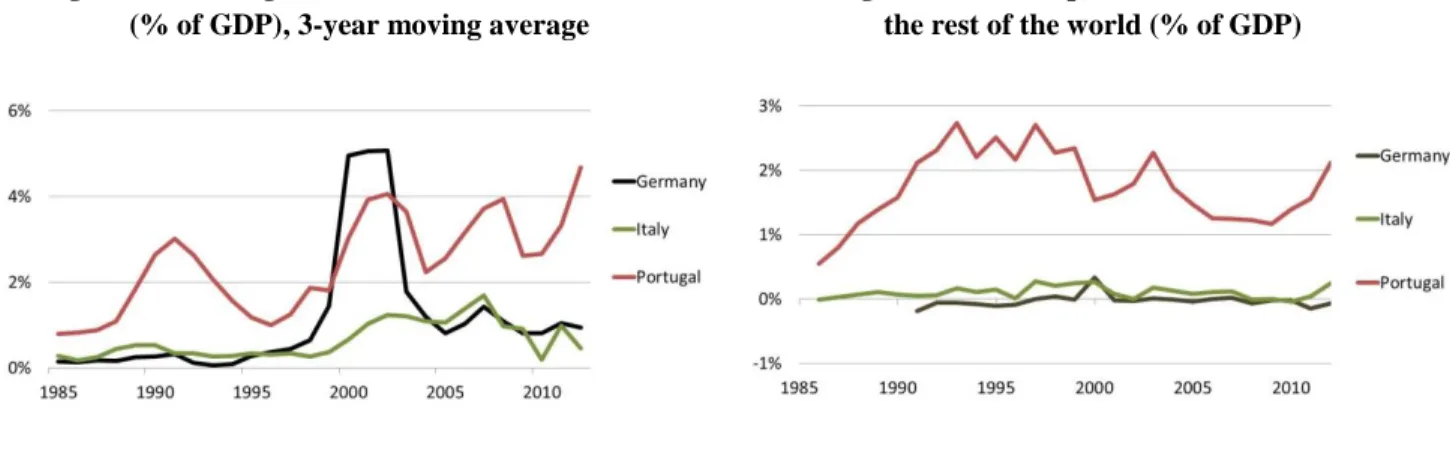
The second half of the 1980s was a favorable period for European economies, namely as result of declining oil prices and the implementation of the European Single Market program. In the Portuguese case, economic growth was also fostered by accession to the EEC (in 1986), the massive inflow of FDI (Figure 15) and of European structural funds (leading to considerable annual surpluses in the capital account – Figure 16), as well as the overall climate of economic stabilization and liberalization that characterized the aftermath of an IMF-led bailout program in 1983-1985 (which was marked by financial repression and harsh austerity measures). Between 1986 and 2000 Portugal registered one of the highest growth rates in the EU15 (4,1% per year, on average), almost the double of Italy (2,1%). The expectation of continuing high growth rates has probably been a crucial determinant of the investment surge experienced by Portugal until the turn of the millennium.
Figure 15 – Foreign direct investment, net inflows (% of GDP), 3-year moving average
Figure 16 – Net capital transactions with the rest of the world (% of GDP)
Source: World Bank Source: AMECO
Although FDI and European structural funds have been a relevant source of investment funds in Portugal in recent decades, they represent nevertheless a relatively small part of the resources that were used to finance investment until 2000. In fact, those two sources of funds represent together, on average, around 5% of the GDP since the middle 1980 – less than 1/5 of the average annual GFCF between 1986 and 2000.
11
DINÂMIA’CET – IUL, Centro de Estudos sobre a Mudança Socioeconómica e o Território ISCTE-IUL – Av. das Forças Armadas, 1649-026 Lisboa, PORTUGAL Tel. 210464031 - Extensão 293100 E-mail: dinamia@iscte.pt www.dinamiacet.iscte.pt
In other words, the surge in investment experienced by Portugal would not have been possible without the wide availability of credit to domestic firms and households, in particular since the middle 1990s. Loans to Portuguese non-financial corporations grew from 44% of the GDP in 1995 to 93% in 2001 (Figure 17), remaining around this level until 2007. Loans to households increased from 26% of the GDP in 1995 to 86% in 2000, and continued to grow, surpassing 100% of the GDP in 2008 (Figure 18). In the case of Italy loans to firms and to households started to grow only in 1999 and, more pronouncedly, after 2003 (especially for households).
Figure 17 – Loans to non-financial corporations (% of GDP)
Figure 18 – Loans to households (% of GDP)
Source: AMECO Source: AMECO
4. THE COST OF FINANCING AND ITS DETERMINANTS
Both in Italy and in Portugal the growth of outstanding loans was facilitated by the easier access to European financial markets, which resulted from the participation in the Eurozone and the corresponding elimination of the exchange rate risk. The fast expansion of bank credit was also fostered by the deregulation of the Portuguese financial system, especially in the Portuguese case (Lagoa et al., 2013).
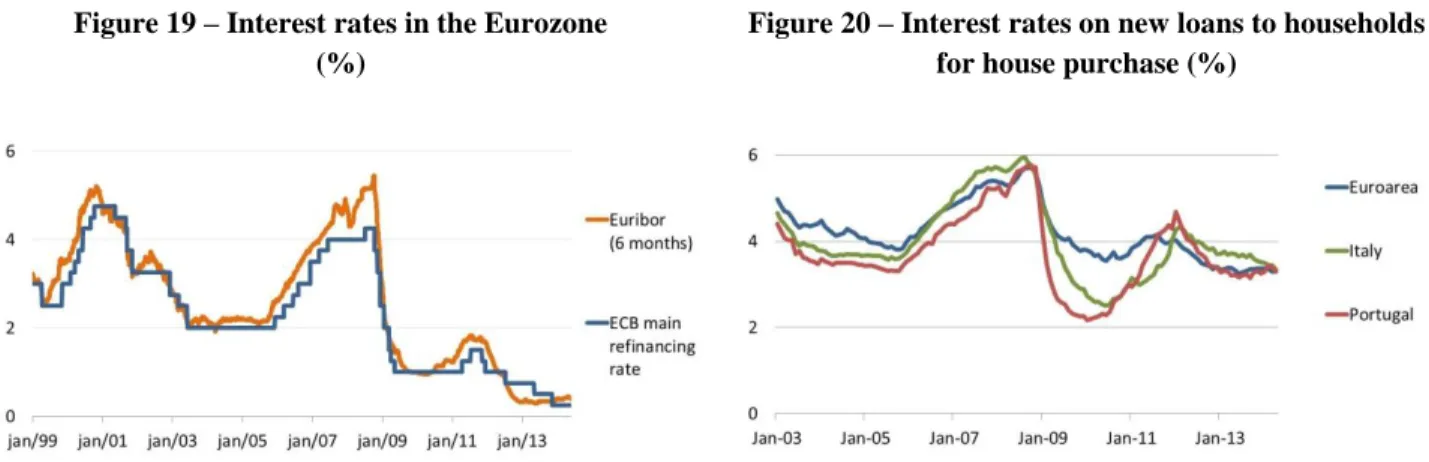
Notwithstanding, the two economies reacted in different ways to these institutional changes. In the case of Italy, the evolution of loans to both firms and household appears to be strongly related with the inception of the euro and the evolution the interest rates fixed by the ECB. For example, the growth of loans to households followed closely the evolution of the ECB’s main reference rate and of the Euribor (Euro Interbank Offered Rate – Figure 19), reaching 12,5% in 1999, slowing down to
12
DINÂMIA’CET – IUL, Centro de Estudos sobre a Mudança Socioeconómica e o Território ISCTE-IUL – Av. das Forças Armadas, 1649-026 Lisboa, PORTUGAL Tel. 210464031 - Extensão 293100 E-mail: dinamia@iscte.pt www.dinamiacet.iscte.pt
5,9% in 2011 (when ECB’s main reference interest rates reached their zenith), and then accelerated again, reaching a growth rate of 10,5% in 2005.
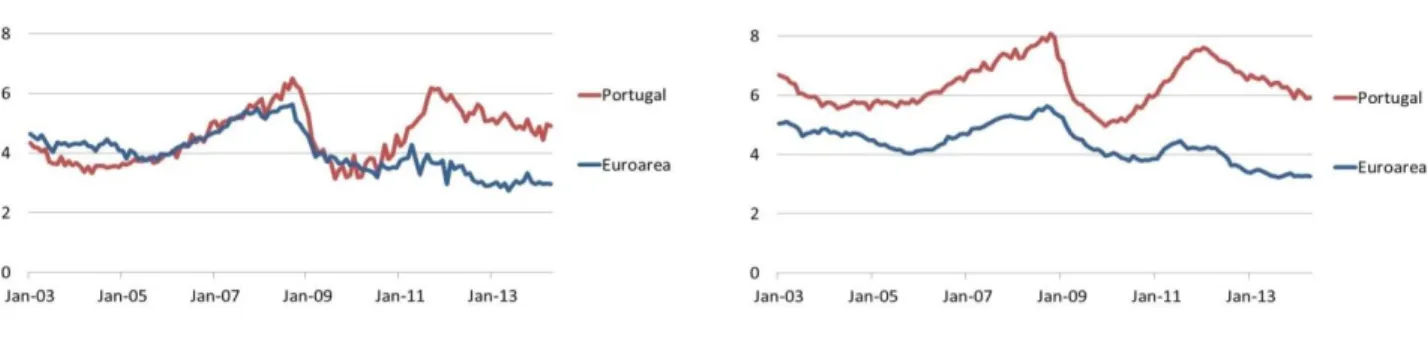
In the case of Portugal, outstanding loans to non-financial firms were relatively unresponsive to changes in the level of ECB’s interest rates after 2000, contrasting with loans to households, which kept increasing during this period. This may be explained by the particularly low levels of interest rates on new loans for house purchase in Portugal, which remained below the Eurozone average and the Italian ones during all the decade (Figure 20). This signals a fierce competition between Portuguese banks in the credit market for house purchase (see section 6.2 below).
Figure 19 – Interest rates in the Eurozone (%)
Figure 20 – Interest rates on new loans to households for house purchase (%)
Source: ECB Sources: ECB, Banca d’Italia, Banco de Portugal
In fact, in the case of Portugal, the availability of extra financial resources, deriving from participation in the Eurozone, was unevenly reflected within the private sector in terms of costs of finance. While the interest rates on loans for house purchase by households (Figure 20) and on large loans to non-financial corporations (Figure 21) were often below the Eurozone average, the interest rates faced by Portuguese firms demanding smaller loans (i.e., up to 1 M€) were on average 1.5 percentage points above the Eurozone average in the period 2003-2007 (Figure 22).
13
DINÂMIA’CET – IUL, Centro de Estudos sobre a Mudança Socioeconómica e o Território ISCTE-IUL – Av. das Forças Armadas, 1649-026 Lisboa, PORTUGAL Tel. 210464031 - Extensão 293100 E-mail: dinamia@iscte.pt www.dinamiacet.iscte.pt
Figure 21 – Interest rates on new loans to non-financial corporations, from 1M€ (%)
Figure 22 – Interest rates on new loans to non-financial corporations, up to 1M€ (%)
Source: ECB, Banco de Portugal Sources: ECB, Banco de Portugal
The higher interest rates on smaller loans to non-financial corporation are, to some extent, a reflection of the size of the firms demanding the loan. Larger firms typically have a greater bargaining power, due not only to ‘quantity discount’ effects, but also to their easier access to alternative sources of finance (both domestic and foreign). One should note, however, that the spread on smaller loans in Portugal is significantly larger than the spread on the Eurozone counterparts. This suggests that other factors were contributing to the high costs of financing for smaller loans to Portuguese firms.
One possible complementary explanation for the high costs of finance of Portuguese SME (as compared to the Eurozone standard) would be the prevalence of higher risks of default. This, however, does not result evident by looking at the incidence of non-performing loans in Portugal (Figure 23). In fact, during all the decade starting in 2000, the rate of non-performing loans in Portugal remained below the Eurozone average, and markedly below the Italian values. Between 2004 and 2008 there was even a slight reduction in the incidence of non-performing loans in Portugal, both for households and firms (Figure 24), possibly reflecting the modest, temporary improvement of economic activity.
14
DINÂMIA’CET – IUL, Centro de Estudos sobre a Mudança Socioeconómica e o Território ISCTE-IUL – Av. das Forças Armadas, 1649-026 Lisboa, PORTUGAL Tel. 210464031 - Extensão 293100 E-mail: dinamia@iscte.pt www.dinamiacet.iscte.pt
Figure 23 – Bank non-performing loans to total gross loans, households and firms (%)5
Figure 24 – Non-performing loans to total loans (%), Portugal
Source: World bank Sources: Banco de Portugal
The higher interest rate spreads for smaller loans to Portuguese firms, as compared to spreads on mortgage loans to households, may be more adequately explained by the evolution of the financial position of firms and households in Portugal. Contrarily to the Italian case, the balance sheets of Portuguese firms deteriorated fast during the second half of the 1990s (Figure 25), mainly as a result of the high investment levels in the period, which was mostly financed by bank loans. After 2000, although the level of outstanding loans to Portuguese firms remained stable (see Figure 17 above), the slow output growth did not allow for a significant improvement of corporate balance sheets. In contrast, net lending by Portuguese households remained positive after 2000, albeit at relatively low levels (Figure 26).
Figure 25 – Net lending (+) or net borrowing (-) of corporations (% of GDP)6
Figure 26 – Net lending (+) or net borrowing (-) of households (% of GDP)6
Source: AMECO Source: AMECO
5 The loan amount recorded as nonperforming is the gross value of the loan as recorded on the balance sheet, not just the amount that is overdue.
6 Net lending/net borrowing is obtaining by: summing up Gross value added, Other subsidies on production, Property income received, Net current transfers received, Capital transfers received, and Consumption of fixed capital; and subtracting Compensation of employees, Other taxes on production, Property income paid, Current taxes on income and wealth, Change in net equity of households in pension funds reserves, Capital transfers paid, Gross capital formation, and Acquisition less disposals of non-financial non-produced assets.
15
DINÂMIA’CET – IUL, Centro de Estudos sobre a Mudança Socioeconómica e o Território ISCTE-IUL – Av. das Forças Armadas, 1649-026 Lisboa, PORTUGAL Tel. 210464031 - Extensão 293100 E-mail: dinamia@iscte.pt www.dinamiacet.iscte.pt
In addition to the differences between Portuguese firms and households in the evolution of their balance sheets, Portuguese banks seem to have perceived the collateral constituted by real estate assets as highly secured. This would explain not only the lower interest rate spreads on credit to house purchase (as compared to credit to SMEs), but also the differences in the growth of loans across industries after 2000. As can be seen in Figure 27, real estate activities, the construction industry, and hotels and restaurants (which have an important component of real estate assets) registered the greatest rates of growth in bank loans between 2000 and 2007, even though the incidence of non-performing loans in these industries was above the average in the latter two industry groups (Figure 28).
Figure 27 – Average annual growth of loans by industry between 2000 and 2007 (%), Portugal
Figure 28 – Non-performing loans to total loans by industry, average 2000-2007 (%), Portugal
Source: Banco de Portugal Source: Banco de Portugal
More expectedly, manufacturing industries experienced one of the lowest rates of growth of outstanding loans, while displaying one of the highest rates on non-performing loans. In order to understand this it is necessary to take into account the factors underlying the evolution of industry structure. This is the subject of the following section.
16
DINÂMIA’CET – IUL, Centro de Estudos sobre a Mudança Socioeconómica e o Território ISCTE-IUL – Av. das Forças Armadas, 1649-026 Lisboa, PORTUGAL Tel. 210464031 - Extensão 293100 E-mail: dinamia@iscte.pt www.dinamiacet.iscte.pt
5. THE EVOLUTION OF INDUSTRY
STRUCTURE AND ITS
MAIN
DETERMINANTS
Developed economies have been going through a process of tertiarization in recent decades, with services activities absorbing a growing proportion of workers7. Accordingly, during the period under analysis, the growth of employment in finance and business services, wholesale and retail trade, and transport and communication services, has been a common feature of Italy and Portugal (as well as of other EU countries).
However, these two economies have experienced distinct evolutions in terms of total employment in manufacturing and in construction. While the number of persons working in manufacturing has stabilized in Italy between 1995 and 2007 (Figure 29), manufacturing employment in Portugal fell continuously since the late 1990s (Figure 30). As to employment in construction, this followed the patterns of investment in this industry (see Figure 10 and Figure 13 above), growing rapidly in Portugal from 1995 until the early 2000s and falling continuously thereafter, while in Italy employment in construction grew less sharply and only after 2000 (reverting the trend after 2008).
Figure 29 – Employment by industry (1.000 persons): Italy
Figure 30 – Employment by industry (1.000 persons): Portugal
Sources: AMECO Source: AMECO
In what follows we discuss in greater detail the causes underlying the evolution of employment in the construction and the manufacturing industries, in order to put into context the role played by financial (in)stability in this evolution.
7 Many different factors account for this trend, including the higher income elasticity of demand for services with regard to goods, the outsourcing of services in industrial conglomerates, the development of ICT, and the increasing role of financial activities.
17
DINÂMIA’CET – IUL, Centro de Estudos sobre a Mudança Socioeconómica e o Território ISCTE-IUL – Av. das Forças Armadas, 1649-026 Lisboa, PORTUGAL Tel. 210464031 - Extensão 293100 E-mail: dinamia@iscte.pt www.dinamiacet.iscte.pt
6. THE MAIN DETERMINANTS OF GROWTH IN BUILDING AND CONSTRUCTION ACTIVITIES
The temporary growth of employment in the building and construction industry, both in Italy and in Portugal, results from the combination of two main effects: the rise in real incomes and the growth of credit supply at historically low interest rates. This is particularly evident in the case of dwellings, especially in the Portuguese case.
The fast GDP growth experienced by Portugal between 1995 and 2000 translated into higher real wages (Figure 31) and a significant increase in households’ disposable income (Figure 32). The drop in real interest rates and the availability of credit contributed to these trends, not only through its impact on GDP and employment growth, but also due to the income effect related with the reduction of mortgage payments in households’ income.
Higher wages and lower interest rates made it possible for an increasing proportion of households to access credit for house purchase, both in Italy and in Portugal. In the case of Portugal, most of the impact of this trend on the growth of building and construction industry was felt between 1995 and 2000. After that, loans to households kept increasing (see Figure 18 above), due to the gradual increase in households’ income (that lasted until 2010 in Portugal) and, until the end of 2005, to the decrease in interest rates. However, given the boom in construction since the middle 1990s, housing needs were largely fulfilled by 2000. Therefore, an increasing share of the credit for house purchase was actually being used by households to become owners of dwellings. According to the ECB (ECB, 2009), by 2007 Portugal had one of the highest percentages in the Eurozone of dwellings that were occupied by the owner (74,5%), above Italy (69,1%) and the Eurozone average (62,3%).
Figure 31 – Compensation per employee (1000 PPS)
Figure 32 – Real adjusted gross disposable income of households (1995=100)
18
DINÂMIA’CET – IUL, Centro de Estudos sobre a Mudança Socioeconómica e o Território ISCTE-IUL – Av. das Forças Armadas, 1649-026 Lisboa, PORTUGAL Tel. 210464031 - Extensão 293100 E-mail: dinamia@iscte.pt www.dinamiacet.iscte.pt
7. THE MAIN DETERMINANTS OF GROWTH IN MANUFACTURING
INDUSTRIES
The sharp reduction in manufacturing employment since 2000 is a distinctive feature of Portuguese economy in the EU context. Between 2000 and 2007, Portugal lost jobs in manufacturing at an average annual rate of 2% (the speed of deindustrialization was only faster in UK and Malta), contrasting with the slight increase of manufacturing employment in Italy (Figure 33).
Nearly 2/3 of the jobs lost in Portuguese manufacturing occurred in the country’s traditional export industries, namely textiles and textile products, footwear, and wood and cork products (Figure 34). In these three industry groups the employment dropped by 19% between 2000 and 2006. In this respect, there is little difference between Portugal and Italy: Italy lost about 14% of the employment in the same three industry groups, during this period.
Figure 33 – Average annual change in manufacturing employment in 2000-2007 (%)
Figure 34 – Change in manufacturing employment by industry branch, 2000-2006 (1.000 persons)
Source: AMECO Sources: STAN (OECD)
The distinction between Italy and Portugal with regard to the evolution of manufacturing employment results from the former’s capacity to create jobs (in net terms) in less traditional industries – namely, fabricated metals, machinery and equipment, and electrical and optical equipment –, more than compensating the net loss of jobs in low technology-intensive industries. On the contrary, in the Portuguese case, the few manufacturing industries that experienced a
19
DINÂMIA’CET – IUL, Centro de Estudos sobre a Mudança Socioeconómica e o Território ISCTE-IUL – Av. das Forças Armadas, 1649-026 Lisboa, PORTUGAL Tel. 210464031 - Extensão 293100 E-mail: dinamia@iscte.pt www.dinamiacet.iscte.pt
positive change in employment after 2000 had a marginal impact on total manufacturing employment.
The ability of the Italian economy to compensate the loss of jobs in traditional industries through the growth of some medium technology-intensive manufacturing activities may be explained by two factors:
(i) the productive capacity already installed in the latter industries, and
(ii) the higher productivity of these industries in Italy in comparison to their Portuguese counterparts.
In fact, the industries that contributed the most to the net creation of manufacturing jobs in Italy after 2000 (fabricated metals, machinery and equipment, and electrical and optical equipment) are also the ones in which Italy had a greater comparative advantage with regard to Portugal (Figure 35). Moreover, those are among the industries in which the differences in productivity between Italy and Portugal were the greatest in 2000 (Figure 36).
Figure 35 – Difference between Italy and Portugal in the distribution of manufacturing value added in 2000
(percentage points)
Figure 36 – Value added per person employed in Italy in 2000 (Portugal=100)
20
DINÂMIA’CET – IUL, Centro de Estudos sobre a Mudança Socioeconómica e o Território ISCTE-IUL – Av. das Forças Armadas, 1649-026 Lisboa, PORTUGAL Tel. 210464031 - Extensão 293100 E-mail: dinamia@iscte.pt www.dinamiacet.iscte.pt
8. SUMMING-UP
The analysis conducted in the previous section suggests that the changes in the distribution of employment across industries in Italy and Portugal in the last two decades can be related to the following factors:
(i) the secular trend towards the tertiarization of the more advanced economies, resulting in the growth of several services activities;
(ii) the increase in real incomes, the sharp reduction of interest rates since the middle 1990s and the availability of credit, which resulted in the temporary growth of employment in building and construction (a sharp increase between 1995 and 2001, in the case of Portugal; and a gradual growth between 1999 and 2008, in the case of Italy);
(iii) the increasing exposure to competitive pressures from emerging economies, which led to the contraction of traditional manufacturing industries (especially textiles and textile products, footwear, and wood and cork products) in both countries; and
(iv) the ability to seize the opportunities opened up by globalization and EU enlargement on the basis of the prevailing industrial structure (given the installed capacity and the productivity levels), which was largely absent in the case of Portugal and resulted in the expansion of some medium technology-intensive manufacturing industries in the case of Italy (thereby compensating the contraction in employment in traditional industries).
While the impact of financial (in)stability (namely, the decrease in real interest rates and in their volatility after 1995) on the temporary growth of building and construction activities – point (ii) in the above list – is rather clear, this is not the case for the remaining drivers of structural change in the list. In the following section I discuss other factors that may influence structural change and that can be related to financial instability.
21
DINÂMIA’CET – IUL, Centro de Estudos sobre a Mudança Socioeconómica e o Território ISCTE-IUL – Av. das Forças Armadas, 1649-026 Lisboa, PORTUGAL Tel. 210464031 - Extensão 293100 E-mail: dinamia@iscte.pt www.dinamiacet.iscte.pt
9. OTHER IMPACTS OF FINANCIAL (IN)STABILITY ON THE RELATIVE
PERFORMANCE OF INDUSTRIES
The following mechanisms can be identified as possible additional links between financial (in)stability and changes in the industrial structure of Italy and Portugal since the middle 1990s:
Real exchange rate appreciation
Fierce competition in the credit market for house purchase and real estate investments
Increasing indebtedness of families and firms We will discuss each of these mechanisms in turn.
9.1. Real exchange rate appreciation
As was mentioned in section 5.1, as a reflection of the high rates of GDP growth in the second half of the 1990s, Portugal experienced a rapid increase in real wages during this period. As a result, the Portuguese real effective exchange rate remained stable until 2000 (Figure 37), in spite of a significant exchange rate depreciation of the national currency against the US dollar (Figure 38). In the same period, labor compensation in Italy increased modestly, allowing the country to gain some price-competitiveness until 2000. After that, both Italy and, to a lesser extent, Portugal have experienced a real exchange rate appreciation, largely as a result of the strong appreciation of the euro against the dollar.8
Figure 37 – Real effective exchange rates, based on unit labor costs (1996=100)
Figure 38 – Exchange rates, US Dollars per national currency unit (1995=100)
Sources: AMECO Source: AMECO
8 In contrast, Germany experienced a small real exchange depreciation, as a result of a slow growth in unit labor costs.
22
DINÂMIA’CET – IUL, Centro de Estudos sobre a Mudança Socioeconómica e o Território ISCTE-IUL – Av. das Forças Armadas, 1649-026 Lisboa, PORTUGAL Tel. 210464031 - Extensão 293100 E-mail: dinamia@iscte.pt www.dinamiacet.iscte.pt
Arguably, the evolution of the Portuguese real exchange rate since the middle 1990s has had a negative impact on the performance of domestic manufacturing firms, as well as on other producers of tradable goods. In fact, given that (i) the stability of the Portuguese real effective exchange rate (contrasting with the decrease in the Italian or the German cases) is strongly associated with the fast GDP growth and the correlated growth in real wages, and (ii) that this, in turn, was largely fostered by the steep drop in the real interest rates, one could suggest that financial (in)stability had an impact on industrial growth through its effects on real exchange rate appreciation.
Such link, nevertheless, is not immediately apparent in the data previously shown. In fact, employment in manufacturing was rather stable in the second half of the 1990s (recall Figure 30 above), falling rapidly only after 2000. However, as was mentioned above, the main driver of real exchange rate appreciation between 2001 and 2008 was the appreciation of the euro against the dollar. Therefore, the contraction of Portuguese manufacturing is more easily explained by the combination of the appreciation of the euro after 2001 and the increasing global competitive pressures in this period9, rather than by the growth of real wages.
Still, one could argue that the increase in real wages in Portugal, which partly result from the impact of lower and less volatile interest rates on investment, has had a negative impact, albeit modest, on the competitive performance of Portuguese industries. It is also possible to argue that if manufacturing employment in Portugal did not fall until 2000 this was due to the rapid growth of domestic consumption (partially fostered by the regime change in interest rates), which was soon to be proven unsustainable.
In sum, the influence of financial (in)stability on the growth of manufacturing industry through its impact on real exchange rate appreciation seems to be modest (in comparison with other determinants of real exchange rates), and was certainly less important in Italy than in Portugal.
9 Namely, those accruing from China’s accession to the World Trade Organization in 2001 and preparation of EU’s Eastern Enlargement, which was concluded in 2004.
23
DINÂMIA’CET – IUL, Centro de Estudos sobre a Mudança Socioeconómica e o Território ISCTE-IUL – Av. das Forças Armadas, 1649-026 Lisboa, PORTUGAL Tel. 210464031 - Extensão 293100 E-mail: dinamia@iscte.pt www.dinamiacet.iscte.pt
9.2. Fierce competition in the credit market for house purchase and real estate activities In section 4 it was shown that loans to house purchase in Portugal benefitted from lower interest rate spreads (as compared to credit to SMEs), while credit to real estate investments grew at a faster rate than credit to other industries between 2000 and 2007. Two reasons were given for these facts: first, the financial position of firms deteriorated fast after 1995, with the net lending of Portuguese corporations remaining distinctively negative during all the decade starting in 2000; second, Portuguese banks seem to have perceived the collateral constituted by real estate assets as highly secured, which could hardly be the case of most investment assets of manufacturing firms in the period.
In other words, having gained wide access to funding as a result of participation in the Eurozone, Portuguese banks were eager to conquer new clients through the expansion of credit. Given (i) the perceived high security of real estate assets as collateral, (ii) the continuing growth of households’ disposable income, and (iii) the uncertainty regarding the returns to manufacturing investments, Portuguese banks focused their resources in competing for clients in the credit segments related to house purchase and real estate investments. In order to attract clients in these segments, Portuguese banks lowered the corresponding interest rates spreads to minimum levels. As a result, Portuguese banks probably had to increase the spreads in other credit segments – namely, in loans for SMEs in manufacturing and other industries – in order to compensate for the low financial margins banks were getting from real estate-related credit segments. In turn, the higher costs of financing faced by Portuguese SMEs, in comparison to most of the remaining Eurozone economies, may have contributed to hinder the development of manufacturing and other industries (especially those activities which are more exposed to international competition).
9.3. Increasing indebtedness of firms and households
A clearer result of the interest rate regime change in Portugal and – at a later stage, and to a lesser extent – in Italy, was the increasing indebtedness of firms and households.
In the Portuguese case, corporate debt grew from 54% of the GDP in 1995 to 111% in 2001 (Figure 39), remaining relatively stable from then until 2007. In the same period, the debt of households as
24
DINÂMIA’CET – IUL, Centro de Estudos sobre a Mudança Socioeconómica e o Território ISCTE-IUL – Av. das Forças Armadas, 1649-026 Lisboa, PORTUGAL Tel. 210464031 - Extensão 293100 E-mail: dinamia@iscte.pt www.dinamiacet.iscte.pt
a percentage of GDP more than doubled its value, from 36% in 1995 to 74% in 2001, and kept rising until 2009 (when it reached 105% of the GDP) (Figure 40).
Figure 39 – Corporate debt10 (% of GDP)
Figure 40 – Households’ debt (% of GDP)
Source: Eurostat Sources: Eurostat
The high levels of indebtedness of firms and households amplified the exposure of the Portuguese economy to the risks of changes in interest rates and in the availability of credit. The first negative event came at the turn of the century, when the six-month Euribor jumped from 2,6% (in late 1999) to 5,2% one year later. A second shock occurred just before the international financial crisis, when the six-month Euribor jumped from 2,1% (in the summer of 2005) to 5,4% (in October 2008) (see Figure 19 above). Finally, after the advent of the Eurozone in 2010, the interest rates faced by Portuguese households and, even more so, by Portuguese firms increased substantially, in spite of the steep drop of the Euribor (see Figure 20 to Figure 22 above). This three events had an increasingly deleterious impact on the financial positions Portuguese firms and households, which translated into decreasing levels of investment and consumption (and, after 2008, on a growing incidence of defaults in bank loans - Figure 24), which largely explain the dismal performance of the Portuguese economy since the turn of the century.
Although starting at a later stage and reaching lower levels as compared to the Portuguese case, the process of indebtedness by Italian firms and households produced similar, albeit less intensive, results in the Italian economy.
25
DINÂMIA’CET – IUL, Centro de Estudos sobre a Mudança Socioeconómica e o Território ISCTE-IUL – Av. das Forças Armadas, 1649-026 Lisboa, PORTUGAL Tel. 210464031 - Extensão 293100 E-mail: dinamia@iscte.pt www.dinamiacet.iscte.pt
10.
CONCLUSION
This paper aimed to discuss the relation between financial stability/instability and industrial growth in Italy and Portugal, taking as point of departure the similarities and differences between Portugal and Italy.
Although with different intensities, both Italy and Portugal experienced very modest levels of economic growth in the years that preceded the global recession, both have seen the costs of finance increase after 2010, both had to respond with the implementation of severe austerity measures and, partially as result of this, both countries experienced a sharp drop in economic activity and a substantial increase in unemployment rates. Portugal and Italy also share a significant exposure to competitive pressures from emerging economies, due to the weight of traditional, low technology-intensive industries in their economies.
In spite of all the common features, Italy and Portugal display important differences in other respects. For our purposes, it is worth mentioning the following.
First, Portugal experienced a much faster growth of credit in the second half of the 1990s, which was driven by a deeper process of financial deregulation, as well as by an investment surge with little parallel in the EU context in that period.
Second, in contrast with the Portuguese case, the Italian manufacturing sector was able to endure the impact of globalization, compensating the contraction of traditional exporting industries with the expansion of more technological intensive manufactures (due to the already installed capacity and higher productivity levels, when compared to the Portuguese counterparts).
Third, Portuguese banks seem to have followed a more aggressive stance in competing for the mortgage- and real estate-related segments of the credit market, possibly due to the higher value attached to the corresponding collateral and the lower risk of default in these credit segments (as compare to credit to SMEs). Possibly as a result, Portuguese banks compensated the lower financial margins obtained in real estate-related segments with wider interest rate spreads in credit to SMEs.
Forth, the level of indebtedness reached by Portuguese firms and households was one of the highest at the EU level, two to three times the levels found in Italy.
26
DINÂMIA’CET – IUL, Centro de Estudos sobre a Mudança Socioeconómica e o Território ISCTE-IUL – Av. das Forças Armadas, 1649-026 Lisboa, PORTUGAL Tel. 210464031 - Extensão 293100 E-mail: dinamia@iscte.pt www.dinamiacet.iscte.pt
Fifth, the aforementioned aspects translated into a drop in investment (in volume) in Portugal between 2000 and 2007, a situation which has no parallel at the EU level.
Finally, given the higher indebtedness levels and weaker character of its productive fabric, Portugal has been more exposed to the successive crises of recent years, which translated into a higher increase in the costs of finance, a steeper drop in investment, and a more pronounced increase in unemployment, as compared to Italy.
In sum, with regard to the relation between financial stability/instability and industrial growth in Italy and Portugal, one can say that:
Italy was less affected then Portugal by the decrease in interest rates and their volatility after 1990s;
In both countries the construction industry and the real estate activities experienced a temporary growth, which happened (and ended) sooner and to a larger extent in the Portuguese case;
The evolution of the manufacturing industry in both countries is largely a result of factors that are essentially unrelated with financial (in)stability (although it might be argued that the latter had some indirect impact on the price-competitiveness and on corporate balance sheets); and
Both in Italy and in Portugal industrial growth has been severely hit by the international financial crisis of 2007/2008 and its economic and financial sequelae.
11.
REFERENCES
EC (2011), “The Economic adjustment program for Portugal”. Directorate-General for Economic
and Financial Affairs Occasional Papers 79.
ECB (2009), “Housing Finance in the Euro Area”. ECB Occasional Paper 101.
Lagoa, S.; Leão, E.; Mamede, R.; Barradas, R., (2013). “Report on the financial system in Portugal”, FESSUD Studies in Financial Systems No. 9.