*Corresponding author E-mail [email protected] (D.B. Lima).
aUniversidade Federal de Alfenas, Alfenas, MG, Brazil. bUniversidade de São Paulo, São Paulo, SP, Brazil.
Received on March 15, 2017; approved on July 27, 2017; available online on March 22, 2018.
VITAMIN A DEFICIENCY IN BRAZILIAN
CHILDREN AND ASSOCIATED VARIABLES
Deficiência de vitamina A em crianças brasileiras e variáveis associadas
Daniela Braga Lima
a,*, Lucas Petri Damiani
b, Elizabeth Fujimori
bObjective: To analyze the variables associated with vitamin A deficiency (VAD) in Brazilian children aged 6 to 59 months, considering a hierarchical model of determination.
Methods: This is part of the National Survey on Demography and Health of Women and Children, held in 2006. Data analysis included 3,417 children aged from six to 59 months with retinol data. Vitamin A deficiency was defined as serum retinol <0.7 mol/L. Univariate and multiple Poisson regression analysis were performed, with significance level set at 5%, using a hierarchical model of determination that considered three conglomerates of variables: those linked to the structural processes of community (socioeconomic-demographic variables); to the immediate environment of the child (maternal variables, safety and food consumption); and individual features (biological characteristics of the child). Data were expressed in prevalence ratio (PR). Results: After adjustment for confounding variables, the following remained associated with VAD: living in the Southeast [PR=1,59; 95%CI 1,19–2,17] and Northeast [PR=1,56; 95%CI 1,16–2,15]; in urban area [RP=1,31; 95%CI 1,02–1,72]; and mother aged
≥36 years [RP=2,28; 95%CI 1,37–3,98], the consumption of
meat at least once in the last seven days was a protective factor [PR=0,24; 95%CI 0,13–0,42].
Conclusions: The main variables associated with VAD in the country are related to structural processes of society and to the immediate, but not individual, environment of the child. Keywords: Vitamin A deficiency; Child health; Child nutrition; Nutrition, public health.
Objetivo: Analisar variáveis associadas à deficiência de vitamina A (DVA) em crianças brasileiras de 6 a 59 meses de idade, considerando um modelo hierárquico de determinação. Métodos: Trata-se de um recorte da Pesquisa Nacional de Demografia e Saúde da Criança e da Mulher (PNDS), realizada em 2006. A análise dos dados incluiu 3.417 crianças de seis a 59 meses com dados de retinol. A DVA foi definida como retinol sérico <0,7 mmol/L. Realizaram-se análises univariada e ajustada por regressão múltipla de Poisson, com nível de significância de 5%, utilizando-se modelo hierárquico de determinação que considerou três blocos de variáveis: vinculadas aos processos estruturais da sociedade (variáveis socioeconômicas e demográficas); ao ambiente imediato da criança (variáveis maternas, de segurança e consumo alimentar); e individuais (características biológicas da criança). Os dados foram expressos em razão de prevalência (RP). Resultados: Após ajuste para variáveis de confusão, permaneceram associadas à DVA: residir no Sudeste [RP=1,59; IC95% 1,19–2,17] e no Nordeste [RP=1,56; IC95% 1,16–2,15]; em zona urbana [RP=1,31; IC95% 1,02–1,72]; ter mãe com idade ≥36 anos [RP=2,28; IC95%
1,37–3,98]; sendo proteção consumir carne pelo menos uma vez nos últimos sete dias [RP=0,24; IC95% 0,13–0,42].
Conclusões: As principais variáveis associadas à DVA no país relacionam-se aos processos estruturais da sociedade e ao ambiente imediato da criança, e não aos individuais.
Palavras-chave: Deficiência de vitamina A; Saúde da criança; Nutrição da criança; Nutrição em saúde pública.
INTRODUCTION
Vitamin A deficiency (VAD) stands out as an important nutritional problem, especially in middle- and lower-income countries, with more obvious consequences at life stages with higher nutritional demand such as early childhood. VAD in children is one of the most important causes of preventable blindness and a major contributor to morbidity and mortal-ity from infections, which affect the poorest segments of the population.1-3
The overall prevalence of VAD in children under five years of age was estimated at 33% from 1995 to 2005, a number that stands for a serious public health issue in 73 countries (preva-lence >20%) and moderate (preva(preva-lence 10-20%) in 49 coun-tries, including Brazil, where the prevalence was estimated at 13%.4 Reviews of Brazilian literature, however, have shown a
median prevalence of 32%, quite above the estimates by the World Health Organization (WHO), especially in the regions of Vale do Jequitinhonha and Mucuri in the State of Minas Gerais, and Ribeira in the State of São Paulo.5-7
For the first time in the country, data on serum retinol were obtained in the last National Demography and Health Survey on Children and Women (PNDS in the Portuguese acronym), conducted in 2006, which revealed inadequate levels of vita-min A in 17.4% of children aged 6 to 59 months of age, with marked regional differences and persisting as a moderate pub-lic health problem in the country.8
Inadequate intake of dietary sources of vitamin A to meet physiological needs stands out as the main cause of VAD,4 but other variables have also been associated with
childhood VAD, including social, economic, and environ-mental conditions,3,9-12 maternal characteristics,9,13,14
nutri-tional status,6 infections13-15, and children’s age range.9,16
However, these associations are not always considered, since the studies are not conclusive in identifying factors associ-ated with infant VAD.
Aiming to contribute to the understanding of variables associated with VAD in the field of collective health, which conceives health-disease dyad as a socially determined pro-cess,17 the present study assumes that what determines VAD
is an interrelation of elements of different dimensions that should be studied through a hierarchical approach. A study carried out in Pernambuco, which adopted a hierarchical explanatory model, pointed several aspects still lacking clarification so one can understand the variables associated with VAD.10,13
Thus, even being acknowledged as a relevant and well-ex-ploited problem, there are still epidemiological spectra to be investigated, with emphasis to the fact that, in this context, few studies have analyzed food safety and consumption related to
children. Despite being disclosed in a public report, the data about serum retinol first nationally obtained by PNDS/2006 were not explored with respect to these variables, so we consid-ered pertinent to carry out this analysis in Brazilian children, on the basis of a hierarchical model — purpose of this paper.
METHOD
This is a cut from PNDS/2006, whose data are in public domain and available online (http://bvsms.saude.gov.br/bvs/ pnds/banco_dados.php).
PNDS/2006 was approved by a national ethics committee and conducted in accordance with ethical standards.8 It is a
cross-sectional study of national representativeness whose purpose was to characterize the population of women of child-bearing age and children under five years of age in the five macro-re-gions of the country. The description of the method, includ-ing samplinclud-ing and selection techniques in multi-stage analy-sis units, procedures for data collection, internal conanaly-sistency checking, laboratory analysis, anthropometric measurement means, and ethical aspects are available in the official PNDS 2006 report. Serum retinol levels have been determined in 3,499 children.8
The present study analyzed data from 3,417 children, 82 being excluded because of blood samples unsuitable for retinol analysis. To evaluate the accuracy and validity of the sample, the design effect (Deff) was calculated and the sample weights adopted by PNDS/2006 were considered, resulting in a large sample of 9,206,000 children.
Serum retinol levels were assessed by high performance liq-uid chromatography (HPLC).8 The criteria recommended by
WHO were used to classify VAD as to level of epidemiologi-cal importance for public health:18 mild importance for
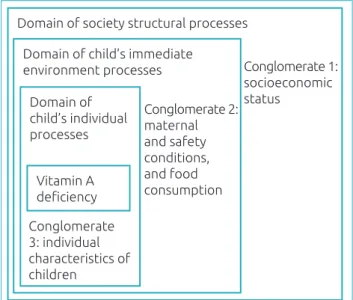
prev-alence <10%; moderate for 10 to 20%; and severe for >20%. VAD was the outcome variable. The exploratory variables were categorized into three conglomerates, while sticking to a hierarchical model for VAD determination previously elabo-rated based on the theoretical relations proposed to explain its occurrence.10,13 The first one (conglomerate 1) held variables
relating to structural processes, determined by social and eco-nomic policies that directly affect the population’s living con-ditions (socioeconomic and demographic concon-ditions). The sec-ond one (conglomerate 2) encompassed variables related to the immediate environment the child was part of (maternal vari-ables, food safety and consumption); and the last one (con-glomerate 3) was consisted of infant variables (children’s indi-vidual characteristics) (Figure 1).
area of residence (urban and rural); socioeconomic status (A to E) according to the Brazilian Association of Research Companies19, and per capita income (<0.5 minimum wage and ≥0.5 minimum wage). In conglomerate 2, maternal variables analyzed were: age (<20 years, 20 to 35 years, and ≥36 years), and years of study (0 to 4 years, 5 to 8 years, and 9 and over); food safety, as per the Brazilian Scale of Food Insecurity (com-posed of 15 questions assessing their concern with lack of food, impairment of family food quality, and quantitative restriction on food availability, with families classified according to the following four categories: food safety, mild unsafety, moder-ate unsafety, severe unsafety);20 and food consumption over
the last seven days, according to food groups (Cereals/dough and pasta, vegetables, fruits, beans, sweets).
The exploratory variables of block 3 included infant charac-teristics: age (<2 years and ≥2 years); gender (female or male); breastfeeding at any time (yes/no); exclusive breastfeeding (EBF) (<30 days and ≥30 days); Total time of breastfeeding (BF) (<6 months, 6 to 11 months, ≥12 months); supplemen-tation of vitamin A and iron (yes/no); hospitalization over the last 12 months (yes/no). Anemia (yes/no) was defined as hemoglobin (Hb) <11 g/dL, assessed by the cyanometahe-moglobin method;8 nutritional status was analyzed by body
mass index per age (BMI/age), according to WHO refer-ence standard for Z score, as eutrophic (-2 Z score ≤BMI/ age ≤+2 Z score), lean (BMI <-2 Z score), and overweight (BMI >+2 Z score).21
The parameters and respective 95% confidence intervals (95%CI) were estimated for the expanded data while considering
the sample design effect. The strength of association between the outcome variable and the exploratory variables was ana-lyzed by prevalence ratio (PR) and Poisson regression, with a significance level at 5%.
Upon the multiple analysis, the input of exploratory vari-ables to the model followed a previously established hierarchical order. Variables were picked by stepwise forward selection for the model, the value p≥0.20 being the exclusion criterion at each step. However, the variables economic level; food safety; maternal years of study; consumption of vegetables, fruits and beans; age; hospitalization in previous 12 months; and BMI/age of children not presenting significance at p<0.20 level in the univariate analysis were maintained in the final model of VAD, in view of their relevance when determining this deficiency.10,13
The statistical package “R” version 2.12.2 (R Foundation for Statistical Computing, Vienna, Austria, http://www.R-proj-ect.org) was used for the analysis.
RESULTS
VAD prevalence was 17.5% (95%CI 15.1-20.2%) and Table 1 shows the results of crude analyses for the studied outcome. In the univariate analysis, the variables of conglomerate 1 and part of conglomerate 2 statistically associated (p <0.05) with the occurrence of VAD were: macroregion of residence (p<0.001), with higher incidence in the Southeast and Northeast; resi-dence in urban area (p=0.027), and maternal age above 36 years (p<0.001). The variable maternal years of study was not signifi-cantly associated with VAD; however, children of mothers with less than five years of schooling were pointed as more likely to have VAD. Added to that, a significant number of children with AVD were found to be in severe food unsafety, but no significant association between the variables analyzed was found.
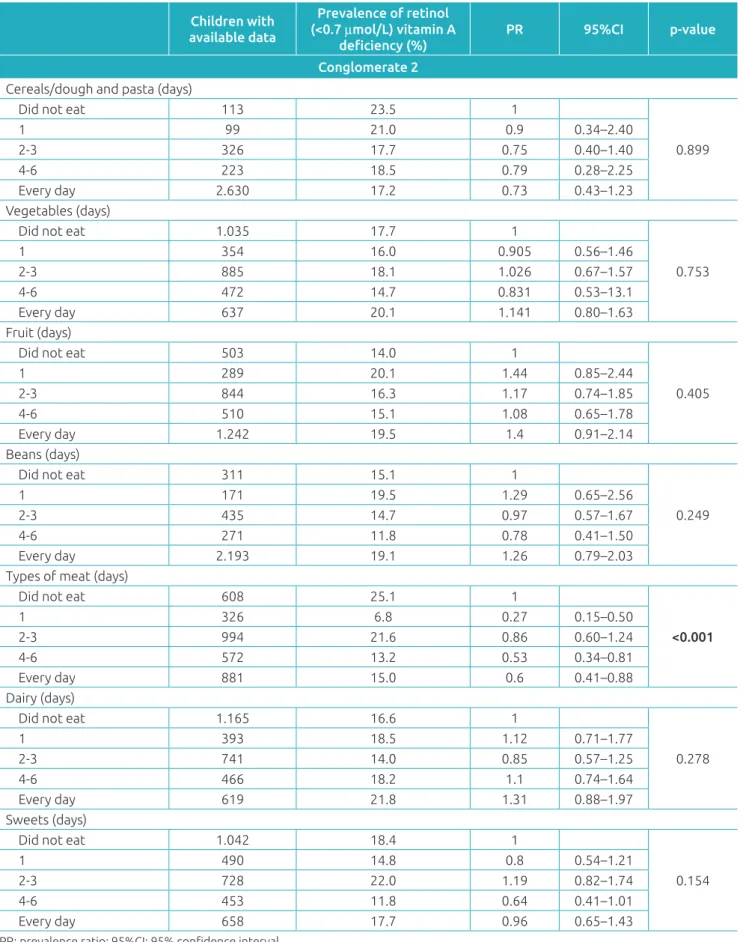
As to food consumption in the last seven days (conglomerate 2), the prevalence of VAD was statistically associated (p<0.05) with meat consumption as a protective factor (PR=0.60, 95%CI 0.41-0.88). The food basis of children was found to be rep-resented by the group of cereals/dough and pasta (n=2,630) and beans (n=2,193), for these were consumed “every day”, with inadequacy in other food groups’ consumption (Table 2).
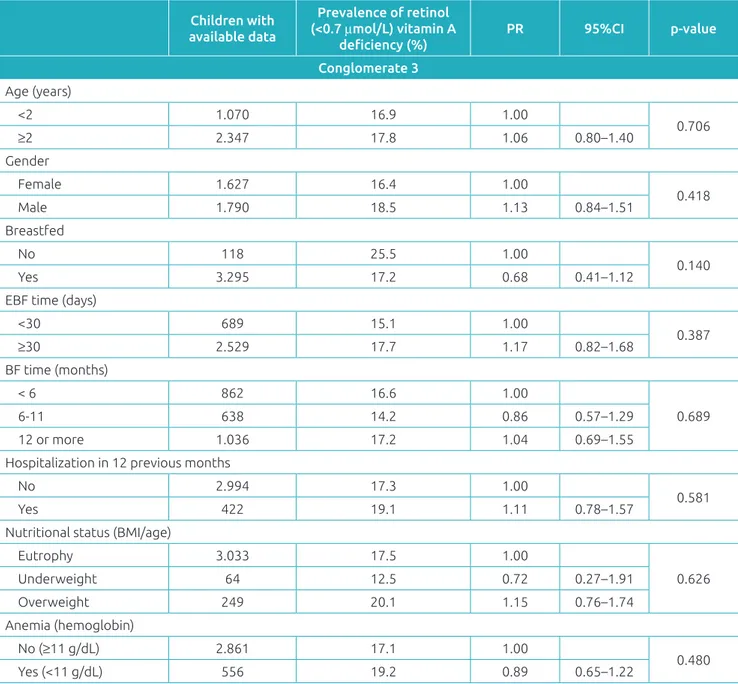
No statistical association was seen between VAD and indi-vidual characteristics of children in the univariate analysis (con-glomerate 3) (Table 3). The high incidence of VAD (16.9%) among children who used prophylactic vitamin A supplemen-tation (not shown in table) drew attention.
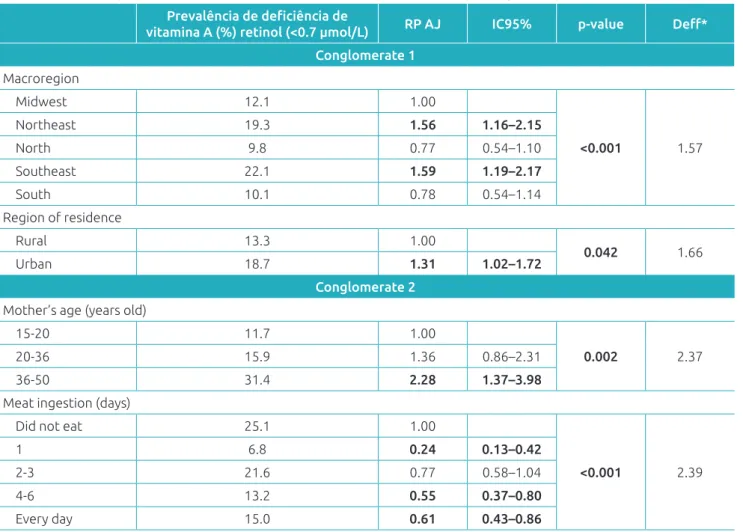
Table 4 shows the variables that remained in the multiple analysis model after adjustment. From conglomerate 1, AVD was associated with: residence in the northeast (PR=1.56, 95%CI 1.16-2.15) and southeast macroregions (PR=1.59, 95%CI,
Figure 1. Hierarchical model proposed for the analysis
of variables associated with vitamin A deficiency.
Domain of society structural processes
Domain of child’s immediate environment processes
Domain of child’s individual processes
Vitamin A deficiency
Conglomerate 1: socioeconomic status
Conglomerate 2: maternal and safety conditions, and food consumption
Conglomerate 3: individual characteristics of children
1.19-2.17); in the urban area (PR=1.31, 95%CI 1.02-1.72); mother aged ≥36 years (PR 2.28, 95%CI 1.37-3.98), with meat consumption at least once in the last seven days being a pro-tective factor (PR=0.24, 95%CI, 0.13-0.42) (conglomerate 2).
DISCUSSION
In the context of variables related to structural processes, VAD was associated with the macroregion of residence, with higher prev-alence among children living in the southeast, one of the most
Children with available data
Prevalence of retinol
(<0.7 μmol/L) vitamin A
deficiency (%)
PR 95%CI p-value
Conglomerate 1
Macroregion
Midwest 667 12.1 1.000
<0.001
Northeast 657 19.3 1.590 1.13–2.23
North 822 9.8 0.810 0.55–1.18
Southeast 672 22.1 1.820 1.28–2.59
South 599 10.1 0.830 0.56–1.25
Region of residence
Rural 1.268 13.3 1.000
0.027
Urban 2.149 18.7 1.410 1.04–1.91
Family socioeconomic status
A 26 29.0 1.000
0.844
B 374 18.3 0.630 0.23–1.72
C 1.600 17.8 0.610 0.26–1.46
D 877 17.3 0.600 0.25–1.45
E 539 15.2 0.520 0.21–1.31
Per capita income (minimum wage)
<0.5 1.889 16.2 0.790 0.57–1.10
0.167
≥0.5 925 20.4 1.000
Mother’s years of study
0-4 1.476 16.8 1.040 0.75–1.43
0.406
5-8 1.021 20.2 1.250 0.86–1.81
9 and older 823 16.2 1.000
Conglomerate 2
Mother’s age (years old)
15-20 262 11.7 1.000
<0.001
20-36 2.716 15.9 1.360 0.80–2.29
36-50 439 31.4 2.680 1.47–4.90
Food safety
Food safety 1.556 16.8 1.000
0.317
Mild unsafety 913 19.1 1.137 0.81–1.60
Moderate unsafety 498 14.0 0.834 0.55–1.27
Severe unsafety 344 22.6 1.342 0.89–2.02
Table 1 Prevalence of Vitamin A deficiency in children aged 6 to 59 months according to socioeconomic, mother,
and food safety variables.
Table 2 Prevalence of vitamin A deficiency in children aged 6 to 59 months according to the food consumption
and food groups in the previous seven days.
Children with available data
Prevalence of retinol
(<0.7 μmol/L) vitamin A
deficiency (%)
PR 95%CI p-value
Conglomerate 2
Cereals/dough and pasta (days)
Did not eat 113 23.5 1
0.899
1 99 21.0 0.9 0.34–2.40
2-3 326 17.7 0.75 0.40–1.40
4-6 223 18.5 0.79 0.28–2.25
Every day 2.630 17.2 0.73 0.43–1.23
Vegetables (days)
Did not eat 1.035 17.7 1
0.753
1 354 16.0 0.905 0.56–1.46
2-3 885 18.1 1.026 0.67–1.57
4-6 472 14.7 0.831 0.53–13.1
Every day 637 20.1 1.141 0.80–1.63
Fruit (days)
Did not eat 503 14.0 1
0.405
1 289 20.1 1.44 0.85–2.44
2-3 844 16.3 1.17 0.74–1.85
4-6 510 15.1 1.08 0.65–1.78
Every day 1.242 19.5 1.4 0.91–2.14
Beans (days)
Did not eat 311 15.1 1
0.249
1 171 19.5 1.29 0.65–2.56
2-3 435 14.7 0.97 0.57–1.67
4-6 271 11.8 0.78 0.41–1.50
Every day 2.193 19.1 1.26 0.79–2.03
Types of meat (days)
Did not eat 608 25.1 1
<0.001
1 326 6.8 0.27 0.15–0.50
2-3 994 21.6 0.86 0.60–1.24
4-6 572 13.2 0.53 0.34–0.81
Every day 881 15.0 0.6 0.41–0.88
Dairy (days)
Did not eat 1.165 16.6 1
0.278
1 393 18.5 1.12 0.71–1.77
2-3 741 14.0 0.85 0.57–1.25
4-6 466 18.2 1.1 0.74–1.64
Every day 619 21.8 1.31 0.88–1.97
Sweets (days)
Did not eat 1.042 18.4 1
0.154
1 490 14.8 0.8 0.54–1.21
2-3 728 22.0 1.19 0.82–1.74
4-6 453 11.8 0.64 0.41–1.01
Every day 658 17.7 0.96 0.65–1.43
developed regions of Brazil, similarly to children living in the northeast, one of the poorest regions of the country. This shows that VAD is not restricted to microregions presenting the great-est severity of VAD disorders, such as the Vale do Jequitinhonha and Mucuri regions in the State of Minas Gerais, and Ribeira in the State of São Paulo.5,6
Thus, one could questioned whether VAD would have a trans-social character, once it affects both the least and the most developed macroregions of the country and whether the National Vitamin A Supplementation Program (Vitamina A Mais) should be expanded, once its expansion has contemplated all
municipalities in the northeast region since the 1980s; the ones composing the Legal Amazon since 2010 and, since 2012, all municipalities in the north, 585 municipalities member of the program “Brasil Sem Miséria” (Brazil without Extreme
Poverty) in the midwest, south and southeast regions, as well as all indigenous special health districts.7
Although the population living in rural areas is the most vulnerable to nutritional deficiencies worldwide, as they face greater difficulty in accessing health services, education, and acquiring food of better nutritional value,4 in Brazil, VAD
prevails in urban areas, as verified in the State of Pernambuco,13
Children with available data
Prevalence of retinol
(<0.7 μmol/L) vitamin A
deficiency (%)
PR 95%CI p-value
Conglomerate 3
Age (years)
<2 1.070 16.9 1.00
0.706
≥2 2.347 17.8 1.06 0.80–1.40
Gender
Female 1.627 16.4 1.00
0.418
Male 1.790 18.5 1.13 0.84–1.51
Breastfed
No 118 25.5 1.00
0.140
Yes 3.295 17.2 0.68 0.41–1.12
EBF time (days)
<30 689 15.1 1.00
0.387
≥30 2.529 17.7 1.17 0.82–1.68
BF time (months)
< 6 862 16.6 1.00
0.689
6-11 638 14.2 0.86 0.57–1.29
12 or more 1.036 17.2 1.04 0.69–1.55
Hospitalization in 12 previous months
No 2.994 17.3 1.00
0.581
Yes 422 19.1 1.11 0.78–1.57
Nutritional status (BMI/age)
Eutrophy 3.033 17.5 1.00
0.626
Underweight 64 12.5 0.72 0.27–1.91
Overweight 249 20.1 1.15 0.76–1.74
Anemia (hemoglobin)
No (≥11 g/dL) 2.861 17.1 1.00
0.480
Yes (<11 g/dL) 556 19.2 0.89 0.65–1.22
Table 3 Prevalence of Vitamin A deficiency in children aged 6 to 59 months according to infant variables.
but contrary to what happened in the semi-arid region of the State of Alagoas.22 The intense urbanization process that the
country has experienced in the last decades could justify this result, from 56% in 1970 to 84% in 2010, as well as the increas-ing metropolitan agglomerations in absolute terms from 27 to 70 million between 1970 and 2010.23 This change favors
eco-nomic activities, but also diffuses new patterns of social rela-tions and life styles that exacerbate inequality, resulting in peo-ple living in precarious conditions, especially in the periphery, with important impact on living conditions due to the lack of work opportunities, low wages, and unhealthy housing con-ditions, all negatively interfering with people’s health status.23
Moreover, compared to the urban area residents, people from the rural area consume more basic and better-quality food, predominantly rice, beans, cassava, sweet potatoes, fruits, meat, pork, chicken, and fish, while ultra-processed food intake pre-dominate in urban areas.24-26 Thus, the locus of poverty and child
malnutrition appears to have gradually changed from rural to urban areas. It is noteworthy that even though these children
seem to be well fed, with enough calories to maintain their daily activities, they may suffer from “hidden hunger”, caused by the lack of micronutrients such as vitamin A, iron or zinc, all essential for child growth and development as herein stated.
When it comes to structural processes, there was no evi-dence of association between VAD and social class or per cap-ita income. This result has also been obtained in national and international population studies.3,10-13,15 In fact, with the
excep-tion of extreme poverty situaexcep-tions, income does not seem to act as a factor associated with this deficiency, reinforcing the thesis that inadequate intake of food containing this micronu-trient could be the main cause of VAD.4,24
The matter of food safety and VAD has been little investigated in Brazil. Only two studies conducted in the Northeast are highlighted, one of which showed lower ret-inol levels among children from families considered to live in moderate to severe food unsafety, but with no statistical association,10 and the other did not find any association,27
similarly to the present study. When it comes to the child’s
Prevalência de deficiência de
vitamina A (%) retinol (<0.7 µmol/L) RP AJ IC95% p-value Deff*
Conglomerate 1
Macroregion
Midwest 12.1 1.00
<0.001 1.57
Northeast 19.3 1.56 1.16–2.15
North 9.8 0.77 0.54–1.10
Southeast 22.1 1.59 1.19–2.17
South 10.1 0.78 0.54–1.14
Region of residence
Rural 13.3 1.00
0.042 1.66
Urban 18.7 1.31 1.02–1.72
Conglomerate 2
Mother’s age (years old)
15-20 11.7 1.00
0.002 2.37
20-36 15.9 1.36 0.86–2.31
36-50 31.4 2.28 1.37–3.98
Meat ingestion (days)
Did not eat 25.1 1.00
<0.001 2.39
1 6.8 0.24 0.13–0.42
2-3 21.6 0.77 0.58–1.04
4-6 13.2 0.55 0.37–0.80
Every day 15.0 0.61 0.43–0.86
Table 4 Final multiple model for variables associated with Vitamin A deficiency.
immediate environment, association between VAD and low maternal schooling, often found in national and interna-tional surveys, is also emphasized,6,9,11,14 but was not pointe
out in Pernambuco.13 Not finding any association between
this micronutrient deficiency and important structural vari-ables or children’s immediate environment calls for deeper inquiry, but this result suggests that VAD is likely to derive from poor dietary sources of vitamin A such as products of animal origin or containing beta-carotene, because feeding habits, besides being dependent of economic conditions, is a cultural practice.11
Thus, this analysis of children’s food consumption at the national level fills an important gap in the investigations about variables associated with VAD in the country. In fact, the con-sumption of meat once in the last seven days remained, in the final model, as a protective against the nutritional deficiency studied, adding importance to the role of diet, when it comes to vitamin A consumption and bioavailability, as the main fac-tor associated with VAD.4,24 This derives from the greater
bio-conversion (absorption + bioavailability) of vitamin A present in products of animal origin (retinol) compared to the form it is found in plant-origin products (carotenoids with provita-min A activity).7,24 Thus, the consumption of meat, a source
of preformed vitamin A, is a complementary data that rein-forces the explanatory model of serum retinol levels found in the children of our sample.
In addition, it was reiterated that children’s feeding basis was represented by the group of cereals/dough/pasta and beans, consumed “every day”, while almost one third of other food groups were not consumed, including dairy products (even children aged 6 to 59 months), vegetables; low consumption of fruit, important sources of vitamin A, in the week prior to study was also noted. Such feeding pat-tern had already been detected in the 1990s and, along with breastfeeding interruption and early introduction of com-plementary food, explained the greater incidence of VAD in children younger than 24 months.28 Despite the evidence
that children between 12 and 48 months of age have lower consumption of vitamin-A rich food compared to the other age groups,24 this study found no difference as to the
prev-alence of VAD according to age.
VAD was associated with maternal older age, contradict-ing a previous study which explained higher frequency of VAD in urban children of younger mothers with maternal inexperience for the care of their children, resulting in insuf-ficient provision of vitamin A.13 The greater participation
of women in the labor market could partially explain this finding, although a study with children from urban areas of nine municipalities in the State of Paraíba, northeast region
of Brazil, has not pointed out any association between VAD and maternal age.15
This analysis did not find associations with individual vari-ables of the child, which suggests that VAD, like other priva-tion-related problems, is tied to structural processes of society and to the immediate environment of children and lingers in low-income countries and continents, as well as in less favored regions and families.11 Thus, the incidence found in the
south-east region, the richest macroregion of the country, requires more detailed investigation for deep understanding.
It should be noted that, even with the decrease found, the prevalence of childhood VAD in Brazil remains higher than WHO’s estimate (13.3%) and a moderate public health prob-lem in the country.4 However, not having infectious processes
evaluated is an important limitation of this study, as they tend to decrease serum retinol concentrations in the first 24 hours of installation,29 which means that the prevalence may have
been overestimated. Having food consumption in the last seven days assessed, on the other hand, is a substantial step forward in studies of this nature.
One could hypothesize that VAD reduction is related to prevention and control strategies adopted by the govern-ment, such as the interventions proposed under the National Food and Nutrition Policy and the National Vitamin A Supplementation Program, which recommends the distribu-tion of vitamin A megadose capsules to children aged 6 to 59 months in areas considered to be at risk for this nutritional deficiency.7,25 Results≈indicate, however, that VAD control
must be extended beyond areas at risk, as there is evidence that vitamin A supplementation reduces the mortality of children aged 6 to 59 months by 24%.2 However, it is worth noting
that VAD was shown high even among children under vita-min A supplementation (16.9%), which may be related to the use of medication to treat VAD already installed, but not as prophylaxis, as recommended; this further reinforces the need for improvements in operations of the National Vitamin A Supplementation Program, with view to both preventing and controlling this deficiency.
In summary, the results indicate that the main variables associated with VAD across the country are related to struc-tural processes of society and the immediate, but not individ-ual, environment of the child. Thus, controlling this nutritional deficiency that persists as a moderate public health problem requires investments not only in the healthcare field. In addi-tion to starting the supplementaaddi-tion program where it does not exist yet, like the southeast region, and strengthening the
coverage where it is weak, one must seek more sustainable solutions such as improving the intake of vitamin-a rich food.
Funding
This study did not receive funding.
Conflict of interests
The authors declare no conflict of interests.
REFERENCES
1. World Health Organization. Guideline: vitamin A supplementation in infants and children 6–59 months of age. Geneva: WHO; 2011.
2. Mayo-Wilson E, Imdad A, Herzer K, Yakoob MY, Bhutta ZA. Vitamin A supplements for preventing mortality, illness, and blindness in children aged under 5: systematic review and meta-analysis. BMJ. 2011;343:1-19.
3. Sherwin JC, Reacher MH, Dean WH, Ngondi J. Epidemiology of vitamin A deficiency and xerophthalmia in at-risk populations. Trans R Soc Trop Med Hyg. 2012;106:205-14.
4. World Health Organization. Global prevalence of vitamin A deficiency in populations at risk 1995-2005. WHO global database on vitamin a deficiency. Geneva: WHO; 2009. 5. Milagres RC, Nunes LC, Pinheiro-Sant’Ana HM. Vitamin A
deficiency among children in Brazil and worldwide. Ciênc Saúde Coletiva. 2007;12(5):1253-66.
6. Ramalho RA, Padilha P, Saunders C. Critical analysis of Brazilian studies about vitamin A deficiency in maternal-child group. Rev Paul Pediatr. 2008;26:392-9.
7. Brasil. Ministério da Saúde. Secretaria de Atenção à Saúde. Manual de condutas gerais do Programa Nacional de Suplementação de Vitamina A. Brasília: Ministério da Saúde; 2013.
8. Brasil. Ministério da Saúde. Pesquisa Nacional de Demografia e Saúde da Criança e da Mulher. PNDS 2006: Dimensões do processo reprodutivo e da saúde da criança. Brasília: Ministério da Saúde; 2009.
9. Paiva AA, Rondó PH, Gonçalves-Carvalho CM, Illison VK, Pereira JA, Vaz-de-Lima LR, et al. Prevalence and factors associated with vitamin A deficiency in preschool children from Teresina, Piauí, Brazil. Cad Saúde Pública. 2006;22:1979-87.
10. Oliveira JS, Lira PI, Osório MM, Sequeira LA, Costa EC, Gonçalves FC, et al. Anemia, hypovitaminosis A and food insecurity in children of municipalities with Low Human Development Index in the Brazilian Northeast. Rev Bras Epidemiol. 2010;13:651-64.
11. Stevens GA, Bennett JE, Hennocq Q, Lu Y, De-Regil LM, Rogers L, et al. Trends and mortality effects of vitamin A deficiency in children in 138 low-income and middle-income countries between 1991 and 2013: pooled analysis of population-based surveys. Lancet Glob Health. 2015;3:e528-36.
12. Kurihayashi AY, Augusto RA, Escaldelai FM, Martini LA. Vitamin A and D status among child participants in a food supplementation program. Cad Saúde Pública. 2015;31:531-42.
13. Miglioli TC, Fonseca VM, Gomes Jr SC, Lira PIC, Batista Filho M. Vitamin a deficiency in mothers and children in the state of Pernambuco. Ciênc Saúde Coletiva. 2013;18:1427-40. 14. Queiroz D, Paiva AA, Pedraza DF, Cunha MA, Esteves GH,
Luna JG, et al. Vitamin A deficiency and associated factors in children in urban areas. Rev Saúde Pública. 2013;47:248-56. 15. Silva LL, Peixoto MR, Hadler MC, Silva SA, Cobayashi F,
Cardoso MA. Vitamin A status and associated factors in infants attending at Primary Health Care in Goiânia, Goiás, Brazil. Rev Bras Epidemiol. 2015;18:490-502.
16. Sales MC, Paiva AA, Queiroz D, Costa RA, Cunha MA, Pedraza DF. Nutritional status of iron in children from 6 to 59 months of age and its relation to vitamin A deficiency. Nutr Hosp. 2013;28:734-40.
17. Rocha PR, David HM. Determination or determinants? A debate based on the Theory on the Social Production of Health. Rev Esc Enferm USP. 2015;49:129-35.
18. World Health Organization. Indicators for assessing vitamin A deficiency and their application in monitoring and evaluating intervention programmes. Geneva: WHO; 1996.
19. Associação Brasileira de Empresas de Pesquisa. Critério padrão de classificação econômica Brasil [Internet]. 2008 [cited on Dec 09, 2011]. Available from: http://www.abep. org/criterio-brasil
20. Segall-Corrêa AM, Pérez-Escamilla R, Maranha LK, Sampaio MFA, Marin-Leon L, Panigassi G, et al. Acompanhamento e avaliação da segurança alimentar de famílias brasileiras: validação de metodologia e de instrumento de coleta de informação. Relatório técnico. Brasília: Ministério da Saúde; 2004. 21. World Health Organization. WHO child growth standards:
length/height-for-age, weight-for-age, weight-for length, weight-for-height and body mass index-for-age: methods and development. Geneva: WHO; 2006.
23. Paim J, Travassos C, Almeida C, Bahia L, MacInko J. The Brazilian health system: History, advances, and challenges. Lancet. 2011;377:1778-97.
24. Fernandes TF, Diniz AS, Cabral PC, Oliveira RS, Lóla MM, Silva SM, et al. Vitamin A deficiency among preschool children attending public day care centres of Recife: biochemical and dietetic indicators. Rev Nutr. 2005;18:471-80. 25. Brasil. Ministério da Saúde. Política nacional de alimentação
e nutrição. Brasília: Ministério da Saúde; 2012.
26. Bortolini GA, Gubert MB, Santos LM. Food consumption Brazilian children by 6 to 59 months of age. Cad Saúde Pública. 2012;28:1759-71.
27. Pedraza DF, Queiroz D, Paiva AA, Cunha MA, Lima ZN. Food security, growth and vitamin A, hemoglobin and zinc levels of preschool children in the northeast of Brazil. Cienc Saude Coletiva. 2014;19:641-50.
28. Prado MS, Assis AM, Martins MC, Nazaré MP, Rezende IF, Conceição ME. Vitamin A deficiency in children of rural zones, Northeast region of Brazil. Rev Saúde Pública. 1995;29:295-300.
29. Thurnham DI, McCabe GP, Northrop-Clewes CA, Nestel P. Effects of subclinical infection on plasma retinol concentrations and assessment of prevalence of vitamin A deficiency: meta-analysis. Lancet. 2003;362:2052-8.