tg0
ARE START-UPS READY TO ADOPT A
BALANCED SCORECARD?
Elisabete Andreia Pinto Castro
Master Dissertation
Master of Science in Business Administration
Supervisor:
MSc. Ana Margarida Madureira Simaens, ISCTE Business School, Department of Marketing, Operations and Management
tg0
ARE START-UPS READY TO ADOPT A
BALANCED SCORECARD?
Elisabete Andreia Pinto Castro
Master Dissertation
Master of Science in Business Administration
Supervisor:
MSc. Ana Margarida Madureira Simaens, ISCTE Business School, Department of Marketing, Operations and Management
“Start by doing what's necessary; then do what's possible; and
suddenly you are doing the impossible.”
I
Acknowledgement
I would like to start by thanking my family for all their support, especially to my mother, father, brother and grandmother, for all their love and understanding. I have to offer a special word of gratitude and appreciation to my boyfriend who gave me a huge support in all the stages of this project by discussing with me several topics and helping me to make important decisions.
I would also like to thank Professor Ana Simaens who gave me greatest support in all the stages of this dissertation and who was always been available for me. But more than this, I have to thank her for the confidence placed in me and the words of encouragement said all the time because this made me more self-confident. Thank you! One of the most important choices I have made in the last year was the participation in the IBS Trainees Program, the internship in progress at ISCTE Business School. In this program, I had the opportunity to meet amazing people who are now important friends in my life. I want to thank to all these friends – Ana Correia, Ana Filipa Tavares, Solange Moreira, Francisco Peres and Julia Symulenko – for all of their support, words of encouragement, the patience and availability, but more than this, I am very thankful for all the moments we passed together every day, for all the laughs, hugs, confidences and advices. You were all extremely important in giving me the strength to finish this dissertation.
I also want to leave a thanking word to two special members of ISCTE Junior Consulting - Eloísa Ferreira and Maria Inês Marques – and to a member of AIESEC – Ana Passaporte - because without their support I could not have found enough start-ups to interview and to conclude successfully my study. I am really grateful for your support and availability to help in my study. I would also like to thank to AUDAX, Tech Labs and Startup Lisboa and to all the representatives of the start-ups that have participated in this study because without them this study would not have been possible.
Last, but not least, I would also like to thank to my two best friends, who are amazing and the most comprehensive people in the world: Ana Sofia Vicente and Vanessa Batista.
II
Abstract
Balanced Scorecard (the BSC) is recognized as one of the most powerful strategic management tools due to its ability to translate the long-term strategy into short-term goals and in financial and non-financial indicators. Considering the Portuguese business context in which the number of start-ups has increased significantly, this constitute a relevant study universe to relate the BSC with companies in the initial phase of the business life-cycle. For this, it was applied an interview to 9 start-ups to determine the level of willingness to adopt the BSC by considering their organizational characteristics. The main conclusion is that it seems to be a pattern that relates the business life-cycle stage in which a company is, with the willingness to adopt the BSC. Indeed, 8 over the 9 start-ups studied revealed not being willing to adopt the BSC in their companies due to their organizational characteristics that are inherent to the birth stage of the business life-cycle to which they belong and that constitute themselves obstacles to implement this tool. These start-ups attribute several advantages to the BSC by considering it is a very well designed tool but those are lessened by the obstacles found such as the scarcity of resources and the need to constantly change. Furthermore, the strategic management practices seem to be related to the willingness to adopt the BSC because this tool requires a long-term strategy and start-ups are short-term focused. To finalize, the willingness to adopt the BSC is higher from the birth stage to the growth stage as a result of the need to adapt internally to the increasing complexity of the company.
Keywords: Balanced Scorecard, Start-ups, Business Life-cycle, Strategic Management
Practices
JEL Classification System: M130 New Firms; Start-ups
III
Resumo
O Balanced Scorecard (BSC) é reconhecido como uma das mais poderosas ferramentas de gestão estratégica devido à sua habilidade em traduzir a estratégia de longo-prazo em objetivos de curto-prazo e em indicadores financeiros e não-financeiros. Considerando o contexto empresarial português onde o número de start-ups tem aumentado significativamente, é este o universo de estudo encontrado como relevante para relacionar o BSC com empresas que estão na fase inicial do ciclo-de-vida empresarial. Neste sentido, foi aplicada uma entrevista a 9 start-ups para averiguar a sua vontade em adotar o BSC considerando as suas características organizacionais.
A principal conclusão é a de que parece existir um padrão que relaciona a fase do ciclo-de-vida empresarial, na qual a empresa se encontra, com a vontade em adotar o BSC. De facto, 8 das 9 start-ups estudadas revelaram não ter vontade de adotar o BSC devido às suas características organizacionais que são inerentes à fase inicial do ciclo-de-vida empresarial à qual estas pertencem, e que constituem por si só obstáculos à implementação desta ferramenta. Estas start-ups atribuem várias vantagens ao BSC considerando-o uma ferramenta muito bem desenhada, mas que são minimizadas pelos obstáculos encontrados como a escassez de recursos e a necessidade constante de mudança. Além disto, foi verificado que as práticas de gestão estratégica parecem estar relacionadas com a vontade em adotar o BSC porque esta ferramenta requere uma estratégia a longo-prazo e as start-ups são focadas no curto-prazo. Para finalizar, a vontade em adotar o BSC é maior da fase inicial para a fase de crescimento, sendo este o resultado da necessidade da empresa em se adaptar internamente à crescente complexidade da organização.
Palavras-chave: Balanced Scorecard, Start-ups, Ciclo-de-vida Empresarial, Práticas de
IV
Glossary
API – Advanced Performance Institute BSC – Balanced Scorecard
CIMA – Chartered Institute of Management Accounting CSFs – Critical Success Factors
ERP – Enterprise Resource Planning GEM – Global Entrepreneurship Monitor HRM – Human Resources Management
IAPMEI – Instituto de Apoio às Pequenas e Médias Empresas e à Inovação IJC – ISCTE Junior Consulting
INE – Instituto Nacional de Estatística MAS – Management Accounting Systems MCSs – Management Control Systems OTD – On-time Delivery
PMS – Performance Measurement System ROCE – Return on Capital Employed SME – Small and Medium Enterprise
SWOT – Strengths, Weaknesses, Opportunities and Threats TEA – Total Early-Stage Entrepreneurship Activity
V
Index
1. Introduction ... 1
2. Definition of the problem context... 3
3. Literature Review ... 7
3.1. Strategic Management Process ... 7
3.2. Balanced Scorecard as a Strategic Management Tool ... 11
3.2.1. Characteristics and Evolution of the Concept ... 12
3.2.2. A look at the Balanced Scorecard’s perspectives ... 13
3.2.3. The characteristics of Balanced Scorecard’s Measures ... 14
3.2.3.1. Cause and Effect Relationship ... 14
3.2.3.2. Outcomes and Performance Drivers ... 14
3.2.3.3. Number of measures in the BSC ... 15
3.2.4. Strategic map ... 15
3.2.4.1. How does it work? ... 16
3.2.5. Advantages and limitations ... 17
3.3. Strategic Management in Start-ups... 19
3.3.1. Organizational Characteristics across Life-cycle Stages ... 19
3.3.2. Importance of Management Control Systems in Start-ups ... 24
3.3.2.1. Financial planning ... 25
3.3.2.2. Non-financial planning ... 26
3.4. The BSC in Small and Medium Enterprises and Start-ups ... 27
3.4.1. Benefits ... 27
3.4.2. Limitations ... 28
3.5. How to implement a Balanced Scorecard? ... 30
3.5.1. Top-down approach ... 30
3.5.2. Circular Methodology ... 31
3.5.3. Strategy formulation processes and the BSC implementation ... 32
4. Research Questions... 33
5. Methodology and Research Process ... 34
5.1. Research Process: Qualitative Methodology ... 35
5.1.1. Data collection ... 36
5.2. Sample of Start-ups ... 38
5.3. Data Analysis ... 39
6. Findings and Discussion ... 41
6.1. Start-ups characterization ... 41
6.2. Part I – Life-Cycle and Organizational Characteristics ... 43
6.2.1. Organizational structure ... 43 6.2.2. Decision-Making Process ... 44 6.2.3. Leadership ... 45 6.2.4. Challenges ... 46 6.2.4.1. Limited resources ... 46 6.2.5. External Environment ... 47
VI
6.3.1. Strategy definition and formulation ... 48
6.3.1.1. Long-term strategy ... 48
6.3.1.2. Short-term strategies ... 49
6.3.2. Level of Formalization and Planning of Strategy ... 50
6.3.3. Control of performance ... 51
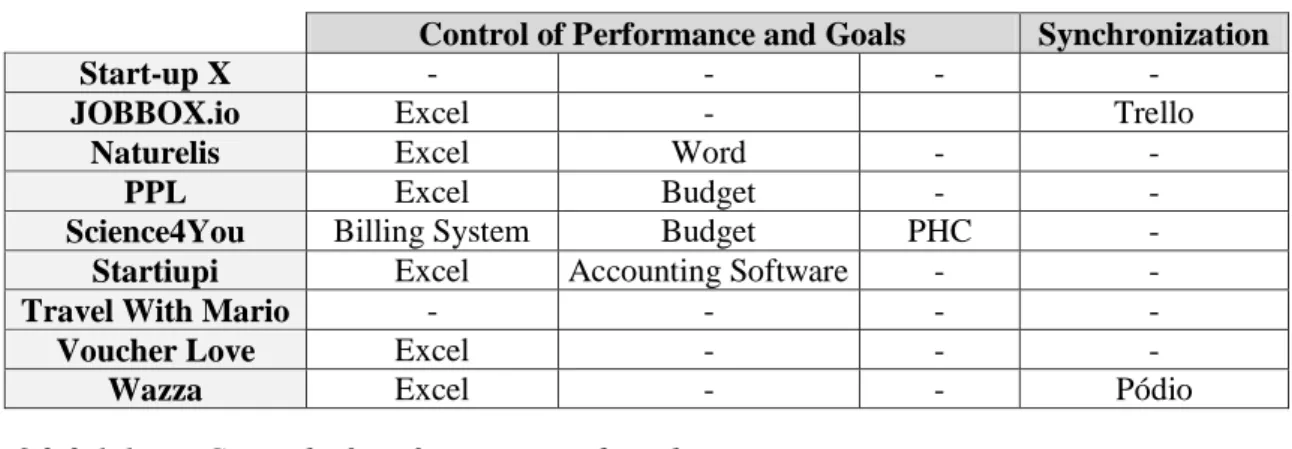
6.3.3.1. Control Mechanisms ... 52
6.3.3.1.1. Control of performance and goals ... 52
6.3.3.1.2. Synchronization of the team ... 53
6.4. Part III - Balanced Scorecard... 54
6.4.1. Knowledge about the BSC ... 54
6.4.1.1. Functionalities of the BSC ... 55
6.4.2. Analysis of the willingness to adopt the BSC ... 55
6.4.2.1. Some willingness to adopt the BSC ... 56
6.4.2.2. Unwilling to adopt the BSC ... 58
6.4.2.3. Willing to adopt the BSC ... 61
6.4.3. Summary of the BSC’s advantages and obstacles attributed by start-ups 62 7. Research Questions analysis ... 66
7.1. When should the Balanced Scorecard be adopted? ... 70
8. Conclusion ... 73
8.1. Limitations ... 75
8.2. Recommendations and Further Research ... 75
9. References... 77
10. Appendixes ... 85
Appendix I – Detailed description of the BSC’s perspectives ... 85
Appendix II – The cause-effect relationships of the BSC ... 89
Appendix III – Results from a study of BSC adoption in the Portuguese Context .. 91
Appendix IV - The BSC implementation processes ... 93
Appendix V – Interview guide ... 95
Appendix VI – Programs used for data analysis ... 98
Appendix VII – Initial coding system – definition process ... 99
Appendix VIII – Final coding system – definition process ... 102
Appendix IX – Output used for data analysis ... 110
Appendix X - Data about Science4you ... 113
VII
Tables Index
Table 1 – Synthesis of Strategy Formulation Models: matching of concepts of different
authors ... 8
Table 2 – Summary of the BSC’s four perspectives ... 13
Table 3 - Criteria to assign companies to the respective stage in the business life-cycle ... 19
Table 4 - Change in Organizational Characteristics across the five stages of the life-cycle model ... 20
Table 5 - Four action strategies in start-ups and respective characteristics and level of planning ... 22
Table 6 – Strategies adopted in Start-ups and respective external and internal characteristics across Life-Cycle Stages... 22
Table 7 - Synthesis of Strategy Formulation Models in general and for start-ups: matching of concepts of different authors ... 23
Table 8 - Matching between the characteristics of strategy formulation processes and the methodologies developed for the BSC’s implementation ... 32
Table 9 – Characteristics of Start-ups ... 42
Table 10 - Summary of the control mechanisms used by the 9 start-ups ... 52
Table 11 - Knowledge about the BSC per Start-up ... 54
Table 12 - Match between the knowledge level about the BSC and the willingness to adopt it ... 56
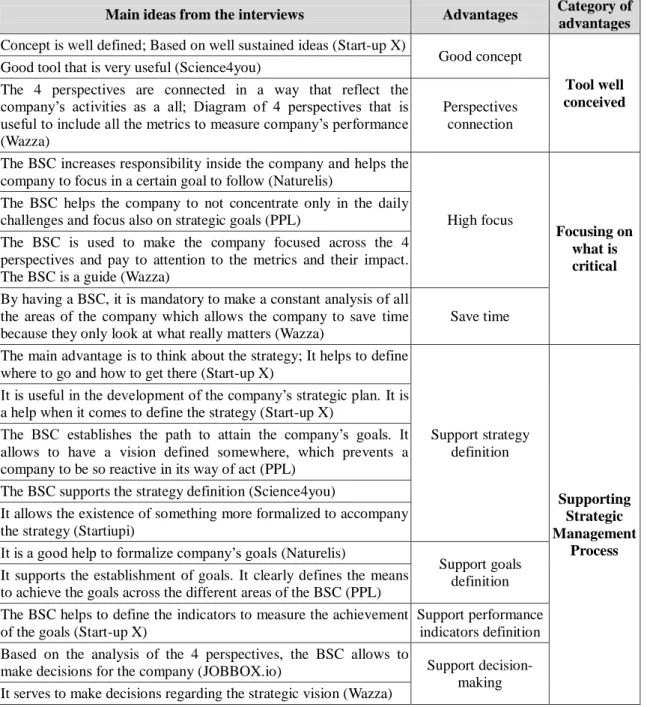
Table 13 - From the interview to the main advantages of the BSC ... 62
Table 14 - From the interview to the main characteristics of the BSC and the obstacles to implement it ... 64
Table 15 - Match between the advantages and obstacles attributed to the BSC by SMEs and Start-ups ... 65
Table 16 – Relationship between start-up’s characteristics, the potential the BSC’s advantages and the potential obstacles to adopt it ... 67
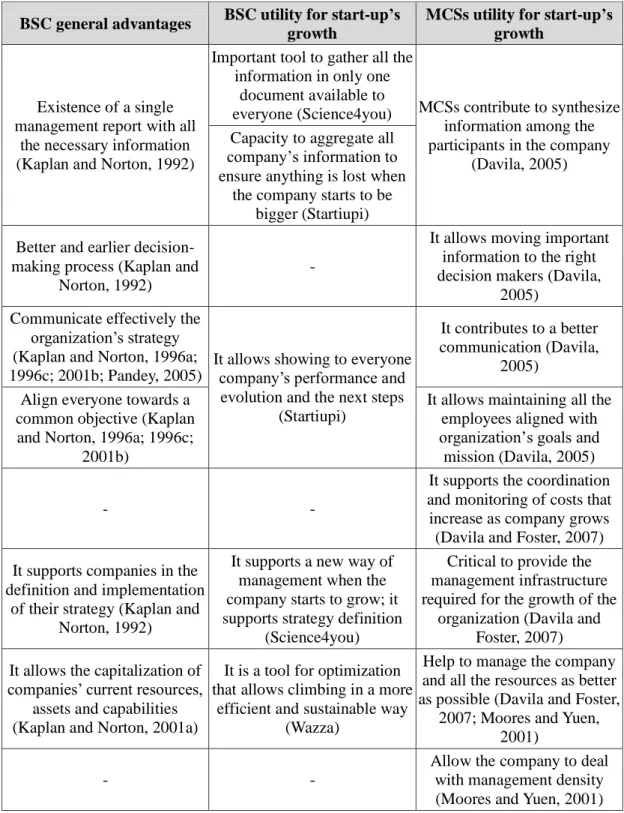
Table 17 - Match between the general advantages of the BSC, its utility for start-ups’ growth (based on the interview) and MCSs utility for start-up’s growth (based on the literature review)... 71
Table 18 – Benefits arising from the BSC’s implementation recognized by large Portuguese companies ... 91
Table 19 - Reasons given by large Portuguese companies to implement the BSC according to a scale of importance in which the 1 is “totally unimportant” and 5 is “extremely important” ... 92
VIII
Table 20 – Reasons given by large Portuguese companies to not adopt or to abandon
the BSC ... 92
Table 21 - the BSC implementation process – top-down approach... 93 Table 22 - the BSC implementation process – circular methodology ... 94 Table 23 – Example of the process used to define the codes for analysis based on the
literature review ... 99
Table 24 - Initial coding system (based on the literature review)... 100 Table 25 - Example of the process followed to define the codes emergent from the
interview's analysis ... 102
Table 26 – Final coding system (include both codes from the literature review and from
the interviews) ... 106
Table 27 – Example of one output of MaxQda program (1st order code “External Environment” and 2nd
IX
Schemes Index
Scheme 1 - Circular methodology to design and implement a PMS (including the BSC)
in a SME ... 31
Scheme 2 – Framework of Analysis ... 37
Scheme 3 - The BSC’s four perspectives and respective measures, targets, initiatives and objectives relationship ... 88
Scheme 4 - An example of cause-effect relationships inside a company ... 89
Scheme 5 – The Balanced Scorecard Strategy Map ... 90
Images Index
Image 1 – Example of the “F4” Program used to transcribe the interviews recorded ... 98Image 2 - Example of the “MaxQda” Program used to codify and analyze the interviews applied ... 98
Image 3 - Example of the initial coding system introduced in the “MaxQda” Program ... 101
Image 4 - Example of the final coding system used in the “MaxQda” Program ... 108
Image 5 – Evolution of Science4you’s growth (in Millions of Euros) ... 113
1
1. Introduction
The business world has been growing and is currently extremely competitive which influences the position that companies should take. Companies have to make several efforts to define the strategy that allows them to achieve the success (Santos, 2006; Brews and Purohit, 2007). There are constantly different and new challenges to face and companies have to adapt themselves by using new management methods to cope with the increasing competitiveness and give even more attention to their business strategies (Kaplan and Norton, 1992).
Considering the current business environment and the growing necessity of companies in having a performance appraisal system of their business, the traditional measures systems are no more enough to deal with business challenges. It was in this context that the Balanced Scorecard (BSC) was created to support companies in the definition and implementation of their strategy by linking the long-term strategy with medium and short-term goals and respective indicators (Kaplan and Norton, 1992). The BSC’s greatest strength comes from its innate ability to integrate financial and non-financial indicators by measuring both strategic and business performance across four interrelated perspectives. The concept has evolved throughout time and it has suffered several improvements meaning that nowadays it is more than a simple performance measurement tool and it became a strategic management tool (Kaplan and Norton, 1996b). It is a fact that, according to studies of Bain & Company (2013), the BSC was considered, in 2013, the fifth most popular management tool used in companies.
The BSC was designed with large companies in mind. But the business world is not only composed by large companies and several studies were also developed to evaluate the implementation of the BSC in small companies. It is verified that the BSC is generally used by large companies rather than small ones, even if there are evidences that it could be beneficial for small businesses. In this sense, besides looking at large and small companies it became relevant to look in specific to start-ups due to the current business context and author’s personal and professional motivations as member of entities related with entrepreneurial initiatives. Start-ups are companies that are in the initial stage of the business life-cycle and exist to create new products and services (Moores and Yuen, 2001; Ries, 2011). These firms constitute an interesting scope for this study because the number of entrepreneurs and start-ups has increased significantly during the last years. Considering that the BSC could be a beneficial tool for small
2 businesses how is the scenario for companies that started recently their activity? As a starting point, both dimensions are related: the BSC supports companies to become better succeeded and start-ups have to be well succeeded to survive and grow.
In line with this, it became relevant to understand whether start-ups were aware of the BSC as a strategic management tool and in which extent they were willing to adopt it and in which circumstances. The relevance of this theme was sustained by the analysis of the extent to which the level of willingness to adopt the BSC relates with the stage of the business life-cycle in which a company is. To understand this, a qualitative methodology was used through a multiple-case study approach. To collect all the data from those case studies, an in-depth, an interview was applied to 9 start-ups in order to explore all the information needed about their characteristics and opinions about BSC. For this purpose, the present report is divided in three main sections. The first is the literature review where the generic concepts of strategic management and the BSC are approached to familiarize the reader with such concept. Also in the literature review it is observed the strategic management process in start-ups, the usage of tools similar to the BSC in start-ups and, due to the lack of information, at our best knowledge, relating the BSC and start-ups, it is analyzed the usage of the BSC by small companies since they share similar characteristics with start-ups. The second part describes the methodology and the framework of analysis followed to answer the research questions of the study. Finally, the third part presents the conclusions of the study regarding the willingness of start-ups to adopt a tool as the BSC by summarizing start-ups’ organizational characteristics and the main advantages and obstacles attributed to this tool.
3
2. Definition of the problem context
To explain the relevance of the theme of this dissertation, it is crucial to present the international and Portuguese context regarding the usage of the BSC and its importance and the characteristics and trends of the Portuguese enterprise sector.
The Portuguese enterprise context is characterized by the predominance of Small and Medium Enterprises (SMEs) as the last study of IAPMEI (Instituto de Apoio às
Pequenas e Médias Empresas e à Inovação) reveals: 99,6% of national enterprises are
SMEs (Machado, 2013; IAPMEI, 2008).
Moreover, in the Portuguese context, it is possible to see that the number of entrepreneurs has been increasing as well as the number of start-ups. According to the report of GEM Portugal (Global Entrepreneurship Monitor) about a study on
entrepreneurship, in 2010 the TEA1 rate (Total Early-Stage Entrepreneurship Activity) was 4, 5% meaning that existed in Portugal 4 to 5 early-stage entrepreneurs per 100 individuals in adult age. The fact is that the last study of GEM (2012) revealed that since 2010 until 2012 the TEA rate increased 71% since the TEA in this year was 7,7% (there are 7 to 8 early-stage entrepreneurs per 100 individuals in adult age) in comparison with the 4,5% of 2010. According with the GEM’s report (2012), despite the difficult economic, financial and social situation of Portugal, the entrepreneurial initiative has increased.
This data allows looking at statistics about the evolution of the number of start-ups in Portugal. According to the data of Informa D&B, every year around 30481 new companies are formed and 74% of them effectively begin their activity meaning they are able to be successful. Thus, they concluded that between 2006 and 2011 it was founded, on average, 22 thousand start-ups2 in Portugal every year. Even more and according with the studies of INE (Instituto Nacional de Estatística) called Empresas
em Portugal, in 2011, 12, 3% of the total of companies in Portugal represented new
companies, but in 2012 this number has diminished 4, 4% in comparison to the previous year as a result of a decrease in economic activity between 2008 and 2012.
1
TEA rate shows the proportion of individuals in adult age (between 18 and 64 years) involved in start-ups (fledgling business) or in the management of new and growing businesses
2
For Informa D&B, start-ups are companies in the first year of its life; For Informa D&B, companies that are 5 or less years old are designated as young companies
4 Despite this, more recent data of Informa D&B revealed that 35296 new companies were created in 2013 which represent an increase of 12,8% relative to 2012 and an involvement of more 10,2% entrepreneurs than in that year. Furthermore, the last data of May of 2014 divulged by Informa D&B showed that over the same period of last year (May of 2013), the number of creation of new businesses has increased 0, 2%. This difference was even greater in February of 2014 when this growth corresponded to 3%. These statistics are presented on a monthly basis meaning it varies a lot between months, but the trend is the increase of the number of new companies (start-ups) in Portugal.
In order to support this growth of the number of start-ups and according with the first survey applied to start-ups in Lisbon in 2013, there are also an increasing number of incubators which are places of co-working and incubation of start-ups and this allows reducing the costs for entrepreneurs in the launch of their business. In Lisbon, the incubators network is composed by 11 incubators that host around 200 start-ups and 800 workplaces. This bet in supporting start-ups reveals the importance they have in the economy of Portugal once they represent 6, 5% of the Portuguese enterprise sector and 18% of new jobs as Informa D&B reveals.
To add more information to this analysis and in order to justify the relevance of the study, it is now important to focus on the importance that the BSC has in companies. According to Bain & Company Guide (2013), it is recognized that the BSC is considered a useful tool for articulating the business's vision and strategy, establishing objectives to support it, developing effective measures and ensuring its acceptance, creating proper budgeting, communication, and reward systems and collecting and analyzing performance data in order to compare results with desired performance. Taking this into account, some statistic data collected from BSC Designer’s website, the use of the BSC brings several advantages since 80% of organizations using the BSC had improvements in operating performance and 66% of those organizations reported an increase in profits. According to the BSC Usage Survey developed by 2GC regarding 2013, the BSC was considered extremely or very valuable by 75% of the companies interviewed. The study also concluded that the most significant impacts of the BSC implementation were found in business actions (86%), behaviours (64%) and appraisal (46%).
5 This analysis leads to another topic. Since the creation of the BSC, its potential has been recognized in several forms and it received distinctions as the best theoretical framework in 1997 by the American Accounting Association (Norreklit, 2003). Moreover, the Harvard Business Review considered the BSC as one of the most influential ideas of the twentieth century (Bible, Kerr and Zanini, 2006). These distinctions given to the BSC had impact on the increase of its usage. Indeed, according to Bain & Company by 2002 the BSC was already used by half of the Global 1000 companies (Calabro, 2001 apud Crabtree and DeBusk, 2008).
Moreover, according with the studies of the Advanced Performance Institute (API) about the number of companies using the BSC, it is used by about half of major companies in the USA (United States of America), Europe and Asia. Other studies approached by API reveals that over 50% of large USA firms had adopted the BSC by the end of 2000; in Germany, Switzerland, and Austria, 26% of firms use the BSC. They concluded that the broadest use of the BSC is found in USA, United Kingdom, Northern Europe and Japan.
Giannopoulos et al. (2013) revealed a study applied in 2009 by the CIMA (Chartered Institute of Management Accounting) to 439 respondents about the usage of more than 100 management accounting and related tools. According with it, the BSC is one of the most popular management tools and the most likely to be adopted by companies, namely the large ones. Indeed, the BSC is generally used by large companies rather than small since only 25% of the small entities use the BSC.
More recently, a survey of management tools and techniques conducted by Bain & Company (Rigby and Bilodeau, 2013) about the popularity and use of the BSC found that it was the fifth most popular management tool used in companies. They also concluded that the level of usage of the BSC was approximately 40% in 2013 and it decreased in comparison with 2011 (Rigby and Bilodeau, 2011) when the level of usage of the BSC was 50%. However, note that the overall usage of management tools decreased. Moreover, according to the same survey in 2013, the overall satisfaction was almost 4 out of 5 which corresponded to the highest satisfaction level (Rigby and Bilodeau, 2013). Despite this decrease, the BSC continuous to be one of the most popular and used management tools which evidence its importance for companies strategy.
6 Regarding Portugal, Quesado and Rodrigues (2009) have explored the role of the BSC in large Portuguese companies and the conclusions were that the level of the BSC implementation in Portugal is extremely low. Moreover, also Machado (2013) studied the applicability of the tool in Portuguese industrial SMEs classified as excellence industry3 and he concluded that the use of performance evaluation tools such as the BSC are very low. To corroborate the information stated above and taking into account the study of Quidgest (2009), it is confirmed that the BSC is more used by large companies than by small ones. 22% of Portuguese SMEs use the tool and 50% of the Portuguese large companies use the BSC. Only 35% of the overall respondents use or are implementing the BSC and they recognize the positive impacts this tool has in terms of strategic alignment, internal communication and control of strategy.
The motivation for this study lies on the fact that if the number of start-ups and the TEA rate in Portugal has increased and the BSC is one of the most useful and used strategic management tool, thus it became relevant to study the role of the BSC in the context of start-ups. Additionally, the studies that have already been developed were mainly focused on SMEs and in large companies, not in start-ups which can constitute an important contribution towards this study. The next section presents the literature review developed about the generic concepts of strategic management and the BSC, as well as, the strategic management process in start-ups, the usage of similar tools to the BSC in start-ups and the usage of the BSC by small companies since they are similar to start-ups.
3
Excellence Industry – “They represent a group of companies that were selected using goals aligned with those of this paper; mentioned classification assesses the economic, financial, and management performances of applicant enterprises (IAPMEI, 2002)”, mentioned by Machado (2013)
7
3. Literature Review
3.1. Strategic Management Process
Companies face very competitive and unstable environments (Santos, 2006; Brews and Purohit, 2007) and many of them are worried about defining the path to achieve the goals and mission and to surpass the predicted difficulties (Santos, 2006).
In this sense, companies want to design the image of success. They want to achieve in the future through the definition of the organizational vision and for this they develop the strategy that determines the procedures to follow in order to attain the desired mission and vision (Santos, 2006). But what is strategy? The strategy of a company is defined on the set of rules and guidelines to make decisions that guide the development process of an organization into the future. It is consistent over time (Mintzberg, 1978; 2000) and it establishes the purpose of the company in terms of goals, action plans and resources allocation (Hax and Majluf, 1988). The strategy has the role to respond to external environment’s opportunities and threats by matching organization’s skills and resources with the environment’s demands, in order to achieve organization’s goals (Chrisman, Hofer and Boulton, 1988; Steiner and Miner, 1977 apud Hax and Majluf, 1988).
The development of a strategy depends on a process of strategic management that, according with Miller and Dess (1996), has the role of organizing the different areas of the company and to integrate all the efforts around the strategy defined to ensure its accomplishment. Nag et al. (2007) defined strategic management as the initiatives taken by managers that involves the maximization of the resources used and the focus on improving the performance taking always into account the external environment in which the companies are inserted on. According to Jasper and Crossan (2012), strategic management intends to involve the workforce to attain the strategic goals through an adequate leadership style, to facilitate the match of the firm to the external environment, to anticipate the future by forecasting what can happen, to define the processes that contributes to organizational development and achievement of the company’s strategic objectives and, finally, to facilitate the decision-making process, as well as, the communication throughout the organization.
The strategic management process is approached by several authors and there are four basic steps in this process: the strategic analysis, the strategy formulation, the strategy
8 implementation and the strategic control (Miller and Dess, 1996; Johnson et al, 2008 apud Jasper and Crossan, 2012; Pearce and Robinson, 2000; BSC Institute’s website). The strategic analysis concerns with company’s understanding of the strategic position by making an internal and external analysis of the organization to evaluate the business environment and the firm itself (Johnson et al, 2008 apud Jasper and Crossan, 2012). This analysis is called the SWOT analysis (Strengths, Weaknesses, Opportunities and Threats) that supports the establishment of strategic objectives (Miller and Dess, 1996). Thus, this is all about the analyzing the strength of business's position and understanding the relevant external factors that may influence that position.
The strategy formulation follows the strategic analysis and is the basis on the implement the designed strategy. This process is not equal for all the organizations and it depends on company’s characteristics and the environment’s conditions in which the company is inserted in (Hax and Majluf, 1988; Nicolau, 2001). Thus, there are three main strategy formulation processes similar across the methodologies approached by different authors but with different designations (Table 1).
Table 1 – Synthesis of Strategy Formulation Models: matching of concepts of different authors
Mintzberg (1978) Nicolau (2001) Hart (1992) Chaffee (1985)
Adaptive Mode Permanently
Construction Process Transactive Mode Adaptive Model Planning Mode Rational and Formal
Process Rational Mode Linear Model
- Negotiated Process Symbolic Mode Interpretive Model
Entrepreneurial Mode - - -
T he ones in which this study centres its attention was: a rational and formal process, a permanently construction process and a negotiated process (Nicolau, 2001).
The process to formulate a strategy is seen as rational and formal when the strategy emerges through sequential, rational and analytical steps that origin a strategic plan deployed in an analytical way (Christensen et al., 1978), which is more likely to happen when the company is inserted in a stable or at least predictable environment (Mintzberg, 1978). Chaffee (1985) corroborates this with the linear model in which the strategy is constructed based on a systematic and direct process in which the top managers follow a decision-making rational process that results on integrated decisions, actions and plans that supports the strategy in order to achieve the organizational goals. It is also recognized in the literature that planning is important to achieve long-term goals
9 through short-term goals (Katz, 1970 apud Nicolau, 2001) and the firm is able to better coordinate and integrate the activities and to align all the organization for the goals achievement (Hart, 1992; Mintzberg, 2000). Even more, the rational process is associated to the elaboration of a strategic plan since this is an output from a rational decision-making process (Murray, 1978). By having a strategic plan, a company is able to anticipate future actions (Christensen et al., 1978) and to standardize the strategy across the entire organization giving insights about what, when and how they have to act and who will act according to the situation (Steiner et al., 1989). These plans are designed to guarantee the achievement of objectives through the correct allocation of resources to seize opportunities (Murray, 1978).
On the other hand, the strategy can be formulated through a permanently construction process. There are circumstances in which the unstable, unpredictable and complex environment prevents a company to develop clear, ordered and controlled processes to formalize a strategy in a document (Chaffe, 1985; Nicolau, 2001). According to Chaffee (1985), companies inserted in this type of contexts are less able to predict the future events and eventual actions to take which makes them responsive to the environmental events. The strategy is formulated through the linkage between the company’s internal capabilities and the adaptation to the external environment, thus the company must change with the environment instead of just dealing with it. As Steiner et al. (1989) explains larger companies are more used to use formal strategic planning systems than small firms. Smaller companies instead of formalizing their strategic planning, they do an intuitive-anticipatory planning that results on short-time reactions and decisions. These companies formulate their strategy based on the convergence of the day-to-day activities and the impact they have for company’s performance because this match translates the strategy the company is following.
Finally, the negotiated process considers that the strategy formulation depends on the negotiation between the groups that constitute the company (Nicolau, 2001) meaning that the strategy is defined step-by-step based on discussion of ideas (Chaffee, 1985). If on one hand, the rational process presented is focused on a strict analysis of internal capacities and external factors, only after, do they think about values systems, the negotiation process is much less rational because the internal and external systems of values are the basis for the formulation of the strategy (Hofer and Schendel, 1979 apud Nicolau, 2001). By following a negotiation process, organizations are focused on
10 sharing values by negotiating together which increases involvement of the organizational members (Hart, 1992). Chaffee (1985) also recognized that in this type of process, companies deal with the environment through an effective internal communication that takes into account the culture and relationships inside the company. It is a fact that companies are not only affected by internal agents but also by external social and political forces. Those forces are also considered in the strategy formulation meaning that the strategy or plans of strategic significance are negotiated with those external parties (Murray, 1978).
The strategy implementation comes after the strategy being formulated and it consists on moving efforts inside the organization to transform the intended strategies into realized ones through integration, organizational structure, control and leadership (Miller and Dess, 1996). Moreover, Pearce and Robinson (2000) refer that after the definition of long-term objectives and the respective strategy, this strategy has to be implemented through short-term objectives, functional actions and employees’ empowerment and rewards. For them, short-term goals are the ones that translate long-term aspirations, which make possible defining the actions to implement the strategy thought. According to Pearce and Robinson (2000), implementing a strategy depends on translating it into daily activities, empowering desired behaviours and applying reward systems that align actions and results with organizational objectives.
The strategic control exists to assess the performance of the company in the pursuit of the strategy implemented by detecting possible problems or changes and acting according to it by making necessary adjustments (Pearce and Robinson, 2000). For these authors, strategic control relates to the analysis of company’s direction – if they are moving in the right direction – and company’s performance – if they are performing well or if they need adjustments. Strategic control is relevant to guide the company in order to adjust its strategic actions and directions according to the changes and challenges of internal and external environment (Pearce and Robinson, 2000).
In order to support and contribute for all the process of strategic management, Kaplan and Norton (1992) developed a tool named Balanced Scorecard that helps on the rationale that lies behind the strategy formulation/discussion and implementation (Kaplan and Norton, 1992; 1996a; 1996b; 1996c).
11
3.2. Balanced Scorecard as a Strategic Management Tool
Senior executives have assumed that organization’s measurement system affects the company overall strategy and activity. Since it is not enough to look only at static numbers of past performance, the executives also understood that traditional financial accounting measures are insufficient for continuous improvement and innovation which are the key to success (Kaplan and Norton, 1992). In general, financial measures encourage managers to focus only on maximizing the short-term results making them forget about the long-term company’s performance in terms of sustainability. An investment today and a loss in the short-term return could be a huge step for company’s future success (Pandey, 2005; Kaplan and Norton, 1996c; 2006). Thus, non-financial measures appeared as key factors for future companies’ success since they lead the company to achieve the best results in financial terms. And as Kaplan and Norton (2001a) revealed, the intangible assets are a vital source for companies’ competitive advantage which proves the importance of considering non-financial measures (intangible assets) in companies’ strategy.
It was in this context that Kaplan and Norton in 1992 noticed the importance of having a measurement system that was able to include both financial and non-financial measures. They created the BSC which is a tool that allows managers to have a more comprehensive view of the business since it includes a set of measures: financial measures focused on showing the results of actions already taken and operational or non-financial measures that lead to future financial performance (Kaplan and Norton, 1992). The concept had evolved and Kaplan (2010:18) defined again the BSC as “(…) a
robust measurement and management system that included both operational metrics as leading indicators and financial metrics as lagging outcomes, along with several other metrics to measure a company’s progress in driving future performance”.
In fact, the traditional performance measurement systems (PMSs) exist as a tool to control employees’ actions by measuring whether they are achieving the goals (Kaplan and Norton, 1992). But the BSC is different because it is based on the vision and the strategy of the company and not the control function (Kaplan and Norton, 2001b). The assumption behind the BSC is that employees will do everything they can to achieve those goals because the measures are designed to pull people toward the overall vision increasing the commitment (Kaplan and Norton, 1992). In addition, traditional tools reflect the past of what the company did, but they do not give insights to take decisions in terms of improving future performance as the BSC does (Kaplan and Norton, 1993).
12
3.2.1. Characteristics and Evolution of the Concept
Initially, the BSC was presented as a performance evaluation system (diagnostic and control system) incorporating financial and non-financial measures and defining the goals to achieve and the respective execution measures (Machado, 2013; Pandey, 2005). But the concept has evolved to a strategic management system and managers started to integrate it into their planning and budgeting processes (Kaplan and Norton, 1996c). In fact, Kaplan and Norton (1996b) defined the BSC as a strategic management system to transform the strategy into actions. Pandey (2005) verified that companies started to use the BSC as a tool to understand, communicate, and implement the strategy at all levels of the organization. Thus, the BSC allows a company linking long-term strategic objectives with short-term actions through a combination of separated four new management processes (Kaplan and Norton, 1996b; Pandey, 2005): translating the
vision (create a consensus around the organization's vision and strategy translating this
into actionable goals and initiatives), communicating and linking (communicate the strategy throughout the organization), business planning (integration of financial and business plans), feedback and learning (review processes and performance, give feedback to top management about the strategy status and adapt it).
Kaplan and Norton (2001a) concluded that the BSC is one of the biggest reasons why companies could quickly achieve the success of their strategy and deliver results because it focuses on the overall strategy and its linkages. Pandey (2005) corroborates this since he found several reasons that encourage firms to use the BSC: it gives a better understanding of the target customers; it contributes to create intangible and intellectual capital inside the company; it articulates very well the strategy of growth with business excellence through a bet on non-financial initiatives; employees understand better how their day-to-day operations are linked with the strategy and its goals; and the companies are always able to review the performance and receive feedback continuously.
With all these characteristics of the BSC, Kaplan and Norton (2001a) concluded that it allows the capitalization of companies’ current resources, assets and capabilities preventing them to become obsolete. It is worth noting that these results are achievable with the support of the BSC, but the BSC is not a strategy, it is a tool supporting the management to follow the strategy formulated. A company has to continue formulating its strategy and strategic objectives and to achieve these goals and business success a
13 company needs a strategic planning process that is independent of the BSC. In fact, the BSC is neither a strategy nor a strategic planning process since it is a constituent of the strategic planning process (Pandey, 2005).
3.2.2. A look at the Balanced Scorecard’s perspectives
The BSC includes four perspectives (Table 2) that provide a forceful structure helping companies to define effectively the strategic objectives contributing to a clear and simple view of the business (Kaplan, 2010). They are exposed in detail in Appendix I.
Table 2 – Summary of the BSC’s four perspectives Innovation
and Learning Perspective
“Can we continue to improve and create value?”
It includes indicators to measure the innovation, creativity, competence and capability of the company through ensuring employees’ satisfaction, retention and productivity. The knowledge and capacity to learn fast are aspects taken into account as indicators of growth.
Internal Business Perspective
“What must we excel at?”
This perspective is about what should be done internally to meet customers’ needs which require alignment of processes and employees’ actions. Quality, productivity, employees’ skills, costs reduction, etc. are keywords in this perspective.
Customer Perspective
“How do customers see us?”
This perspective aims to ensure the services provided add value to customers and surpass their needs. To evaluate if this is happening, indicators as satisfaction levels, acquisition of new customers and retention of targeted customers are relevant.
Financial Perspective
“How do we look to shareholders?”
This perspective is a result of the other ones. It measures company’s good performance and success and aims a sustained shareholder value creation. Revenue growth, productivity, risk management, profitability and shareholder value are keywords of this perspective.
Source: Adapted from Kaplan and Norton (1992)
In order to use the BSC, a company has to translate the strategy and vision into objectives to be achieved under each one of the four perspectives (Kaplan and Norton, 1996c). The company is able to know if they are achieving these goals through the defined indicators (specific measures) for each perspective which measures the progress of the company on achieving that objective. It is also crucial to define the targets (values for the indicators) that a company has to reach if they want to attain that goal. Finally, all this is only possible if the company describes the actions needed to be performed for the entire company to achieve the targets and respective goals (Pandey, 2005; Kaplan
14 and Norton, 2006). Concluding, each one of the four perspectives must have objectives, measures, targets and initiatives as the Scheme 3 of the Appendix I demonstrates.
3.2.3. The characteristics of Balanced Scorecard’s Measures
3.2.3.1. Cause and Effect Relationship
According to Kaplan and Norton (1996a), a well-constructed BSC has to include goals and measures consistent and linked between them and that are mutually reinforced. All the measures included in the BSC have to be related in cause-effect relationships because this allows describing firm’s strategy once each measure is connected with the others of each perspective creating an integrative framework where it is possible to see the entire company’s strategy interconnected. For instance, if a firm trains employees to increase their knowledge about the range of products, then they will sell more effectively which increases the average margin of sales (Kaplan and Norton, 1996a). To understand the importance of these relationships it is possible to observe the Scheme 4 (Appendix II) and respective explanation which corresponds to an example of Kaplan and Norton (1996a) that exemplifies how the BSC works and how it could translate the link of the business unit's strategy. Concluding, all the measures to be used in a BSC must be defined based on the goals established by firm’s mission and strategy and they must be related in a cause-effect relationship meaning that if a measure changes, other changes can occur in other measure elsewhere. Furthermore, these relationships help identifying the critical drivers that will improve the performance in important outcome measures (mainly in the financial and customer measures) (Kaplan and Norton, 1996c).
3.2.3.2. Outcomes and Performance Drivers
Kaplan and Norton (1996a; 1996c) had emphasized the importance of having in the BSC outcome measures (generic measures) and performance drivers of those outcomes. The outcome or generic measures are the ones common to all the businesses such as
“(…) profitability, market share, customer satisfaction, customer retention, and employee skills.” (Kaplan and Norton, 1996a:66). The performance drivers are the
indicators that determine how the company’s goals can be achieved. For Kaplan and Norton (1996c:31), these drivers identify the operational factors such as “(…) strategic
investments, market research, innovative products and services, reskilled employees and enhanced information systems (…)”.
15 The BSC has to include the performance drivers because to achieve the goals of financial and customer perspectives, it is necessary to have key performance drivers for the internal processes and learning and growth perspectives. Thus, an effective BSC should incorporate both core outcome measures and performance drivers because the last ones define how the outcomes are to be achieved (Kaplan and Norton, 1996a). To finalize, the general measures or outcomes are the financial measures also named as “after-the-events” or lagging indicators of performance because they show managers what happened, how they did in the past. The lagging indicators are the result of the leading indicators (non-financial goals) that allow managers to know how the firm could succeed in the future. With this, a company is able to see what they did in the past, how they are currently performing and how they will do in the future. The BSC allows seeing this through the lagging, current and leading indicators (Pandey, 2005).
3.2.3.3. Number of measures in the BSC
The measures established for the perspectives are limited to 12 in total which induces managers to focus more on what is really important and critical by minimizing information overload (Kaplan and Norton, 1996a). However, in a company there are measures for different purposes and companies have a lot of measures to monitor and guarantee that everything in the company is functioning as expected and correct it if it is not (Kaplan and Norton, 1996a). However, the role of the BSC is to have a limited number of critical indicators in the four perspectives which is crucial for managers to focus on the strategic vision (Kaplan and Norton, 1993). The BSC is not an organization's day-to-day measurement system that makes daily monitoring, it drives action plans to lead the company to the success (Kaplan and Norton, 1996a) and it monitors if the strategy is being implemented as established (Kaplan and Norton, 1996c).
3.2.4. Strategic map
It is recognized the relevance of having cause-effect relationships between the BSC’s measures in order to ensure an overall alignment of the company’s strategic components (Kaplan and Norton, 1996a) but empirical studies had shown that this process was one of the most difficult aspects to implement (Machado, 2013). Taking into account the importance given to cause-effect relationships, Kaplan and Norton (2001a) proposed the development of a general framework for the BSC implementation named strategic map.
16 A strategic map is a framework that follows a rational and comprehensive approach for describing strategy and the linkages between the critical elements of a company’s strategy (Scheme 5 - Appendix II). This map was developed with the purpose of helping to describe and implement a strategy through the BSC to make it understandable for all the employees and organization units, by creating a common point of reference (Kaplan and Norton, 2001a). With this framework, managers can communicate easily the cause-effect relationships and provide unit’s value proposition and then the BSC is even more capable to monitor the unit’s strategy (Kaplan and Norton, 2006).
3.2.4.1. How does it work?
The BSC includes financial and non-financial measures that have to be linked since improvements in intangible assets affect financial outcomes. Though, the difficult part for managers is to place financial value on intangible assets as motivation levels and create a cause-effect relationship between those measures (Kaplan and Norton, 2001a). In terms of measuring intangible assets, Kaplan and Norton (2001a) verified that an intangible asset’s value depends on the context in which it is positioned since most part of the times the intangible asset has to be bundled with other tangible and intangible assets to create value. Likewise, they justify the importance of creating cause-effect relationships because no individual asset has value on its own meaning that the value has to be created by linking the entire set of assets in a strategic way. It was because of all of these difficulties of implementing a BSC through the deployment of measures in cause-effect logic, that the strategic map was made (Kaplan and Norton, 2001a).
A strategic map should be built from top to down starting with the overall goals and other components of company’s strategy (such as the mission, vision, core values) and then designing the way to reach what the company wants to become (Kaplan and Norton, 2001a) as the Scheme 5 of the Appendix II and respective explanation illustrates. Kaplan and Norton (2001a) explain how the four perspectives are interconnected showing how the companies must look at each one of them and how they are linked in a cause-effect relationship. Note that this framework of the strategic map (Scheme 5 - Appendix II) is very similar to the Scheme 4 of the Appendix II in which a practical example is exhibited.
17
3.2.5. Advantages and limitations
Kaplan and Norton (1992) identified numerous advantages coming from the use of the BSC by several companies proving that the BSC meets several managerial needs: it creates a single management report which allows a better and earlier decision-making process. It also supports to adapt the path of the company almost in real time; and it allows a company “(…) becoming customer oriented, shortening response time,
improving quality, emphasizing teamwork, reducing new product launch times, and managing for the long term” (Kaplan and Norton, 1992:73).
Due to the BSC’s cause-effect relationships, no area can stay outside the managers’ analysis because all the important operational measures have to be considered together and a change in a component leads to a change in the other ones which is beneficial to guarantee consistency of vision and actions contributing to adapt the strategy and its activities in almost real time (Kaplan and Norton, 1992; Pandey, 2005).
Furthermore, Kaplan and Norton (1993) defined four reasons of why the BSC is so special: the BSC is a top-down reflection about company’s mission and strategy; it looks at the current situation but also at the future success, so it is “forward-looking” which helps managers to look at the past and adapt the actions for the future; it allows the integration of external and internal measures; and finally, the BSC helps companies to focus on what is critical for the success of the company’s strategy.
After several researches and real examples of companies which had already implemented the BSC, Kaplan and Norton (1996a; 1996c; 2001b) concluded this tool is very useful to make an articulation between the strategy and the business since it contributes to communicate effectively the strategy and to align individual, organizational and cross-departmental initiatives in order to reach a common goal. The BSC also has the ability to incentive frequent reviews to company’s performance, to learn and improve the strategy (Kaplan and Norton, 1996b). The study of Crabtree and DeBusk (2008) concluded that companies adopting the BSC have superior performance and earn greater returns than those that do not adopt it meaning that this is an effective strategic management tool that leads to improved shareholder returns.
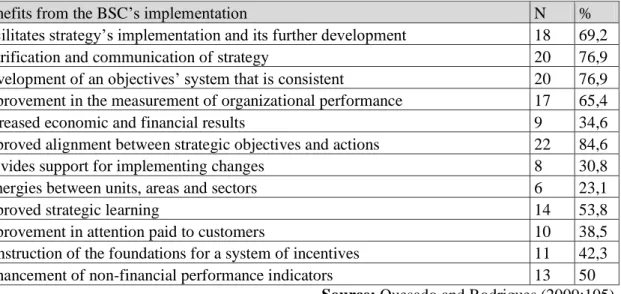
Taking into account the Portuguese context, the study developed by Quesado and Rodrigues (2009) shows that despite the low level of the BSC’s implementation in Portuguese large companies, there were benefits attributed to this tool when it was
18 implemented (Table 18 – Appendix III). From those benefits, the ones to highlight are the improvement of the alignment between strategic goals and actions and its clarification and communication throughout the company. The benefits found after the BSC’s implementation meet some of the reasons presented by the large companies to implement this tool in the future since the main reason is the alignment and communication functionality (Table 19 – Appendix III).
However, the BSC also has limitations to emphasize. According with Neely et al. (2000), performance measures (or indicators) that are imperfectly designed and implemented are expected to result in company’s dysfunctional behaviour. Although, the BSC is a valuable framework, it provides little guidance on how the appropriate measures can be defined, introduced and used to manage business (Neely et al., 2000). Chen and Jones (2009) concluded that, on average, there is a lack of acceptance of the BSC by those who are affected by it, in large measure, due to management’s inappropriate communication because many companies fail when it comes to communicate strategic goals to employees that generates low levels of motivation and commitment which is a barrier in the alignment of their human capital with the company's strategy. Moreover, employees of companies adopting the BSC do not perceive the organizational outcomes as more positive than those of the competitors who haven’t adopted the BSC, nor that the benefits of its implementation outweigh the associated costs.
Additionally, some companies can’t find a balance between financial and non-financial measures, neglecting the last ones over the first ones. Therefore, they are not being truthful to the name of the instrument they are applying, which suggests a balance in the strategic evaluation measures (Chen and Jones, 2009).
Following the same way of reasoning used regarding the advantages of the BSC, also in the Portuguese context it was identified reasons to not adopt the BSC in large Portuguese companies (Quesado and Rodrigues, 2009). The main reasons are the existence of tools that are useful and enough for company’s activity, the fact that the BSC does not fit company’s culture and mission and the companies do not recognize that the BSC could bring benefits to their business (Table 20 – Appendix III).
19
3.3. Strategic Management in Start-ups
According to Ries (2011:8), a start-up is “a human institution designed to create new
products and services under conditions of extreme uncertainty”. Start-ups are normally
conceived by entrepreneurs who have passion for the business they developed and believe in the success they can achieve (Harris, 2006).
A start-up is designated as a company that is in the first stage of its operations which implies a good management policy that can control costs and increase sales4. Generally, a start-up is a small firm and Mata and Machado (1996) confirms this by referring that new firms entering in the market (start-ups) are typically small and they initiate their operations at a small scale. Also Gelderen et al. (2000) consider start-ups as small firms and Talaulicar et al. (2005) did a study in which was necessary to highlight the difference between what happens in large companies and in start-ups since the last ones have limited size being smaller than large companies. It is visible that start-ups have different characteristics from larger companies. In fact, what happens is that characteristics of organizations vary across life-cycle stages (Moores and Yuen, 2001).
3.3.1. Organizational Characteristics across Life-cycle Stages
Miller and Friesen (1983, 1984) worked on the five-stage life-cycle model in which they used the Table 3 below to assign the companies of their study to the respective stage in the life-cycle.
Table 3 - Criteria to assign companies to the respective stage in the business life-cycle
Phase Criteria
Birth Firm is less than 10 years old, has informal structure and is dominated by owner-manager.
Growth Sales growth greater than 15%, functionally organized structure, early formalization of policies.
Maturity Sales growth less than 15%, bureaucratic organization.
Revival Sales growth greater than 15%, diversification of product lines, divisionalization, use of sophisticated controls and planning systems. Decline Demand for products levels off, low rate of product innovation,
profitability starts to drop off.
Source: Miller and Friesen (1983)
Based on their model, it was concluded that organizational characteristics vary across the stages in 5 main dimensions (Table 4): Situation (or context), Strategy, Structure, Leadership Style and Decision-Making Style (Moores and Yuen, 2001; Miller and Friesen, 1983; 1984).
4
20
Table 4 - Change in Organizational Characteristics across the five stages of the life-cycle model Organizational Characteristics
Situation Strategy Structure Leadership Style5 Decision-Making Style S ta g es Birth Small firm; Young firm; Homogeneous environment; Considerable level of service/Product innovation; Niche strategy; Substantial risk taking Informal; Undifferentiated; Power Centralized in the owner High initiation of structure; Low Consideration Crude information processing; Minimum amount of information used; Growth Medium sized; Older firm; More heterogeneous and competitive environment Incremental level of service/Product innovation; Rapid Growth Moderately formal; Moderately Differentiated; Somewhat less centralized Medium initiation of structure; High Consideration Maximum amount of information used; Initial development of formal information processing and decision-making methods Maturity Larger; Still older; Competitive and more heterogeneous environment Low level of service/Product innovation; Consolidation in the Market; Focus on Efficient Supply; Slower growth Formal and Bureaucratic; Moderately Differentiated; Functional basis of organization; Moderate centralization Medium initiation of structure; Medium Consideration Maximum amount of information used; Initial development of formal information processing and decision-making methods Revival Very large; Very heterogeneous, competitive and dynamic environment Substantial level of service/Product innovation; Diversification of product-market; Higher level of planning; Rapid growth Formal; Highly Differentiated; Divisional basis of organization; High initiation of structure; Medium Consideration Minimum amount of information used; Sophisticated controls and scanning in information processing; more formal analysis in decision-making Decline Medium size Homogeneous and competitive environment Low level of service/Product innovation; Price cutting; Conservatism; Slow growth
Very Formal and Bureaucratic; Moderately Differentiated; Functional basis of organization; Medium initiation of structure; Low Consideration Minimum amount of information used; Less
sophisticated information processing and decision-making
methods Source:Moores and Yuen (2001) and Miller and Friesen (1983; 1984) Taking into consideration that the goal of this dissertation is the analysis of the role of a strategic management tool (the BSC) in start-ups, it is relevant to focus on the analysis of the strategic management practices.
5
Initiating Structure - leader’s behavior that emphasizes the performance at work that focus on the attainment of the goals of the group by establishing clear channels of communication; Consideration – leader’s behavior characterized by friendship, mutual trust, respect and concern in relationship between the leader and the group (Fleishman, 1973 apud Holtz and Harold, 2013)
21 At the beginning of this literature review, it was approached different ways of formulating a strategy in a company which can be done in a, more or less, formal way. Also for start-ups this dilemma between applying formal or informal writing and implicit strategies has been debated by several authors. Based on the analysis of Smith (1998), it was concluded that if on one hand the studies developed by Porter demonstrate that formal planning is more effective, Mintzberg’s study reveals that formal planning could be too rigid and it is necessary to use an adaptive approach that incentives intuition and creativity around the company.
Smith (1998) wanted to understand how this question of planning or not, occurred strategically in small start-ups with less than 10 employees. He concluded that the majority of the companies he had studied had a business plan and it was formally written, which was very useful when these companies started to grow because the main documents about its strategy were already designed. Formal planning leads companies to achieve easier the specified objectives and to outline the path to follow. In fact, Smith (1998) concluded that small start-ups should plan its strategy to better organize their business, to allocate efficiently the resources and to understand if they are achieving or not what was stipulated in the plan. The study showed that firms which plan the strategy performed better than the ones that left things to chance and act in a reactive way. Indeed, the author discovered that strategic planning was also useful and advantageous for micro organizations and it was able to develop and sustain a competitive advantage through the definition of formal measures incorporated in the strategic planning processes.
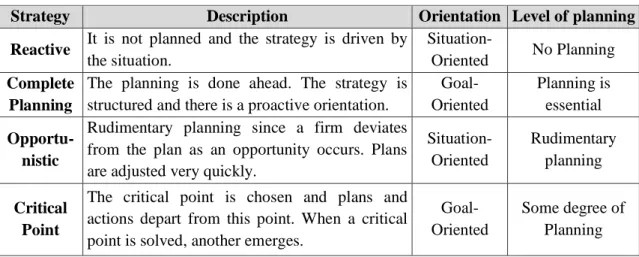
But the choice of formalizing or not the strategy depends on the stage of the business life-cycle and the environment characteristics in which the company is (Gelderen et al., 2000; Moores and Yuen, 2001; Miller and Friesen, 1983; 1984). Gelderen et al. (2000) developed a study in 49 small business start-ups applied in two different periods of time6 in which they compared the types of strategy formulation used with the environmental characteristics and performance. Based on this, the Table 5 below synthesizes the four action strategies approached in start-ups, their characteristics and their level of planning:
6
The first application occurred near the initial stage of the company and then the same interviews took place 16 months after