A Work Project, presented as part of the requirements for the Award of a Masters Degree in Management from the NOVA – School of Business and Economics
FORMING THE LINK BETWEEN STRATEGIC PERFORMANCE AND OPERATIONAL SUCCESS: THE DEVELOPMENT OF A BALANCED
SCORECARD AT LISBON CONSULTING GROUP
STEFANIE MARIA SCHINDLER, 1033
A Project carried out as a Direct Internship at Lisbon Consulting Group, under the supervision of:
Carlos Marques
Abstract
The purpose of this research is to develop a Balanced Scorecard for Lisbon Consulting Group (LCG) that forms the link between Strategic Performance and Operational Success. Therefore, strategic internal and external analyses, such as SWOT, PEST and Customer Value Proposition Analyses were conducted in order to adapt the Balanced Scorecard to the company’s reality. Furthermore, this paper examines the market environment of consulting companies. For this purpose, a value chain for consulting companies was established and the industries’ best practices were explored through a Benchmark Approach that followed a qualitative research method. As a result, the Balanced Scorecard for LCG is both, a reflection of the company’s reality and the consulting market. Thus, this work serves as well as a general Balanced Scorecard framework for consulting companies. The implementation will contribute to the future value of LCG as it measures the company’s performance and sets and communicates targets and initiatives in a short-term and long-term perspective.
0 I
TABLE OF CONTENT
LIST OF ABBREVIATIONS ... I LIST OF FIGURES ... II
I) INTRODUCTION ... 1
1) Purpose of the Work ... 2
2) Literature Review ... 2
II) THE BALANCED SCORECARD – A TOOL FOR FORMING THE LINK BETWEEN STRATEGIC PERFORMANCE AND OPERATIONAL SUCCESS .... 4 1) A Balanced Scorecard’s Strategy Map ... 6
2) KPIs, Targets and Initiatives as performance measures ... . 7 3) Discussion of alternative Strategy Performance Management Models ... 8
3.1) Maisel’s Balanced Scorecard Model ... . 9 3.2) The Efficiency or SMART Pyramid ... 10
3.3) The EP2M Model ... 11
III) THE DEVELOPMENT OF A BALANCED SCORECARD AT LISBON CONSULTING GROUP (LCG) ... 12
1) Company Profile ... 13
1.1) Mission, Vision, Values of LCG ... 13
1.2) Customer Value Proposition of LCG ... 15
1.3) SWOT Analysis of LCG ... 16
2) Value Chain of a Consulting Company ... 20
3) Benchmark Approach ... 23
4) Development of LCG’s Critical Success Factors and its Strategy Map ... 30
5) Applicability of LCG’s Strategy Map for Consulting Companies ... 34
6) Identification of LCG’s KPIs, and Initiatives... 34
IV) IMPLEMENTATION OF LCG’S BALANCED SCORECARD THROUGH A BUSINESS INTELLIGENCE FRAMEWORK ... 40
V) CONCLUSION ... 42
REFERENCE LIST ... 44
LIST OF ABBREVIATIONS
BI Business Intelligence BSC Balanced Scorecard CSF Critical Success Factor e.g. exempli gratia;for example FTE Full-time employee
GCR Global Competitiveness Report
HR Human Resource
i.e. id est; this means
IT Information Technology LCG Lisbon Consulting Group
KM Knowledge Management
KPI Key Performance Indicators NPS Net Promoter Score
PEST Political, Economical, Social and Technological ROI Return on Investment
SMART Strategic Measurement and Reporting Techniques SME Small and Medium Enterprise
SWOT Strengths, Weaknesses, Opportunities, Threats
1
LIST OF FIGURES
Figure 1: The Balanced Scorecard Framework... 6
Figure 2: Maisel’s Balanced Scorecard... 9
Figure 3: The SMART Pyramid... 10
Figure 4: The EP2M Model... 11
Figure 5: LCG’s Internal and External Values... 14
Figure 6: LCG’s Value Proposition... 16
Figure 7: Value Chain of a Consulting Company... 21
Figure 8: Competitive Landscape of Consulting Companies...………..…………... 24
Figure 9: Financial and Customer Indicators of LCG’s Main Competitors……….. 26
Figure 10: Comparison of LCG and a Benchmark Company………... 29
Figure 11: LCG’s Strategy Map……… 30
Figure 12: LCG’s Critical Success Factors and KPIs of the Financial Perspective... 35
Figure 13: LCG’s Critical Success Factors and KPIs of the Customer Perspective……….... 37
Figure 14: LCG’s Critical Success Factors and KPIs of the Internal Processes Perspective... 38
Figure 15: LCG’s Critical Success Factors and KPIs of the Learning and Growth Perspective... 39
1 I) INTRODUCTION
2 part of the development of LCG’s Balanced Scorecard consists of the elaboration of LCG’s KPIs and Initiatives. Although clear targets have been set for all KPIs of LCG, they are substituted by an “X” in this work instead of the real number or the percentage according to the confidentiality commitment that has to be met. After the Balanced Scorecard has been developed, it will be implemented through a specifically elaborated Balanced Scorecard Excel Spreadsheet. Moreover, a Business Intelligence Framework was considered to visualize the company’s Balanced Scorecard.
1) Purpose of the Work
The purpose of this Work is to create a strategic planning and management system for LCG as a Small and Medium Enterprise (SME) that aligns the company’s strategic goals including its mission, vision and values to the company’s business activities and foster the firm’s internal and external communication. Since Lisbon Consulting Group is still a small player in the highly competitive and fragmented consulting market, where top-tier consulting companies are already well positioned, it is vital for LCG to establish performance measures and targets in order to expand its market share. This Work Project provides LCG with the necessary tools and capabilities to address this challenge.
2) Literature Review
4 chain had to be adjusted as well. His concept of a value chain is described in a very detailed way in his book Competitive Advantage. Creating and Sustaining Superior Performance (1985). Still, his approach targets only traditional industrial processes. This Work Project in contrast, designed a value chain for consulting companies, which represents a new attempt due to the fact that no scientific articles could have been found, which were published on this subject. Therefore, this Work Project distinguishes itself through adjusting concepts that were originally designed for traditional industries to the consulting environment. The Implementation of the Balanced Scorecard is based on a detailed Balanced Scorecard Excel Spreadsheet, which is further developed into a Business Intelligence Framework. Therefore an SAP Solution, namely the SAP Chrystal Dashboard Designer Program, is applied that supports this transformation.
II) THE BALANCED SCORECARD – A TOOL FOR FORMING THE LINK BETWEEN STRATEGIC PERFORMANCE AND OPERATIONAL SUCCESS
5 motivated and competent employees, an admired corporate culture, high-quality services, reliable internal processes and satisfied customers (Kaplan, 1996: 2). Intangible assets are critical as they represent the driving factors of a company. By reducing the company’s effort on strengthening those, the negative effects are directly reflected in the company’s income statement. As intangible assets are generally more difficult to measure than tangible assets, a tool had to be created that displays the important interrelation between the key success factors of a company. Bearing that in mind, Robert S. Kaplan and David P. Norton established a strategic measurement system – the Balanced Scorecard – that displays both financial and operational measures (Please refer to Figure 1) and as a part of the Balanced Scorecard a tool that indicates the cause-and-effect relationship between those key success factors – the Balanced Scorecard’s Strategy Map.
“The Balanced Scorecard retains an emphasis on achieving financial objectives but also includes the performance drivers of these financial objectives.” (Kaplan, 1996: 2)
6 1) A Balanced Scorecard’s Strategy Map
7 hardly significant tools available that describe the dimension of their value creation. Strategy Maps, however, serve as such a tool since they do not only display individual assets but the bundle of intangible and tangible assets (Kaplan, 2004: 30). Moreover, it demonstrates the overall company’s strategy that connects these assets and converts them into the desired outcomes. Consequently, establishing Strategy Maps is one of the most important parts of developing a Balanced Scorecard as they serve as a supporting tool to chart and visualize complex business processes. Attention should be paid on how to adapt the Critical Success Factors of the BSC’s four perspectives to the company’s overall strategy. Thus, the Critical Success Factors have to be defined and more importantly individualized through adjusting each of them to the company’s reality. As a consequence, there is neither a unique guideline nor a standardized rule on how to develop Critical Success Factors.
2) KPIs, Targets and Initiatives as performance measures
Key Performance Indicators, Targets and Initiatives are set after having defined the company’s Critical Success Factors. KPIs specify how Critical Success Factors can be achieved and serve as performance measures. Being seen as such, Targets for KPIs have to be set in order to be able to measure clearly the performance of the company, i.e. in which KPIs the company improves, over-performs or under-performs. Initiatives are defined actions, which are established in order to achieve the targets that have been set for the KPIs. This can include creating a new business unit, launching a customer survey or building up a talent pool.
Criticism
8 external developments of a company, including the changing market environment and new business needs that potentially cause the necessity to adapt the company’s strategy to the new circumstances. In addition to that point, the Balanced Scorecard does not provide a framework for analyzing the company’s main competitors or the market evolution. Without knowing the industry’s performance standards, it is difficult to set performance measures that compete with the industry’s practices. Another lack of the Balanced Scorecard is that it represents a simplified demonstration of a company’s reality. As a matter of fact, cause-and-effect relationships are not easily assigned due to the complex business environment as well as the interrelation of the different CSFs. Thus, trade-offs arise between the Critical Success Factors that are not always visible instantly (Gamroth, 2010: 138). Therefore, it is of utmost importance to identify the causes that have the biggest influence on the outcome as well as those that can be influenced by the management. If companies fail in identifying them in the right way, it will not only provoke the failure of the Balanced Scorecard but this misleading can also result in serious troubles for the company. Another deficit is that the Balanced Scorecard indeed provides information on current cash flows and future indicators but it will not directly forecast the company’s future cash flows, level of efficiency or survival.
After having defined the main points of criticism, this Work Project attempts to avoid them by directly addressing them through conducting external and internal strategic analyses as well as a Benchmark Approach, through which the Critical Success Factors and its cause-and-effect relationships can be identified accurately. Moreover, short and long-term goals are defined in order to guarantee the sustainability of LCG’s Balanced Scorecard.
9 measure, manage and document companies’ activities and strategic performance. In the following, some of them shall be discussed shortly.
3.1) Maisel’s Balanced Scorecard Model
Lawrence S. Maisel introduced a similar model to Kaplan and Norton’s Balanced Scorecard, which was published in the Journal of Cost Management (1992) (Please refer to Figure 2). Maisel’s approach examines explicitly the evaluation of the performance efficiency of employees and therefore stresses the Human Resource Area. He replaces the “Learning and Growth Perspective” by the “Human Resource Perspective” and measures the factors of Education
& Training, Innovation and Intellectual Assets (BSC Designer, 2012: online). Maisel argues that the company should stress the role of Human Capital and in specific the evaluation of its efficiency, while
10 3.2) The Efficiency or SMART Pyramid
C.J. McNair and Richard L. Lunch introduced a customer-oriented model in the journal Management Accounting (1990), which is called the Efficiency Pyramid (Please refer to Figure 3). Its key concept is based on linking the corporate vision to corporate internal as well as external focused measures like financial and performance indicators. The Efficiency Pyramid is also known as the Strategic Measurement and Reporting Techniques (SMART) Pyramid and is based on the concepts of Quality Management and Industrial Engineering. The Critical Success Factors are either allocated to the external or internal efficiency
dimension. Within those two dimensions four different levels exist that measure the company’s overall performance. To the external efficiency dimension belongs the company’s vision,
11 3.3) The EP2M Model
The Effective Progress and Performance Measurement or EP2M Model was introduced by C. Adams and P. Roberts in the journal Manufacturing Europe (1993) (Please refer to Figure 4). According to the authors, a company shall focus on four different areas, namely on serving Customer and
Markets (external measures), improving Internal Processes (internal measures), which includes increasing profitability and efficiency, managing strategy and change (Top-Down Process) and empowering ownership and freedom
of actions (Bottom-Up Process). Therefore, the EP2M regards a company’s strategic management in two ways: in developing a strategy and in implementing a strategy. The development of a strategy is an analytical process and clarifies the necessary steps for achieving this (BSC Designer, 2012: online). The implementation process includes setting strategic goals, which belongs to the organization process, and contributes to the enhancement of managerial skills and change management (BSC Designer, 2012: online). The EP2M Model strengthens the position of change management and fosters a corporate culture in which change is considered as a regular process. Moreover, it stresses the need for a continuous and effective feedback system especially for employees that are involved in the decision-making process and the implementation of the strategy (BSC Designer, 2012: online).
Discussion and Conclusion
12 elaborated concept compared to the three alternative models as its founders Robert S. Kaplan and David P. Norton continued to further develop and optimize it within the last 20 years through various articles and books (Please refer to Point I.2). This enabled the Balanced Scorecard to become a highly elaborated and detailed Strategic Management System that extends the set of business units’ objectives beyond the traditional financial measures. The Balanced Scorecard creates a symbiosis between a company’s traditional financial measures and the urgency to build long-term competitive advantages through non-financial assets whereas the other three models tried to achieve the same goal but failed in the realization. Maisel’s Balanced Scorecard is similar to Kaplan and Norton’s Balanced Scorecard but concentrates only on employees’ competencies in its Human Resource Perspective and lacks the focus on Technology and Corporate Culture, which build the pillars of a strong, innovative and successful company. The SMART Pyramid is based on Quality Management and Industrial Engineering. Although it includes two important dimensions, namely the internal and external efficiency of a company, it hardly includes soft skills, which are vital for a company as they are recognized as its performance drivers. The EP2M Model is the most complete of the Alternative Models but by being established in 1993, it still lacks further academic and practical development. Consequently, the Balanced Scorecard is the preferable model since it is not only the most elaborated due to the fact that it is more than 20 years in operation and further developed model but it also enables a company to link its strategy within different business units and thus, improve its performance.
III) THE DEVELOPMENT OF A BALANCED SCORECARD AT LCG
13 LCG is a SME, the structure of the Balanced Scorecard has to be be adapted to this circumstance, which means for example that losing the track of the business’ culture is less relevant for a small consulting firm such as LCG than for large-sized corporations whereas setting clear objectives for the Business at this stage are vital and shape the future for SMEs (Acumen Integrat, 2009: online), in this case for LCG.
1.) Company profile
Lisbon Consulting Group was a spin-off of the consultancy department of Grupo Digisis until the year 2009. Due to its verified growth above € 1,5 million, LCG undertook a Management Buy-Out in the year 2009 and became autonomous. LCG is based in Lisbon, has opened an office in Luanda, Angola, in November 2012 and consists of 30 employees (Please refer to the Supplementary Appendix 1 for LCG’s organizational chart). Lisbon Consulting Group has the following four functional practices: Strategy, Operations, Organization and IT Systems. Moreover, LCG operates in six different industry areas which are first, Financial Services, second, Industry, Consumer Business and General Services, third, Telecom, Media and Entertainment, fourth, Energy, Transportation & Infrastructure, fifth, Energy, Transportation and Infrastructure and sixth, NGO and Health sectors.
1.1) Mission, Vision and Values of LCG
14 potential at its best and pave the way for outperformance. The advantage of the mission’s double focus portrays a cycle: If the company enables its employees to achieve excellent results, they can pass on their excellence to customers through their services and help them in turn to achieve excellence in their company as well. The requirement for a clear mission statement is therefore fulfilled as it accurately reflects the purpose of LCG.
LCG’s aspiration for future results is stated in its Vision “To Be Leaders in terms of Innovative Business Solutions and Services” (LCG, 2012a: online) and clarifies clearly what LCG claims for, namely leadership within the markets they operate in. The vision is based on long-term goals and outlines what LCG wants to achieve in the future.
15 Trust. LCG invests in the value creation for its clients and respects and protects the clients’ confidentiality.
1.2) Customer Value Proposition of LCG
16 companies such as Deloitte are already well positioned. The Big Three are traditional Management Consulting Companies and face limited presence in areas related to technology consulting, which could impede their growth in future. Even though these companies offer technology-consulting services to the clients through its Business Technology Office, their scale of technology consulting services is limited, being compared to their peers like Accenture, IBM or Deloitte. LCG recognizes these future trends and reacts by creating two pillars of its core business: the traditional management consulting, which covers strategy, organization and operation and IT consulting, which is becoming increasingly important in the near future.
1.3) SWOT Analysis of LCG
17 A SWOT Analysis conducts two analyses: an internal analysis - i.e. a company analysis - that examines the company’s strengths and weaknesses and an external analysis – i.e. business environment analysis – that appraises the opportunities and threats for a company (Dess, 2004: 41) and hence, serves as a helpful tool for a company’s strategic planning process. A more detailed external analysis is represented by the Political, Environmental, Social and Technological Analysis (PEST Analysis) that describes the market environment, where the company is embedded. Hence, a PEST Analysis has been carried out for LCG (Please refer to the Supplementary Appendix 2 for a detailed description of this Analysis). The PEST characteristics are seen as universal and self-explanatory factors that affect all consulting companies in the Portuguese business consulting service market. Although the findings have been taken into consideration for creating LCG’s Balanced Scorecard, it will not be discussed in further detail.
Due to the fact that the SWOT analysis combines a company’s internal and external analysis, the management gets a comprehensive overview of how strengths can be used to pursue opportunities and avoid key business risks and how potential threats can be overcome by the company’s strategy. This SWOT Analysis (Please refer to Appendix 1 for a detailed description of this analysis) is adapted to the structure of the four perspectives of the Balanced Scorecard.
18 balanced, which leads to an unstable cash flow as well. Furthermore, the average time of receiving money from clients is very high and LCG’s policy to shorten this period of time is too insufficient. Moreover, LCG has too less opportunities for new investments in growing markets. A financial opportunity for LCG could therefore be to strengthen its position in Angola and Mozambique, where LCG already operates in and leverage LCG’s Balanced Sheet through these emerging markets. By offering high value added Business Consulting services at a competitive price, LCG can profit through adapting its competitive advantage to this circumstance. On the other hand, LCG is exposed to financial threats: Having its headquarter in Portugal, LCG has to cope with the stagnant market environment and declining margins due to the current economic crisis. In contrast, the price pressure on consulting day rates increases.
19 are more prone to be substituted because there are hardly switching costs for customers and there is already a high number of Information or Knowledge based products in the market. Another threat is that LCG is so far only a small player in a market that is characterized by international integrated and renowned competitors.
Internal Processes: One of LCG’s biggest strengths within the Internal Processes Perspective is its light hierarchical structure that allow its employees to save time and speed business processes. LCG’s main weaknesses in the Internal Process Perspective is its lack of formulized and standardized processes and procedures. LCG’s biggest opportunities consist of using Outsourcing Services that relieve the company’s back office and of using cloud computing that simplifies internal processes. A threat is that LCG’s Internal Processes are not aligned, which could cause significant problems with its Internationalization Strategy in the near future.
20 to exchange directly with high-potentials. Another important opportunity for LCG is that due to the economical crisis talent resources are available. Moreover, LCG could profit from acquiring new companies with complementary offers. A significant Threat for LCG is to lose accumulated knowledge by key employees due to the high employee turnover in the consulting industry, which is between 15-20% (Batchelor, 2011: online). Another threat is that there is no evaluation system so far that evaluates internal (e.g. FTEs) as well as external (e.g. Freelancer) high potentials.
In order to complete the Internal Analysis that was carried out by the Strengths and Weaknesses Part a value chain will be applied to the consulting industry in the following point.
2. Value Chain of a Consulting Company
The Value Chain Analysis is a widely used analytical tool that identifies the necessary sequence of processes in order to be able to deliver a company’s product and services to customers (Kaplan, 2008: 49) and was introduced by Michael Porter in the year 1985.
“A firm’s value chain and the way it performs individual activities are a reflection of its history, its strategy, its approach to implementing its strategy and the underlying economics of the activities themselves.” (Porter, 1985: 36)
21 deal with the production and further processing of tangible products. As business processes of consulting companies are different since their main products of consulting companies are services, i.e. intangible products, Porter’s value chain has to be re-formulated to make it applicable to consulting companies (Please refer to Figure 7).
Although the framework of Porter’s value chain will remain, the five generic categories of the primary activities have to be modified. In addition, some of the support functions have to be adapted to the demands of the consulting environment as well. The primary activities of this value chain are Know-How Acquisition, Information Treatment, Marketing & Sales, Service Delivery and After-Sales Support.
22 but also to guarantee that employees get the best training and educational supports in order to support clients with the highest possible Know-How and solutions. Information Treatment consists of the transformation process from the company’s expertise and knowledge into personalized solutions for the clients. Therefore, the company is able to add the best possible value to its clients. This process includes identifying opportunities at potential clients and delivering proposals.
Marketing & Sales is in the value chain for consulting companies as important as in Porter’s Value Chain. This includes building up a strong brand-awareness in order to successfully position itself in a highly competitive and fragmented market environment
where consulting companies find themselves in.
The Sales Process is completed when the client has accepted the proposal and hires the
consulting company for a specific project.
The fourth category is composed of the Service Delivery, which includes the process of carrying out the project at a client and complete it in a specific time on which the client
and the consulting company agreed.
After-Sales Support is the last category of the value chain for a consulting company and is currently recognized as one of the biggest weaknesses of consulting firms. Improving this category gives consulting companies that take that necessity into account, a considerable competitive advantage as clients recently claim for this service the most.
23 operating consulting companies, as it guarantees that guidelines are complied and expertise and knowledge are shared within the company. The Firm Infrastructure includes different divisions of a consulting company like General Management, Finance, Accounting or Legal Affairs. For LCG, this corresponds to Finance, Quality management, Marketing, IT, and Administration. The Firm Infrastructure supports the entire value chain and is therefore a very important part of a consulting value chain. Another important support function for a consulting value chain is Human Resource Management since recruiting, hiring, motivating, training, developing and compensating form to a great extent the competitive advantage of consulting companies and consequently represents a key for success.
The last support function is Technology Development, which is – as the category Human Resource Management – very comprehensive. The development of technology and technological knowledge is not only important for internal processes but for providing clients with technological solutions as well. Technology consulting, which includes the development and the implementation of technological and more specifically IT consulting solutions, depicts the new trend in consulting in general. Hence, the support function Technology Development is increasingly becoming a guarantor for establishing a competitive advantage as it represents both, new business opportunities and smooth running business processes.
3. Benchmark Approach
24 launched in order to analyze the performance drivers of LCG’s competitors and thus, establish Critical Success Factors that take them into account (Please refer to the detailed Online Survey in the Supplementary Appendix 3). Due to confidentiality reasons, the
company names stay anonymous.
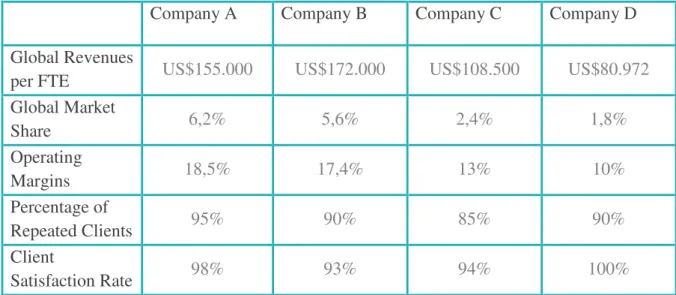
As already mentioned in Point II.1.2, LCG offers two types of consulting services, Management Consulting and IT Consulting services. Figure 8 demonstrates the Competitive Landscape of Consulting companies, which is divided in Strategic Consulting Boutiques, Global Strategic Consulting Firms, IT Consulting Boutiques and Global IT Consulting Firms. The size of the circle represents the size of the company’s employees (the data is taken from the Companies’ Homepages and refer to the year 2011).
25 larger - generalist - consultancies and structured around in-depth expertise and knowledge of either specific functional practices or industries (INSEAD, 2011: 10). In contrast, Global Consulting Firms provide its services to all industries with a wide range of functional practices across a huge geographical area (INSEAD, 2011: 10). LCG’s main competitors are consulting companies that are located in the dividing line between Management Consulting and IT Consulting Firms. As a result, LCG considers companies such as KPMG, Deloitte, PWC, Capgemini, IBM, Accenture or Deloitte as its main competitors due to the fact that smaller consulting boutiques specify usually in either Management Consulting or IT Consulting and consequently, do not offer both services like LCG. Still, it has to be taken always into consideration that LCG is a small consulting company that cannot compete so far with these top-tier consulting firms in a global perspective. But since the four analyzed companies operate in the Portuguese Market and moreover, in the same business area, we are able to compare them - always bearing in mind that LCG does not have the same financial resources, capacities and firm infrastructure conditions as its competitors do.
26
Company A Company B Company C Company D
Global Revenues
per FTE US$155.000 US$172.000 US$108.500 US$80.972
Global Market
Share 6,2% 5,6% 2,4% 1,8%
Operating
Margins 18,5% 17,4% 13% 10%
Percentage of
Repeated Clients 95% 90% 85% 90%
Client
Satisfaction Rate 98% 93% 94% 100%
Figure 9: Financial and Customer Indicators of LCG’s Main Competitors, Own Diagram
27 tools, which support the client in reducing risk for the client. Company D stated that it uses a specific client satisfaction assessment, which shall guarantee that the service is always delivered on time and even surpasses the clients’ expectations, which shall be achieved not only responding to customer’ specifications, but also provide them with a competitive advantage in terms of time, quality and reliability. This philosophy shall ensure and foster a strong client relationship.
Innovation: Company A fosters an Innovation spirit within its company by investing in it. The Company established dedicated programs for fostering innovation, e.g. a online space, which gets people out of their comfort zone through experimenting with new models. Company A’s forward looking Initiatives allow the company to grow and create new opportunities. Company B characterizes Innovation through the ability to think differently and create a different experience for clients. Hence, Company B invested as well in the Innovation team in order to provide them with the necessary skills and techniques to be role models for the overall firm. For Company C Innovation stands not only for Product Innovation but also for organizational and business model innovation. Company C tries to meet the company’s requirement on Innovation through organizing Innovation congresses and continuously updating the company’s Innovation base. Moreover, it capitalizes on Innovation through the best talent available. Company D recognizes the strong competitive environment, which navigates the company to redouble its effort in Innovation. Hence, it established multi-client platforms, became an Enterprise-Resource-Planning Vendor, integrated cloud computing in daily operations and uses cutting-edge projects as way of experiencing new business areas and opportunities.
28 was ranked “Very High”. All five companies agreed on the types of trainings they offer to their employees, namely Web-Based Training Programs, On-Job Training, In-class training, a Mentor for Young Professionals, Simulation Programs and internal as well as external Lectures and Conferences. Although the interviewees stated that MBA Programs are not directly part of the company’s training opportunities, these programs are in some cases either supported financially until a limited extent or in some exceptional cases the costs for an MBA Program are covered completely. The interviewees stated in a uniform way that the capabilities that are fostered in those trainings are IT/Business Analytics Skills, Project Management Skills, Leadership Capabilities, Social Skills, Financial Skills and Presentation Skills, whereas Language Skills or Intercultural Communication were not named. The provided training hours per day differ between the four analyzed companies: Company A 12.000 hours, Company B N/A, Company C 16.000 hours and Company D 15.000 hours.
29 productivity gains with quality metrics and standards; the employees are trained in a common set of methodologies, tools, architectures and metrics, which form the basis for high-quality services for Company C. Company D aims to connect personal values and goals to the company’s overall strategy and hence, tries to get the best out of their employees. Furthermore, Company D stated that it has ambitious growth objectives and consequently invest in Technology and Innovation in order to be able to offer its clients services of the highest quality.
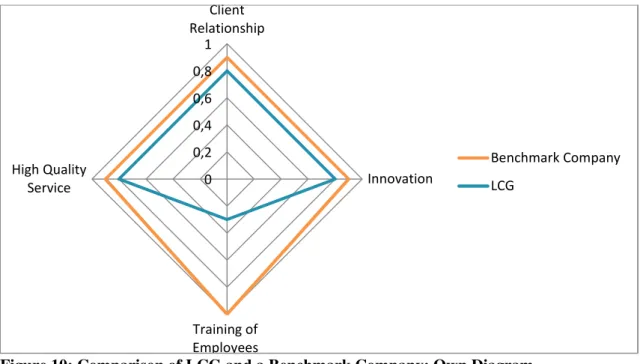
Comparing LCG with one of the Benchmark Companies, LCG lacks sufficient training possibilities for its employees (Figure 10). Hence, the biggest challenge that LCG faces to compete with its main competitors is strengthening its training facilities.
Figure 10: Comparison of LCG and a Benchmark Company; Own Diagram
Having revised the surveys and analyzed LCG’s main competitors and their performance drivers, the Balanced Scorecard for LCG can be established by taking into account the identified key factors of success of the four analyzed firms. Moreover, it is vital to know the competitors’ strengths not only to profit from their experience and identified Critical Success Factors but also to develop ways and niches where LCG can even surpass its
0 0,2 0,4 0,6 0,8 1
Client Relationship
Innovation
Training of Employees High Quality
Service
Benchmark Company
30 globally renowned competitors such as offering (potential) clients the same high quality services but at a competitive price.
4. Development of LCG’s Critical Success Factors and its Strategy Map
After having conducted these internal and external analyses and understood the company’s reality and the performance drivers of its main competitors, a proper Strategy Map for LCG can be created (Please refer to Figure 11).
Figure 11: LCG’s Strategy Map; Own Diagram
31 company’s main performance drivers. Affecting the other three perspectives, the Learning and Growth Perspective is seen as the BSC’s ground line and thus, settled in the bottom of a BSC Strategy Map.
As already mentioned, a Strategy Map is a set of Critical Success Factors that are interrelated through their cause-and-effect relationships. With regard to the Learning and Growth Perspective three main categories are essential for LCG, namely Employees’ Competencies, Corporate Culture and Technology. The Learning and Growth Perspective is long-term oriented, i.e. for a period of three to five years. The category Employee Competencies can be expressed through two different Critical Success Factors, which are first identifying, attracting and retaining skilled employees and second enhancing staff competencies through continuous training and extending the employees’ understanding of customers’ needs and the market LCG operates in. Those two Critical Success Factors are of utmost importance, which has been proved as well by the Benchmark Approach in Point III.3. The analyzed companies are outstanding in the area of employee competencies as this category is recognized as one of the most
important performance driver of a company.
The CSF for LCG’s Corporate Culture is to foster a working environment that encourages, recognizes and rewards the performance of the company’s employees. Moreover, business goals shall be aligned with personal goals. In January 2013, the results of the first internal employee survey will be published, where the personal goals of each employee are analyzed and identified. These results will allow LCG to connect the employees’ personal goals with the firm’s business objectives.
33 Process, which includes first, to develop new services and as a second CSF to identify new markets and opportunities and adjust the company’s lines of actions.
The CSFs of the Internal Processes Perspective have direct impact on the Customer Perspective. LCG’s Customer Perspective is divided into “Promote current Business” and “Expand in New Businesses” and consists of long-term oriented Critical Success Factors. Positioning itself in both is of utmost importance for LCG as it is a SME that has to clearly position itself in the market. The Customer Perspective itself is divided in three subcategories, which are “Relationship”, “Product” and “Brand”. The Critical Success Factors for “Promote current Business” are first to establish long-term customer relationships and second to understand and meet client’s expectation and needs. Both are subordinated under the category Relationship. The importance of these two CSFs have also been demonstrated by the Benchmark Approach in Point III.3. The next category is Product. The Critical Success Factor that is vital for both categories namely for “Promoting current Business” and for “Expand in New Business” is offering high quality and customized business solutions through a fast delivery. The other CSF that is set for category Product but belongs to “Expand in New Business” is to deliver consulting services at a competitive price, which was already discussed in LCG’s Customer Value Proposition. The Critical Success Factor that was set for the category Brand is to increase LCG’s national and international brand awareness.
34 Improve Project Margins, to Optimize Asset Utilization and to Expand Company’s Profits, which all in all leads to an improvement in the company’s value.
5. Applicability of LCG’s Strategy Map to Consulting Companies
Although a Strategy Map has to be adapted to the company’s reality and strategy, the Strategy Map for LCG serves as a base for the development of a Strategy Map at any consulting company as it is already aligned with the Businesses Processes of the Value Chain for Consulting Companies. Still, the Critical Success Factors have to be adapted to the company’s needs, in this case of LCG’s needs as a SME, even though the categories within the different Perspectives, such as Customer Relationship Management, Operational Excellence and Innovation Process of the Internal Processes Perspective or Employees Competencies, Corporate Culture and Technology of the Learning and Growth Perspective are relevant for any consulting company. For modifying the Critical Success Factors, it is very important for every consulting company to identify its mission, vision and values, its strategy, its customer value proposition, and carry out a SWOT Analysis before being able to create a Strategy Map that is adapted to the company’s reality.
6. Identification of LCG’s KPIs and Initiatives
36 from zero to 6 are detractors. The NPS is then calculated by subtracting the percentage of detractors from the percentage of promoters (Reichheld, 2003: 53).
In order to “Offer high-quality and customized Business solutions through fast delivery”, the KPI that were set are Projects completed on time and the Perceived added value to client. Rather than using the perceived added value to client, the author suggested to use the Return on Investment (ROI). Due to difficulties in calculating it for LCG this suggestion was rejected and replaced by the perceived added value. Nevertheless, Consulting companies require greater accountability.
“With expenditures growing for consulting services and with increasing dissatisfaction with the quality and success of consulting assignments, there is tremendous pressure to show accountability measured in terms that managers, executives, and administrators clearly understand – return on investment.” (Philipps, 2011: xi).
Using the ROI for calculating the promised outcome and the actual contribution to the client’s problem solving, results in a high level of trust in the consulting firm. Furthermore, if the consulting company has proved its quality work, it can expect an excessive client satisfaction rate, a long-term customer relationship, a high rate of repeated customers as well as a meaningful rate of new customers, which all in all leads to a significant competitive advantage. The Formula that Philipps (2011: 39) suggests for calculating the ROI for consulting firms is:
ROI %= Net consulting monetary benefits
Consulting costs x100
37 The KPIs that are set for the Internal Processes Perspective, in specific for the Customer
38 LCG’s competitive advantage arises, among others, from its employees, which have a long and profound expertise and experience in consultancy and in industries and markets where consulting companies operate in.
39 plans and second, Overall satisfaction of employees. As LCG increasingly operates international, a Knowledge Management Platform is vital. Therefore one KPI is to Implement a Knowledge Management Platform at LCG. The other KPI, which is Percentage of eligible employees that are trained on Business Analytics Systems, is meant for the second part of the CSF, namely for “keeping pace with new businesses and technologies”.
Initiatives
40 leads to new initiatives in the marketing segment. Moreover, LCG identified Brazil as new target market and will enter this emerging market in 2013. In addition, LCG could take advantage of the identified best industry practices in the Benchmark Approach in Point III.3, e.g. to use Value Driven Approach and to share risk and reward with its clients. Furthermore, the Balanced Scorecard will be implemented in the company, which encourages and supports LCG’s process improvement.
IV) IMPLEMENTATION OF LCG’S BALANCED SCORECARD THROUGH A BUSINESS INTELLIGENCE FRAMEWORK
The Implementation of LCG’s Balanced Scorecard requires the creation of an Excel Sheet that displays LCG’s Critical Success Factors, Key Performance Indicators, Targets, Comments and Initiatives, Actual Performance and an Alarm, that is automatically triggered if the company underperforms in one KPI. The range of the Alarm follows the colors of a traffic light: Green is programmed as “Excellent”, Yellow as “Cautious” and Red as “Alarm” (Please refer to the Supplementary Appendix 4 to see an excerpt from LCG’s Balanced Scorecard’s Excel Spreadsheet). Moreover, two Types of KPIs were automated: Type A KPI is used for positive KPIs, which means that an increasing of the company’s measure is intended (e.g. company’s Equity Ratio). In contrast, the decreasing of a measure (e.g. % of overhead costs) is regulated by Type B KPI.
41 includes its Critical Success Factor, targets, the identified initiatives, the short-term or long-term orientation of each KPI and the alarm for each target that warns LCG if it is underperforming (Please refer to the Supplementary Appendix 6, which gives an Example of a Slide of the Handbook).
Apart from the Excel Spreadsheet, a Business Intelligence Framework is established in order to visualize LCG’s Balanced Scorecard. For this purpose, SAP Crystal Dashboard Design was used in order to summarize the company data through a visual and interactive tool. The Excel Sheet is added into the SAP Crystal Dashboard Design Framework. The next step is to adapt different visual diagrams to the company’s notions. Apart from the software that supports the implementation of the Balanced Scorecard, it is substantial that the implementation is well communicated. “Employees are the ones who improve the processes and run the projects, programs, and initiatives required by the strategy” (Kaplan, 2008: 12). Hence, it is vital that LCG’s employees understand the implemented Strategic Measurement System in order to successfully link their day-to-day operations to it as well as to be motivated to achieve the set targets. The communication plan of the Balanced Scorecard contains workshops, training sessions, career development plans and the communication of how LCG aligns the employees’ personal objectives to LCG’s strategic goals. Another component of a successful BSC implementation is sustained management commitment to drive the necessary behavioral changes within the company (Acumen Integrat, 2009: online).
42 overhead nor personnel costs. The professional use of SAP Crystal Dashboard Design will cost the company depending on the version between approximately €470 and €1800 (SAP Online Store, 2012: online). Moreover, the training and maintenance costs have to be calculated.
V) CONCLUSION
44
REFERENCE LIST
Andrews, Kenneth R. and Edmund P. Learned. 1966. Business Policy, Text and Cases. Homewood: Irvin.
Bloomfield, Charles. 2002. Bringing the Balanced Scorecard to Life: The Microsoft Balanced Scorecard Framework. Redmond: Microsoft Corporation.
Dess, Gregory G. and G.T. Lumpkin. 2004. Strategic Management. Text & Cases. New York: McGraw-Hill/Irwin.
Gamroth, Marcel. 2010. Die Balanced Scorecard im Kundenmanagement des Business-to-Business Geschäfts: Eine prozess- und motivationspsychologisch orientierte Darstellung. Berlin: Books-on-Demand.
Hofstede, Geert H. 2001. Culture’s consequences: Comparing values, behaviors, institutions, and organizations across nations. Thousand Oaks: Sage Publications, Inc. INSEAD. 2011. INSEAD Consulting Club Handbook 2011. Fontainebleau: INSEAD Consulting Club.
Kaplan, Robert S., and David P. Norton. 1992. “The Balanced Scorecard – Measures That Drive Performance”, Harvard Business Review, January-February: 71-147.
Kaplan, Robert S. and David P. Norton. 1996. The Balanced Scorecard: Translating Strategy into Action. Boston: Harvard Business School Press.
Kaplan, Robert S. and David P. Norton. 2000a. “Having trouble with your strategy? Then Map it”, Harvard Business Review, September-October: 167-176.
Kaplan, Robert S. and David P. Norton. 2000b. The Strategy-Focused Organization: How Balanced Scorecard Companies Thrive in the New Business Environment. Boston: Harvard Business School Press.
Kaplan, Robert S. and David P. Norton. 2004. Strategy Maps. Converting Intangible Assets Into Tangible Outcomes. Boston: Harvard Business School Press.
Kaplan, Robert S. and David P. Norton. 2006. Alignment. Using the Balanced Scorecard to Create Corporate Synergies. Boston: Harvard Business School Press. Kaplan, Robert S. and David P. Norton. 2008. The Execution Premium: Linking Strategy to Operations for Competitive Advantage. Boston: Harvard Business School Press.
45 Reichheld, Frederick F. 2003. “The One Number You Need to Grow”, Harvard Business Review, December 1 2003: 46-54.
Schwab, Klaus. 2012. The Global Competitiveness Report 2012-2013. Geneva: World Economic Forum.
Willcocks, Leslie and Stephanie Lester. 1996. “Beyond the IT Productivity Paradox”, European Management Journal, 14(3): 279-290.
Online Resources:
Aicep Portugal Global. 2012. Portugal – Country Profile.
http://www.portugalglobal.pt/EN/Biblioteca/Pages/Detalhe.aspx?documentId={40F8AF3 8-6235-49BD-9A48-A78A80A176A0 (accessed December 3, 2012).
Bain & Company. 2011. Management Tools & Trends. 2011.
http://www.bain.com/Images/BAIN_BRIEF_Management_Tools.pdf (accessed January 3, 2013).
Batchelor, George. 2011. “’Up or out’ is part of industry culture. “ Financial Times. April 20, 2011. http://www.ft.com/intl/cms/s/0/d42434b2-6b69-11e0-a53e
00144feab49a.html#axzz2GvktUbcI (accessed January 4, 2013).
BSC Designer. 2012. Various BSC-based models. http://www.bscdesigner.com/various-bsc-based-models.htm (accessed December 3, 2012).
Central Intelligence Agency (CIA). The World Factbook.
https://www.cia.gov/library/publications/the-world-factbook/geos/po.html (accessed December 5, 2012).
Lisbon Consulting Group. 2012a. LCG’s Mission. http://www.lisboncg.com/en/about-lcg/who-we-are/ (accessed December 5, 2012).
Lisbon Consulting Group. 2012b. LCG’s Values. http://www.lisboncg.com/en/about-lcg/values/ (accessed December 5, 2012).
Martin, Kevin P. Jr. 2012. Lisbon: The Rise of the entrepreneurial spirit. Online:
http://www.boston.com/business/blogs/global-business-hub/2012/10/lisbon_rise_of.html
(accessed December 5, 2012).
SAP Online Store. 2012. Crystal Dashboard Design.
http://store.businessobjects.com/store/bobjemea/DisplayHomePage/Locale.de_DE/Curren cy.EUR?resid=UDAYqgoHAtQAAB6CbUsAAAAy&rests=1357288375886 (accessed January 1, 2013).
Acumen Integrat. 2009. Balanced Scorecard Implementation in SMEs: From Theory to Praxis.
46