UNIVERSIDADE DA BEIRA INTERIOR
Ciências
Biosynthesis optimization of STEAP1 protein in
Pichia pastoris X33 MUT
+
Margarida Maria Antunes dos Santos
Dissertação para obtenção do Grau de Mestre em
Bioquímica
(2º ciclo de estudos)
Orientador: Prof. Doutor Cláudio Jorge Maia Batista
Co-orientador: Prof Doutor Luís António Paulino Passarinha
iii Articles partially submitted:
Barroca-Ferreira J, Pais JP, Santos MM, Gonçalves AM, Gomes IM, Sousa I, Rocha SM, Passarinha LA, Maia CJ, Targeting STEAP1 protein in human cancer: current trends and future challenges, Current Cancer Drug Target.
v
Acknowledgements
Firstly, I would like to thank my supervisors, Professor Cláudio Maia and Professor Luís Passarinha for the opportunity to let me develop this project and for helping me throughout this year, advising and encouraging me.
To my colleagues at CICS, a big thank you for all the help and support they gave me throughout the year, especially to Margarida Gonçalves for guiding me in the first months, for her patience, help, and encouragement.
To my friends and colleagues Inês, Adriana, Vera, and Mariana, that have been with me for the past five years, a big, and rare, hug. Thank you for all the times you have helped me see the bright side of things, even when they seemed dark. Thank you for sharing your experiences with me, for your friendship and kind words. A special thank you to Inês for her company and patience throughout the past five years.
My forever gratitude goes to my parents, who allowed me to pursue my dream. Thank you for believing in me when I did not, for the endless phone calls filled with incentives, kind words and for all the love, you gave me. I can never repay what you have done for me.
vii
Resumo
O cancro da próstata é o tipo de cancro mais comum entre os homens com mais de 50 anos nos países ocidentais. As terapias atuais disponíveis são, em alguns casos, limitadas e ineficazes. Por isso, é necessário desenvolver terapias alternativas que possam combater de forma mais específica e eficaz as células tumorais. A proteína Six Transmembrane Epithelial Antigen of the Prostate 1 (STEAP1) é formada por seis domínios transmembranares, localizada nas junções célula-célula do epitélio prostático. Diversos estudos indicam que a STEAP1 se encontra sobre-expressa no cancro da próstata mas em tecidos normais, a sua expressão é mínima. A sua localização e estrutura celular sugere que esta proteína pode funcionar como um canal iónico. Logo, a expressão diferencial da STEAP1 entre tecidos, associada com a sua localização, sugerem o seu uso como possível alvo terapêutico do cancro. Para delinear novas formas de terapia usando como alvo a STEAP1, é necessário obter-se elevados níveis de proteína purificada. Portanto, o objetivo deste estudo é produzir a proteína STEAP1 em Pichia pastoris X33. A utilização de um sistema eucariótico irá permitir o enovelamento correto da proteína, visto a Pichia pastoris ser capaz de realizar reações pós-tradução. Os nossos resultados demonstraram que a proteína alvo é eficazmente produzida em
Pichia pastoris e foi identificada na fração centrifugada a 16000g. Análise por Western blot revela a
proteína com o peso molecular correto (~40 kDa). As melhores condições para a produção da proteína são um processo de fermentação de 6 horas em meio BMMH com 1,25% de metanol e 6% de DMSO a 30ºC, 250 rpm. O passo de solubilização deve ser efetuado utilizando SDS numa concentração de 1-3%.
Palavras-chave
ix
Resumo alargado
O cancro da próstata é o tipo de cancro mais comum entre os homens com mais de 50 anos nos países ocidentais e a quinta causa de morte no mundo. As terapias atuais disponíveis são, em alguns casos, limitadas e ineficazes. Por isso, é necessário desenvolver terapias alternativas que possam combater de forma mais específica e eficaz as células tumorais. A proteína Six Transmembrane Epithelial Antigen of the Prostate 1 (STEAP1) é formada por seis domínios transmembranares, localizada nas junções célula-célula do epitélio prostático. Diversos estudos indicam que a STEAP1 se encontra sobre-expressa no cancro da próstata mas em tecidos normais, a sua expressão é mínima. A sua localização na superfície da célula e estrutura sugere que pode funcionar como um canal iónico para pequenas moléculas tais como cálcio e potássio. Logo, a expressão diferencial da STEAP1 entre tecidos normais e cancerígenos, associada com a sua localização, sugerem o seu uso como possível alvo terapêutico do cancro. Para delinear novas formas de terapia usando como alvo a STEAP1, é necessário obter-se elevados níveis de proteína purificada. Portanto, o objetivo deste estudo é produzir a proteína STEAP1 em Pichia pastoris X33 Mut+. A utilização de um sistema eucariótico irá permitir o enovelamento correto da proteína, visto a Pichia pastoris ser capaz de realizar reações pós tradução, como a glicosilação. O objetivo inicial foi a construção de um vetor de expressão, usando o plasmídeo pPICZαB. Neste foi colocado o gene da STEAP1 com uma cauda de 6 histidinas no fim para facilitar a purificação numa fase posterior. De seguida, o vetor foi inserido no genoma da Pichia pastoris e finalmente, foram testadas diferentes condições como temperatura, concentração de metanol e tempo de indução para determinar quais as melhores para a sua produção. Tendo em conta que a estirpe utilizada era Mut+, esta consegue produzir a proteína alvo utilizando o promotor AOX, que é ativado pela presença de metanol no meio. Então, foi realizado inicialmente uma pré-fermentação com glicerol como fonte de carbono para promover o crescimento celular. De seguida, foi realizada uma fermentação com metanol para induzir a produção da proteína utilizando o promotor AOX. Os nossos resultados demonstraram que a proteína alvo é eficazmente produzida em Pichia pastoris no peso correto (~40 kDa) e foi identificada na fração do pellet, obtido após centrifugação a 16000g. Das três concentrações de metanol testadas (0,75%, 1% e 1,25%), a que levou à produção de uma maior quantidade de proteína foi a de 1,25%. O tempo de fermentação ideal foi de 6 horas, uma vez que os resultados demonstraram que a proteína só era produzida imediatamente após indução com metanol. Após este intervalo de tempo a proteína era degradada pelo microrganismo e só seria produzida após nova indução, mas em menor quantidade que na indução inicial. Também foram testadas duas Temperaturas de fermentação diferentes (25 e 30ºC), das quais a de 30ºC foi a mais eficaz, obtendo-se assim maior quantidade de proteína. A utilização do chaperone DMSO foi testado a duas concentrações (3 e 6%) e a que obteve melhores resultados foi a concentração de 6%, uma vez que a 3% ocorreu degradação da proteína.
x Finalmente foram testados diferentes detergentes iónicos e não-iónicos para a solubilização, e a várias concentrações, sendo que a mais eficaz foi a utilização de SDS num intervalo de concentração de 1-3%. No entanto a otimização destes passos é vital e necessária, visto a solubilização não ser completa e ainda não foi testada nenhuma técnica de purificação da proteína alvo.
xii
Abstract
Prostate cancer (PCa) is the most common type of cancer in men over the age of 50 in Western countries. The current therapies available are, in many cases, limited and ineffective. Therefore, it is necessary to develop alternative therapies, that can fight specifically and effectively cancer cells. The Six Transmembrane Epithelial Antigen of Prostate 1 (STEAP1) is a protein with six transmembrane domains located in the cell-cell junctions of the secretory epithelium of the prostate. Some studies have reported it as overexpressed in PCa but in normal tissues, its expression is minimal. The structure and cell location of STEAP1 suggest that it may function as a channel for ions. Moreover, it was demonstrated that STEAP1 overexpression induces proliferation of cancer cells. The differential expression of STEAP1 in tissues, associated with its localization, suggests its potential use as a target for cancer therapy. In order to delineate novel strategies for targeting STEAP1 protein, it is necessary to obtain high levels of purified protein. Therefore, the aim of this study is to produce STEAP1 protein in Pichia pastoris X33 Mut+. The use of a eukaryotic system will allow the correct folding of the protein since Pichia pastoris is able to perform post-translation modifications. Our results showed that the target protein is being produced by Pichia pastoris strain and it was identified in the pellet fraction centrifuged at 16000g. Western blot analysis revealed the protein in the correct molecular weight (~ 40 kDa) The best conditions for protein production is a 6 hours fermentation process in BMMH medium with 1.25% methanol and 6% DMSO at 30ºC, 250rpm. The solubilization process should be done using SDS in a concentration of 1-3%.
Keywords
xiv
INDEX
Chapter I- Introduction ... 1
1. Human prostate ... 1
1.1. Anatomy and Physiology ... 1
1.2. Prostate cancer ... 3
1.2.1 Epidemiology and Risk Factors ... 4
1.2.2. Diagnosis and Treatment ... 5
1.2.3. Putative Immunotherapeutic Target ... 6
2. Human six transmembrane epithelial antigen of prostate proteins ... 7
2.1. STEAP1 ... 8
2.1.1. Structure, Function, and Expression ... 8
2.1.2. STEAP1 as immunotherapeutic target ... 10
3. Production and purification of transmembrane proteins ... 10
3.1. Prokaryotic Systems ... 11
3.2. Eukaryotic Systems ... 11
3.2.1. Pichia pastoris as a Bioreactor ... 12
Chapter II- Aims ... 16
Chapter III- Materials and Methods ... 17
1. Materials ... 17
2. Strains, plasmids, and media ... 17
3. Construction of the pPICZαB-STEAP1_6His expression vector ... 18
4. Pichia pastoris X33 transformation ... 19
xv
6. Protein Recovery and Solubilization ... 21
7. Agarose gel electrophoresis ... 21
8. Total protein quantification ... 22
9. Western Blot Analysis ... 23
Chapter IV- Results and Discussion ... 24
1. Construction of the expression vector pPICZαB-STEAP1_6His ... 24
2. Pichia pastoris X33 transformation ... 25
3. Biosynthesis of STEAP1 in Pichia pastoris ... 27
4. Protein Recovery and Solubilization ... 33
Chapter V- Conclusion and Future Perspectives ... 35
xvii
List of Figures
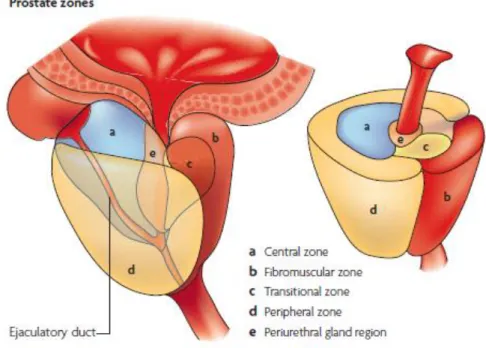
Figure 1: Prostate’s anatomy with differentiated zones (Adapted from (8)).
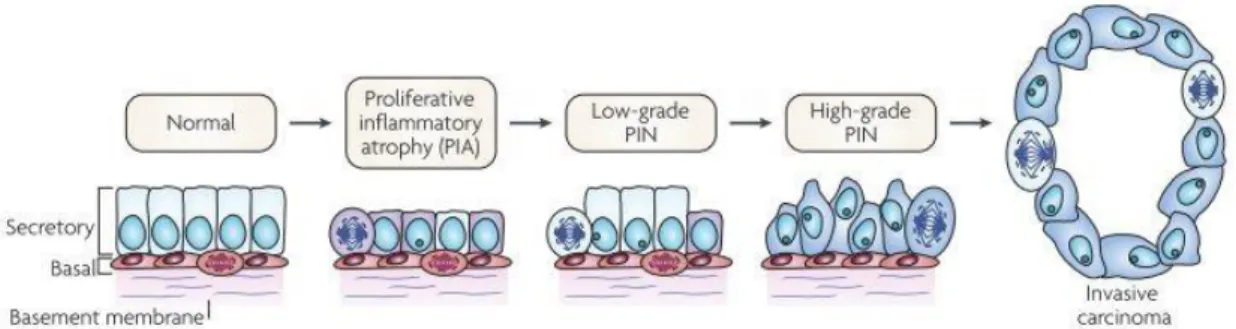
Figure 2: Stages of prostatic cancer (Adapted from (8)).
Figure 3: Schematic representation of the STEAP1 structure.
Figure 4: Pichia pastoris’ methanol pathway. AOX: alcohol oxidase; CAT: catalase; DHAS: dihydroxyacetone synthase; DHA: dihydroxyacetone; GAP: Glyceraldehyde 3-phosphate; DAK: dihydroxyacetone kinase; DHAP: dihydroxyacetone phosphate; FAB: fructose 1,6-bisphosphate aldolase: fructose 1,6-bisphosphatase; FLD: formaldehyde dehydrogenase; FGH: S-formylglutathione hydrolase; FDH: formate dehydrogenase (Adapted from (92–94)).
Figure 5: The different phenotypes of Pichia pastoris regarding its presence/absence of the two AOX genes (Adapted from (91, 97)).
Figure 6: pPICZαB expression vector (Retrieved from Invitrogen, EasySelect™ Pichia Expression Kit no. 25, 2010).
Figure 7: Schematics of gene insertion into Pichia pastoris’ genome.
Figure 8: A- BSA calibration curve with Lysis Buffer; B- BSA calibration curve with Lysis Buffer (150 mM NaCl, 50 mM Tris, 1 mM MgCl2, pH 7.8) and Triton X-100 1%; C- BSA calibration curve with Lysis Buffer with and urea 6M; D- BSA calibration curve with Lysis buffer and Tween 20 1%; E- BSA calibration curve with Lysis buffer and SDS 1%; F- BSA calibration curve with Lysis buffer and Tween 80 1%.
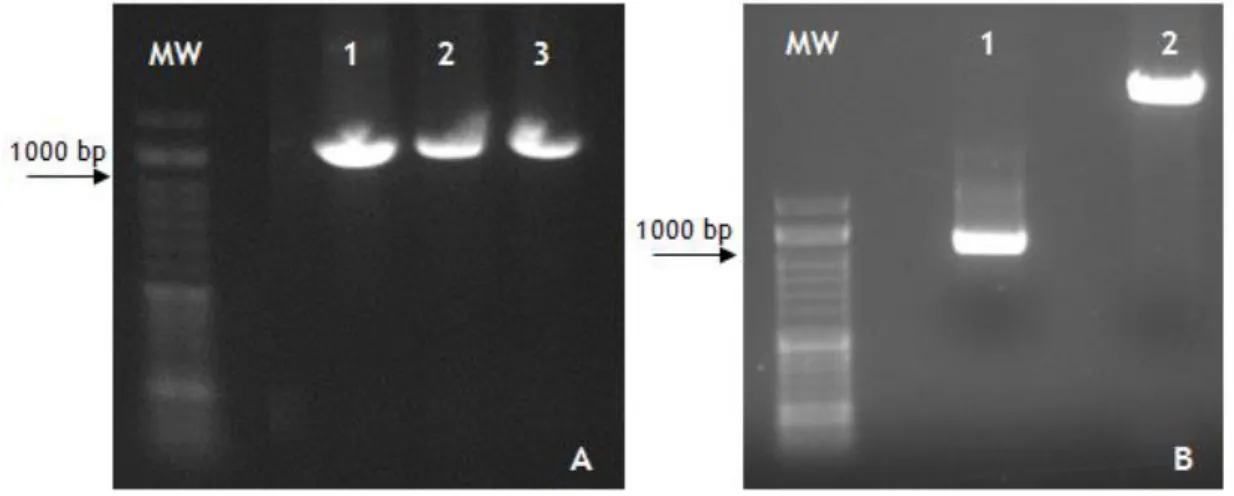
Figure 9: Agarose Gel 1%. A: M- NZYDNA ladder VI marker; 1- Annealing at 60ºC; 2- Annealing at 62ºC; 3- Annealing at 65ºC; B: MW- NZYDNA ladder VI marker; 1- Digested PCR products; 2- Digested pICZαB vector.
Figure 10: Agarose gel 1%; 1-4: reaction 1-4; 5- reaction 8.
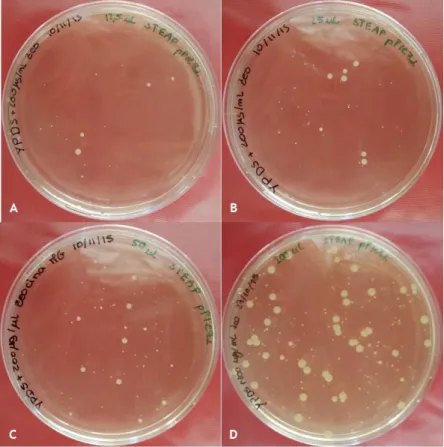
Figure 11: YPD plates with colonies with Pichia pastoris transformed with pPICZαB-STEAP1_6His expression vector; A- 12.5 µL of transformed cells; B- 25 µL of transformed cells; C- 50 µL of transformed cells; D- 100 µL of transformed cells.
xviii Figure 12: Agarose gel 1%; 1- PCR amplification with AOX1 primers; 2- PCR amplification with STEAP1 primers; 3- PCR amplification with AOX1 primers forward and STEAP1 primer reverse.
Figure 13: Western blot analysis of pellets obtained from untransformed Pichia pastoris X33.
Figure 14: Pichia pastoris X33 with vector pPICZalphaB+STEAP1_6His growth profile.
Figure 15: Western blot analysis of STEAP1 production in P16000g (A), S16000g (B) and extracellular medium (C) over 120h of fermentation with samples taken every 12h and methanol induction every 24h and fermentation without methanol induction (D) in P16000g (1), S16000g (2) and extracellular medium (3) at 120h.
Figure 16: Western blot analysis of STEAP1 production in P16000g (A) and S16000g (B) over 60h of fermentation with samples taken every 6h and methanol induction every 24h.
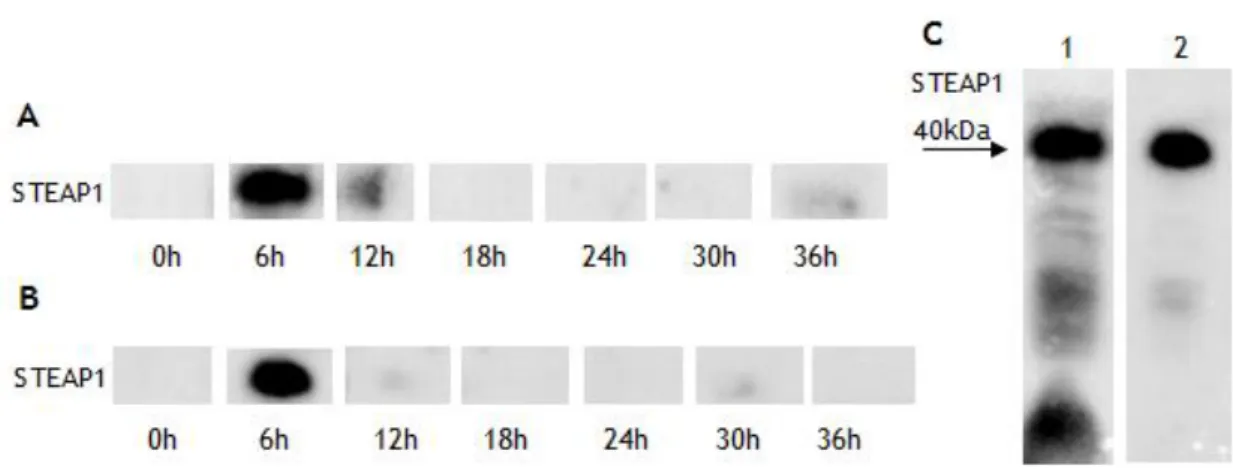
Figure 17: Western blot analysis of STEAP1 production in P16000g over 36h of fermentation with samples taken every 6h, supplemented with methanol every 24h and 3% (A) and 6% (B) DMSO. C- Detail of the 6h sample band for 3% (A) and 6% (B) DMSO.
Figure 18: Western blot analysis of STEAP1 production in P16000g over 36h of fermentation with samples taken every 6h supplemented with methanol every 6h.
Figure 19: Western blot analysis of STEAP1 production in P16000g over 24h of fermentation supplemented with methanol 0.75% (A), 1% (B) and 1.25% (C) every 6h; D- Detail of the 6h sample band for 1% (B) and 1.25% (C) methanol induction.
Figure 20: Western blot analysis of STEAP1 production in P16000g over 18h of fermentation supplemented with methanol 1% (A) and 1.25% (B) every 6h at 25ºC.
Figure 21: Western blot analysis of STEAP1 production in P16000g over 18h of fermentation supplemented with methanol 1.25% every 6h at 25ºC (A) and 30ºC (B).
Figure 22: Western blot analysis of STEAP1 production in P16000g over 6h of fermentation with methanol 1.25% at 30ºC and solubilized with different detergents.
Figure 23: Western blot analysis of STEAP1 production in P16000g over 6h of fermentation with methanol 1.25% at 30ºC and solubilized with different concentrations of SDS (A), Triton (B) and lysis buffer (C).
xx
List of Tables
xxii
List of Abbreviations
Ab Antibodies
ACRATA Apoptosis, cancer and redox associated transmembrane domain
AOX Alcohol oxidase
AR Androgen receptor
ARE Androgen Response Elements BMGH Buffered Minimal Glycerol BMMH Buffered Minimal Methanol BPH Benign Nodular Hyperplasia BSA Bovine Serum Albumin
CAT Catalase
DHAS Dihydroxyacetone synthase DHT Dihydrotestosterone DMSO Dimethyl sulfoxide DNA Deoxyribonucleic acid DNase Deoxyribonuclease I
E. coli Escherichia coli
ES Ewing’s sarcoma
FSH Follicle-stimulating hormone gDNA genomic Deoxyribonucleic acid GnRH Gonadotropin-releasing hormone LAB Lactic acid bacteria
LH Luteinizing hormone
LSLB Low Salt Luria-Bertani
MCT Monocarboxylate Transporter mRNA messenger Ribonucleic acid
xxiii
PCa Prostate cancer
PCR Polymerase Chain Reaction PIN Prostatic intraepithelial neoplasia PSA Prostate specific antigen
PSCA Prostate stem cell antigen
PSMA Prostate-specific membrane antigen SDS Sodium Dodecyl Sulfate
STEAP Six-Transmembrane Epithelial Antigen of Prostate TAA Tumor-associated antigens
1
CHAPTER I- INTRODUCTION
1. Human prostate
1.1. Anatomy and Physiology
The prostate is a gland located in the pelvis, below the bladder, surrounding the upper part of the urethra. It is organized in lobules and surrounded by fibromuscular stroma (1, 2). Its dimensions are 3 cm high by 4 cm wide by 2 cm deep, about the size of a walnut (3). The prostate gland secretes an alkaline fluid that is used to suspend the ejaculated sperm, along with the fluid from the seminal vesicles and bulbourethral glands. This alkaline fluid helps to maintain sperm motility (3). During ejaculation, the smooth muscle of the prostate and other tissues contract, expelling the fluid into the urethra, forming the semen (3).
According to McNeal, the prostate gland can be divided into three main regions: a central zone, a peripheral zone, and a transition zone, as observed in Figure 1 (4–6). The central zone is a “vertical wedge of glandular tissue” which surrounds the ejaculatory ducts and comprises approximately 25% of the prostate and surrounds the ejaculatory ducts (4–7). The peripheral zone is the majority of the prostate’s volume, about 65%. It is comprised of secretory epithelial cells and surrounded by smooth muscle that helps the release of prostatic secretions into the urethra at the time of ejaculation (3, 6). This zone is much more susceptible to prostatitis and adenocarcinomas, which can arise from peripheral ducts and acini (4, 5). The transition zone is comprised of two lobules located on the sides of the urethra and contains coarse and compact stroma cells. This zone comprises less than 5% of the prostate volume and has been associated with the appearance of glandular nodules, characteristics of Benign Prostatic Hyperplasia (BPH) (6, 7). Two more zones can be identified: the anterior fibromuscular stroma and the periurethral zone (8). The periurethral zone is comprised by the urethral glands, which are located close to the proximal urethra and the proximal urethra sphincter. The anterior fibromuscular stroma constitutes <5% of the mass of the prostate gland. It is comprised entirely of non-glandular tissue and its function is still unclear (9).
The epithelium of the prostate gland is composed of the secretory and basal cells. Secretory cells, also known as luminal cells, express, among others, prostate specific antigen (PSA) and the androgen receptor (AR). These cells do require androgens to differentiate (10, 11). Basal cells are multipotent and can generate all epithelial lineages of the prostate. A close observation of these cells can help to differentiate adenocarcinomas from benign conditions, since in the first case, these cells are absent. In addition, in normal conditions, basal cells do not express PSA. These two types of cells are interpolated by neuroendocrine cells in some
2 areas (5, 10, 11). Neuroendocrine cells are present in all zones, being more abundant in the periurethral and ductal regions. Although its function remains unclear, it has been suggested that they may influence growth or differentiation of surrounding epithelial cells. These cells express PSA but not AR(5, 10, 11).
Figure 1: Prostate’s anatomy with differentiated zones (Adapted from (8)).
The prostate is highly dependent on steroid hormones, such as androgens, for maintaining its secreting function and integrity (12). In normal conditions, the Gonadotropin-releasing hormone is secreted by the hypothalamus, which leads to the secretion of Follicle-stimulating hormone (FSH) and luteinizing hormone (LH) by the Anterior pituitary (2, 13). FSH’s primary function is to induce spermatogenesis and LH is to stimulate the production of testosterone in Leydig cells (2, 13). Testosterone acts on the prostate gland and can be converted into dihydrotestosterone (DHT) by the enzyme 5α-reductase type 2, present in some cells of the prostate. DTH can then activate the AR present in the secretory cells, as previously mentioned (2, 14, 15). Testosterone can also bind to AR, but with lower affinity when compared to DHT (12, 14, 15). This receptor is located in the cytoplasm, bound to Heat Shock Proteins (16–18). Once DHT binds to the receptor, there is a change in its conformation, allowing the AR to translocate into the nucleus. Then, AR-ligand binds to specific recognition DNA sequences, known as the androgen response elements (AREs) (16, 18). These AREs are localized in the promoter region of androgen-regulated genes, leading to regulation of genes responsible for DNA synthesis, cellular proliferation, differentiation, among others (14, 16, 17).
3
1.2. Prostate cancer
As it was previously mentioned, the peripheral zone of the prostate is the most common site for prostate adenocarcinoma, and the transitional zone for BPH (5). Prostate cancer (PCa) is regulated by androgens, such as BPH, although the latter can very rarely progress to carcinoma.
PCa can be developed due to the accumulation of genetic and epigenetic changes, leading to the inactivation of tumor-suppressor and caretaker genes and the activation of oncogenes. The triggering factor for its appearance is still unknown (8). However, several studies have suggested that infections, hormonal alterations, and physical traumas can create inflammation and proliferation of epithelial cells (8, 19–21). Changes in gene expression may further increase cell proliferation and morphological alterations leading to the appearance of prostatic intraepithelial neoplasia (PIN) lesions, as observed in Figure 2 (8). In fact, it has been suggested that PIN is a potential precursor of PCa. PIN lesions are characterized by basal cell disruption, the proliferation of the luminal epithelium, irregular cell spacing and nuclear and nucleolar enlargement (5, 22, 23). PIN is categorized into low grade and high grade, being the first less severe and the second the precursor of PCa (5, 22). The continuous tumor progression can lead to the disruption of the endothelial lining of blood vessels and cancer cells can enter the bloodstream and colonize other organs, leading to metastasis (8, 24).
Figure 2: Stages of prostatic cancer (Adapted from (8)).
Since the prostate is a hormone-dependent tissue, the initial phases of PCa seem to be dependent of androgens (17). In several cases, the AR is overexpressed in PCa, leading to an increase in the expression of genes responsible for cell proliferation, and consequently the progression of PCa (17). In more advanced cases, especially when cancer becomes castration-resistant, several mutations and/or an increase of AR gene copy number have been identified (10). These molecular changes may turn the PCa cells more sensitive to androgens or increase the recruitment of co-activator proteins (10). In addition, it has been described that AR may be activated by other molecules, such as insulin growth factor, which can be found in high concentration in prostate cancer patients (24).
4 1.2.1 Epidemiology and Risk Factors
PCa is the most common type of cancer in men over the age of 50 in Western countries and the fifth leading cause of death in the world (25, 26). In Portugal, prostate cancer is the main cancer diagnosed in men and the third cause of death (25–27).
Risk factors for prostate cancer can be divided into two categories: endogenous and exogenous factors. Regarding endogenous factors, we can have family history, hormones, race, age, and oxidative stress. In exogenous factors, there is diet, environmental agents, and occupation (21).
Family history can be associated with high risk of PCa. Men who have a first-degree relative with prostate cancer will have a higher risk of having cancer. PCa can be classified as sporadic, familial or hereditary. Sporadic cases occur when no other case of cancer as appeared in the subject’s family. Familial cases occur when one or more first-degree members are affected. Hereditary cases, being only 5-10% of cases, are considered when a pattern of cancer distribution is found within the subject’s family. Some genes seem to be responsible for higher risk of prostate cancer when mutated, such as genes encoding proteins responsible for defending against inflammation and oxidative stress (21, 28, 29).
Androgens, such as testosterone and dihydrotestosterone, are responsible for the development, maturation, and maintenance of the prostate, as well as proliferation and differentiation in the luminal epithelium. In prostate cancer, some studies suggest that high levels of testosterone can increase the risk of developing it, although results have been inconsistent (19, 21, 29).
Prostate cancer has a very low chance of being diagnosed in men under 50 years and a higher chance in men over 65 years. The lowest incident rates of prostate cancer are found in Asia and the highest are among African-American men (19, 25). However, studies have shown that when people from Asian countries move to the USA, their risks of developing cancer increases, suggesting that other external factors may be involved, such as lifestyle and environmental factors (19, 29, 30).
A diet with high content of animal fat, such as red meat, has been linked to a higher risk of prostate cancer. The consumption of food with high-fat content seems to result in alteration of hormone pathways and increase of oxidative stress with potential carcinogenic effects. Vitamin D seems to have positive implications in prostate cancer. It has anti-proliferative and
5 pro-apoptotic effects and inhibits tumor growth. Its deficiency may be a risk for prostate cancer development (19, 21, 29, 31).
Some environmental agents, such as the endocrine disrupting chemicals and pesticides can alter hormone activity and affect reproductive organs and carcinogenesis (21).
An infection-associated inflammation and hyperproliferation can contribute to the development of prostate cancer. An infectious agent can induce an inflammatory process and lead to cellular alterations in the prostate. Also, sexually transmitted diseases and prostatitis are a risk factor for prostate cancer (8, 19, 29). Other factors such as obesity, smoking, alcohol ingestion, and certain professions can increase the risk of prostate cancer (19, 21, 25, 29, 30).
1.2.2. Diagnosis and Treatment
Diagnosis of prostate cancer can be carried out by measuring serum PSA, tissue biopsies and digital rectal examination (32).
The Gleason grading system is the preferred method to characterize prostate cancer. It was created by Dr. Donald F Gleason and is based on the histological pattern of carcinoma cells in the prostatic tissue. There are five basic grade patterns that can be used to obtain a histological score between 2 and 10. A primary and secondary pattern are characterized by the grade patterns and added to obtain the histological score. The primary pattern is the predominant one in the tissue and the secondary pattern is the second most common. The patterns differ in cell arrangement and shape, stromal invasion and gland size. Increasing Gleason grade is directly related to tumor size and invasion (33, 34). Other systems were created, such as the Tumor, Node and Metastasis system for the clinical stage with grading for tumor (T), node (N) and metastasis (M) (35).
As it was previously described, PSA is a serine protease secreted by the prostatic epithelium and the epithelial lining of the periurethral glands. It is involved in the liquefaction of seminal fluids. It is measured in the serum and detected by immunoassay (32, 36, 37). Its levels correlate with disease aggressiveness (37). However, PSA levels can be increased in BPH and prostatitis and lower in PCa. This leads to high chances of misdiagnosed and unnecessary biopsies. Some alternatives have arisen in Prostate cancer diagnosis (36, 37). PSA density takes into consideration the size of the prostate and can distinguish between BPH and prostate cancer. PSA velocity analyses the alterations in PSA levels over time. PSA velocity can correlate with cancer aggressiveness (37).
6 Regarding the treatment of prostate cancer, it depends on the age of the patient and stage of cancer (38, 39). In man with low-Grade Gleason score, the main action is simply active surveillance with measurements of serum PSA and prostate biopsies. In aggressive cancers, the most common treatments are androgen deprivation therapy, radiation, prostatectomy or a combination of both (40, 41). Many of these forms of treatment are aggressive and can diminish the quality of life of the patients. (42). Finding treatments with minimal toxicity is the goal and some can go through targeting tumor-associated antigens (TAA). These proteins are specific to cancer and that are either not expressed or minimally expressed in normal tissues and essential organs.
1.2.3. Putative Immunotherapeutic Target
As it was previously mentioned, current therapies for PCa are limited and induce unwanted side effects. Radiation therapy can destroy healthy cells and patients that undergo surgical castration can still develop cancer afterward, where previous treatments are ineffective. Therefore, it is necessary to develop new forms of treatment targeting specifically cancer cells. The overexpression of some membrane proteins in cancerous tissue may be a new way, as well as proteins involved in mechanisms that cancer cells use (42, 43).
Prostate-specific membrane antigen (PSMA) is a type II integral membrane glycoprotein, which is overexpressed in PCa cells. Some studies have shown a good correlation between PSMA level and Gleason score, and it has also been evaluated as a target for therapy with monoclonal antibodies (Ab) conjugated with toxins or radioisotopes (36, 44). A study with Ab against PSMA combined with an immunotoxin lead to its accumulation in LNCaP cells, leading to apoptosis of the cells overexpressing PSMA, but not in PSMA-negative PCa cells (45).
Prostate stem cell antigen (PSCA) is a glycoprotein expressed on the cell surface of prostate basal cells. Studies show that this protein increases with PCa stage and progression, and there is a good correlation between PSCA level and Gleason score (46, 47). At least two studies showed that targeting PSCA with specific Ab inhibits PCa cell growth (48, 49).
Six-transmembrane epithelial antigen of prostate 1 (STEAP1) is a transmembrane protein overexpressed in the epithelial cells of the prostate. It was demonstrated that STEAP1 silencing mediated by siRNA showed a decrease in proliferation of Ewing tumor cells (50). Other studies with Ab blockage of STEAP1 showed similar results in prostate and bladder tumor cells (51). This protein is considered a promising immunotherapeutic target since it meets the criteria for TAA, being overexpressed in cancer cells but not in normal tissues. In
7 addition, its location on the cell’s surface facilitates recognition and can lead to a localized treatment, without damaging other tissues.
In cases of castration–resistant PCa, treatments to alter cancer cells’ energy metabolism is a new approach that can be used. It is very well documented that cancer cells prefer glycolysis to obtain its energy instead of oxidative phosphorylation in Krebs cycle (52). Therefore, large amounts of lactic acid are produced, creating an acidic environment that facilitates tissue invasion and metastasis (53, 54). The Monocarboxylate Transporter (MCT) family is involved in the transport of lactic acid. In fact, MCT4 is overexpressed in multiple cancer types, and it is associated with poor prognosis of PCa (55, 56). The treatment of PCa cells with antisense oligonucleotides targeting MCT4 revealed a decrease in lactic acid secretion and inhibition of cell growth (55).
2. Human six transmembrane epithelial antigen of prostate
proteins
The six-transmembrane epithelial antigen of prostate (STEAP) family is comprised of four proteins, STEAP 1 to 4. STEAPs are expressed in many different tissues and were found to be overexpressed in many cancer cell lines. All these proteins share a six transmembrane domain and intracellular N- and C- termini but differ in cellular functions and expression patterns. This family of proteins seems to contribute in maintaining metal homeostasis, oxidative stress response, cell-cell communication, proliferation, invasion, apoptosis, among others (57–59). These proteins share similarities in the C terminus with the transmembrane domains of yeast FRE metalloreductases. The alignment of STEAP1-4 with Saccharomyces cerevisiae FRE1 domain shows similarities in a heme-binding domain, which was referred as the Apoptosis, Cancer and Redox Associated Transmembrane domain (ACRATA), and two conserved histidine residues. The FRE1 domain contains four histidine residues, creating two heme-binding domains. Since STEAP only has two, it only binds one heme domain. These residues are important because they allow the correct alignment of the heme group, facilitating electron transport through the domain (58–61).
The N-terminal domain also exhibits homology with the archaeal and bacterial F420H2: NADP+ oxidoreductase (FNO) binding proteins in STEAP2-4 (59). This domain contains the Rossman-fold (GXGXXG/A motif), which allows proteins to bind to nucleotides such as NAD and a serine and arginine residues that are critical for binding to NADP+. This FNO-like domain allows the binding of flavins as electron donors to reduce iron and copper, giving them oxidoreductase activity (57, 59). The specific domains presented in the N- and C-terminals of STEAP2-4
8 promote iron reduction, and possibly copper, as well as to stimulate their uptake into cells (59).
Although these proteins share many structural aspects, their expression and cellular localization are very diverse. STEAP1 mRNA and protein are mainly expressed in prostatic tissues, but also in liver, kidneys, and breast (59, 62). STEAP2 mRNA is expressed in normal prostate, pancreas, brain and fetal liver (59). STEAP3 mRNA is highly expressed in liver and it was also found at lower levels in pancreas and bone marrow (58). STEAP4 mRNA is found in bone marrow, placenta and fetal liver (58, 59, 63).
2.1. STEAP1
2.1.1. Structure, Function, and Expression
STEAP1 was firstly identified by Hubert in 1999, who has characterized it as a “cell-surface molecule with six transmembrane domains” (64). It contains 339 amino acids and a molecular mass of approximately 40 kDa (64). Its structure is comprised of six transmembrane domains, three extracellular loops, and two intracellular loops. The C- and N- terminal are both intracellular (64). It also contains a heme-binding domain, referred as the ACRATA domain, as previously described (51, 61, 62). Unlike all the other family members, STEAP1 neither contain the FNO-like domain nor the Rossman Fold, which implied the lacking of oxidoreductase activity (59). The lack of these structures may be the reason why it does not promote iron/copper uptake or reduction (59). Although STEAP1 does not contain these domains, it does seem to have a role in iron metabolism. STEAP1 is located in endosomal compartments containing the transferrin-transferrin receptor 1 (Tf-TfR1) complex. It was also found in other endosomal compartments that specialize in iron uptake, but do not contain this complex (58, 59, 62).
9 Figure 3: Schematic representation of the STEAP1 structure.
In normal tissues, the STEAP1 expression is restricted to prostate cells, but can also be found at low levels in other tissues such as liver and kidneys (59, 64). It is mainly localized in the cell-cell junctions of the plasma membrane, suggesting its role as an ion channel or transporter protein in tight junctions, gap junctions or cell adhesion (64). Some studies have shown that an increase of Na+ channels facilitates cancer proliferation and invasiveness (65), supporting the hypothesis that STEAP1 may be involved in cancer proliferation through modulation of ion concentrations. In addition, it was demonstrated that STEAP1 is involved in intercellular communication, suggesting its implication in cancer proliferation (66). Also, studies of STEAP1 blockage with Ab showed that intercellular communication is compromised and inhibits cancer cell growth (51).
In cancer cells, STEAP1 protein is overexpressed in many cancer types. It is mainly overexpressed in PCa and at all stages (51, 67). It has also been found in lymph node and bone metastases and in the bladder, breast, lung, ovarian, colon and pancreatic cancer cell lines (51, 64, 68, 69). In Ewing’s sarcoma (ES) STEAP1 is highly expressed and is associated with increased oxidative stress. STEAP1 increases cellular ROS levels and induced the expression of redox-sensitive and proinvasive genes (50, 70). STEAP1 is also overexpressed in breast cancer cells. This led to the suggestion that this protein may be regulated by estrogens. Effectively, STEAP1 is down-regulated by dihydrotestosterone and 17-β estradiol, suggesting that STEAP1 may influence PCa progression through androgens and estrogens modulation (69).
10 2.1.2. STEAP1 as immunotherapeutic target
Although the function of STEAP1 remains to be determined, its over-expression in cancer cells, associated with its structure and cell location, support the idea of using this protein as a potential target for a variety of clinical applications that include antibody therapy, cancer-vaccine therapy, small-molecule therapy, and diagnostic imaging (51, 57, 62, 64, 71, 72). In fact, several studies have already demonstrated that STEAP1 can be used as a therapeutic target and/or biomarker. As it was previously mentioned, studies have shown that blocking STEAP1 using Ab against STEAP1 inhibited intercellular communication, resulting in tumor growth retardation (51).
Rodeberg and co-workers tested an epitope-based T-cell immunotherapy for cancer patients using a modified STEAP1 peptide. This study showed that the STEAP1 peptide was successfully capable of inducing naïve CD8+ precursors into CTLs that recognized STEAP-containing tumor cells in an MHC class I immune response (72).
In another study, it was evaluated an active immunization against either PSCA or STEAP1 using a Modified Vaccinia Ankara. The vaccination of mice against both antigens showed tumor reduction, the genitourinary tract was less pronounced and there was a reduction in the severity and extension of prostate lesions. In addition, the analysis of sections of the prostate tissue showed an increase of T-cell infiltration in the tumors of mice immunized against both antigens (73).
STEAP1 could also be used as a biomarker for prostate cancer early diagnosis, monitoring, screening, and treatment. Despite not being able to distinguish between PIN lesions and PCa, it can prevent misdiagnoses of BPH (67, 68). For these reasons, STEAP1 is a potential therapeutic target for PCa. However, in order to determine its structure and interactions with potential drugs it is vital to obtain high amounts of the purified protein.
3. Production and purification of transmembrane proteins
Proteins, in general, are synthesized in heterologous systems due to the impossibility to obtain satisfactory yields from natural sources. Some important steps in producing proteins are the selection of the ideal expression system and the appropriated growth conditions, as well as the characteristics of the target protein and downstream processes such as purification (74, 75).
11
3.1. Prokaryotic Systems
Prokaryotic organisms are the most used systems for protein production since they are easy to manipulate. However, they have several restrictions when it comes to heterologous protein production, such as post-translational modifications (74).
Escherichia coli is one of the most used prokaryotic organisms for recombinant protein
production. In addition, it has been used to produce many pharmacological and food industry components because is easy to manipulate and to grow at a reduced cost, with high yield. However, when it comes to membrane proteins expression, E. coli has several restrictions. It is unable to do certain post-translational modifications and to properly fold foreign proteins. Also, sometimes proteins can form aggregates, becoming the purification process much more difficult or even impossible (74, 76).
Lactic acid bacteria (LAB), such as Bacillus subtilis and Lactococcus lactis are classified as Generally Recognized As Safe and widely used in the food industry. Its potential for heterologous protein expression has been explored in recent years, including membrane proteins. LAB are easy and inexpensive to grow, have well-established genetic methods and vector systems, moderate proteolytic activity and efficient targeting of MPs into the cytoplasmic membrane (74, 77). However, membrane protein production in these systems is limited since it can cause major stress to the cell and impair growth (78).
3.2. Eukaryotic Systems
In eukaryotic systems, yeast species are one of the most used organisms. Similar to prokaryotic organisms, they are easy to manipulate and to grow. Also, these systems are economical and can reach high cell density and express complex proteins (75). In opposition to prokaryotic systems, they are able to perform post-translational modifications.
Saccharomyces cerevisiae was the first eukaryotic organism having its genome sequenced
(79), and its molecular and metabolic characteristics are already described (80). It has a high capacity to produce and consume ethanol, and presents a high tolerance to stress, such as low levels of oxygen. Although the Saccharomyces cerevisiae has a good capacity of glycosylation, the rate of protein secretion is low. Also, there has been cases of plasmid instability (81, 82), low protein production and hyperglycosylation of proteins (75, 83) that can alter its activity or even induce its degradation.
12
Pichia pastoris is a methylotrophic yeast, which can use methanol as its only carbon source to
obtain energy. This organism does not need a complex growth medium and is easy to cultivate. Its genome contains the alcohol oxidase 1 (AOX1) promoter for methanol metabolism. This promoter is one of the strongest and most tightly regulated eukaryotic promoter. Since Pichia pastoris uses preferentially respiration to produce energy, low levels of ethanol and acetic acid accumulate in the medium and higher cell densities can be reached. Considering that Pichia pastoris is able to secrete proteins, along with the low levels of endogenous proteins in the medium, facilitates the purification process. Parameters such as pH, aeration, and carbon source feed rate can be controlled to improve protein production. However, the usage of methanol can be a fire hazard and its monitoring during the process is difficult (75, 84, 85).
Mammalian cell expression systems have the advantage of performing complex post-translational modifications and can imitate the original environment of a human protein (74, 77, 86). In order to introduce the recombinant DNA, two strategies can be applied: transient or stable gene expression (77, 86). In the transient expression, the DNA template is transferred into the cell by insertion of a plasmid containing the gene or infection with a recombinant virus. In the stable expression, the template is incorporated into the host cell genome. This process is very time-consuming and does not yield high amounts of proteins. Therefore, this system is usually used for structural studies, where large amounts of protein are not required (77, 86). Also, in some systems, the cell produces more protein than it can properly fold it, leading to protein accumulation in structures called aggresomes (74, 77). Nonetheless, some proteins have been successfully produced in mammalian cells such as the human β2-adrenergic receptor in Chinese hamster ovary cells (87).
3.2.1. Pichia pastoris as a Bioreactor
There are many cases of protein production in Pichia pastoris, including several membrane proteins, such as human glucose transporter GLUT1 and GLUT4 (88), human mu-opioid receptor (89) and cytidine 5’-monophosphate-sialic acid transporter (90).
This organism is one of the most widely used systems for expression of heterologous proteins that require post-translational modifications. Pichia pastoris can reach high levels of expression and produce complex biomolecules that need to undergo post-translational modifications, such as proteolytic processing, disulfide bond formation, O- and N-linked glycosylation and processing of signal sequences (84, 91).
13 Another reason why this methylotrophic yeast is suited for heterologous protein expression is their easy ability to be genetically manipulated. Many techniques can be applied such as gene replacement, gene targeting, high-frequency DNA manipulation and cloning by function complementation. Since Pichia pastoris does not have native plasmids the expression of heterologous proteins can be achieved by inserting an expression vector into their chromosome. The integration can occur via gene insertion or gene replacement (84, 85, 92).
Regarding the type of metabolism to obtain energy, Pichia pastoris prefers respiration instead of fermentation (75, 91). This brings advantages since the cells during the fermentation process can accumulate ethanol to toxic levels, and consequently, to decrease the cell growth and production of recombinant proteins. Thus, a respiratory metabolism is preferable considering that the cultures may reach extremely high cell densities in a controlled environment (92).
As it was referred previously, Pichia pastoris can use methanol as its only carbon and energy source. This methanol utilization requires a metabolic pathway that involves several enzymes, such as AOX, catalase (CAT) and dihydroxyacetone synthase (DHAS) (76, 85, 93). AOX is responsible for the initial step, the oxidation of methanol to formaldehyde and hydrogen peroxide (Figure 4). The AOX is localized within the peroxisome along with CAT. This enzyme degrades hydrogen peroxide to oxygen and water. Part of the formaldehyde formed by the AOX leaves the peroxisome and is oxidized to formate and carbon dioxide by two cytoplasmic dehydrogenases. These reactions are a source of energy for cells growing on methanol. The rest of the formaldehyde is assimilated to form cellular constituents by a cyclic pathway that starts with the condensation of formaldehyde with xylulose 5-monophosphate, by DHAS, into glyceraldehyde 3-phosphate and dihydroxyacetone. These products leave the peroxisome and enter a cytoplasmic pathway that regenerates xylulose 5-monophosphate and, for every three cycles, one net molecule of glyceraldehyde 3-phosphate (76, 85, 92).
14 Figure 4: Pichia pastoris’ methanol pathway. AOX: alcohol oxidase; CAT: catalase; DHAS: dihydroxyacetone synthase; DHA: dihydroxyacetone; GAP: Glyceraldehyde 3-phosphate; DAK: dihydroxyacetone kinase; DHAP: dihydroxyacetone phosphate; FAB: fructose 1,6-bisphosphate aldolase: fructose 1,6-bisphosphatase; FLD: formaldehyde dehydrogenase; FGH: S-formylglutathione hydrolase; FDH: formate dehydrogenase (Adapted from (92–94)).
The Pichia pastoris genome contains two genes for the alcohol oxidase enzyme, AOX1 and
AOX2. The AOX1 gene is much strongly transcribed than AOX2 and, consequently, is
responsible for the majority of alcohol oxidase activity in the cell. A tight regulation and high levels of AOX1 expression turns AOX into a strong promoter for expression of heterologous proteins (85).
There are three phenotypes for Pichia pastoris: Mut+ (methanol utilization plus), MutS (methanol utilization slow) and Mut- (methanol utilization minus). The Mut+ phenotype has two functional AOX genes and can efficiently utilize methanol at the wild-type rate. The MutS phenotype has the AOX1 gene deleted and relies on the AOX2 for methanol metabolism. Strains with this phenotype grow more slowly and do not require large amounts of methanol like Mut+. The Mut- phenotype contains both genes deleted and is unable to utilize methanol. The carbon source used is usually glycerol (75, 76, 91, 92). All these strains have successfully produced heterologous proteins. Depending on the protein’s characteristics, different strains can be more successful in its production. In general, Mut+ strains are characterized by a higher growth rate than MutS and have higher production rates (95). However, the MutS strain requires less amount of methanol, which could be considered a fire hazard (96).
15 Figure 5: The different phenotypes of Pichia pastoris regarding its presence/absence of the two AOX genes (Adapted from (91, 97)).
Regarding the production of heterologous proteins, the fermentation process is usually achieved in a bioreactor with a fed-batch strategy with three or four stages (75). First, a batch stage is applied to a defined medium with glycerol as its carbon source to repress protein production and accumulate biomass (75, 85). Once glycerol is depleted in the medium, a fed-batch stage is applied with glycerol at a growth-limiting rate to further increase biomass. The final stage is a fed-batch with methanol at a slow rate, starting the induction of protein production (85, 92). Sometimes, an additional stage with a batch-methanol can be applied between the second and third stage to prepare the cells to fed-batch with a different carbon source (transition phase) (75, 85, 92).
16
CHAPTER II- AIMS
Due to STEAP1 over-expression pattern in cancer cells combined with its structure and cell location, several studies have pointed out STEAP1 as a potential therapeutic target for cancer. The clinical applications can include from treatment to management of cancer patients. In order to improve the use of STEAP1 as a therapeutic target, it should be determined its structure and interactions with potential drugs or other biological molecules. However, it is firstly required to obtain high levels of purified protein. Since STEAP1 is a protein that requires post-translational modifications, such as N-glycosylation, its production may be carried out in a eukaryotic system. Pichia pastoris is capable of performing post-translational modifications, making it an ideal system for protein production. Therefore, the present project aims to produce STEAP1 in Pichia pastoris X33. To achieve this goal, the following specific objectives were delineated:
To construct the expression vector pPICZαB-STEAP1_6His; To insert the expression vector in Pichia pastoris X33’s genome;
To determine the optimal fermentation conditions and medium components to obtain high protein production;
17
CHAPTER III- MATERIALS AND METHODS
1.
Materials
STEAP1 and AOX1 primers as well as Pst I restriction enzyme, NZYMiniprep kit, NZY First-Strand cDNA Synthesis kit, NZYDNA ladder VI marker and NZYColour protein marker II were obtained from Nzytech (Lisboa, Portugal). Not I and Sac I restriction enzymes were obtained from Takara Bio Inc. (Shiga, Japan). NucleoSpin Gel and PCR Clean-up kit were obtained from Macherey-Nagel (Düren, Germany). Wizard® Genomic DNA Purification Kit, T4 DNA Ligase and 1 µL Buffer 10x were obtained from Promega (Wisconsin, USA). BCA protein assay kit and Dream Taq Green PCR Master Mix (2x) were obtained from Thermo Fisher Scientific (Waltham, Massachusetts, EUA). Zeocin was obtained from InvivoGen (Toulouse, France). YNB, yeast extract, and Glycerol were obtained from HiMedia (Mumbai, India). Tris base, Glucose, Methanol, Dimethyl sulfoxide (DMSO), Triton X-100, Tween 20 and Tween 80 were obtained from Fisher Scientific UK (Loughborough, UK). DNAse and acid-washed glass beads were obtained from Sigma-Aldrich (St. Louis, MO, USA). SDS was obtained from AppliChem (Darmstadt, Germany). Biotin was obtained from Roche (Basileia, Swiss). European Bacteriological Agar was obtained from Laboratorios CONDA (Madrid, Spain). Peptone was obtained from Becton, Dickinson and Company (Sparks, MD).
2. Strains, plasmids, and media
The Escherichia coli TOP10 strain (Invitrogen, Carlsbad, USA) was used to produce the expression vector. The transformed cells were grown on Low Salt Luria-Bertani (LSLB) plates (1% peptone, 0.5% NaCl, 0.5% yeast extract, 1.5% European Bacteriological Agar, pH= 7.5) supplemented with 25 μg/mL zeocin at 37ºC. The Pichia pastoris X33 strain (Sigma-Aldrich, St. Louis, MO, USA) was used to produce the STEAP1 protein. The transformed cells were grown in YPD plates (1% yeast extract, 2% peptone, 2% glucose, 2% European Bacteriological Agar) supplemented with 100 µg/mL zeocin, YPDS plates (1% yeast extract, 2% peptone, 2% glucose,2% European Bacteriological Agar, 1 M sorbitol) supplemented with 100 µg/mL zeocin and YPD medium (1% yeast extract, 2% peptone, 2% glucose) supplemented with 100 µg/mL zeocin. The pre-fermentation process was performed BMGH medium ( 1 M potassium phosphate buffer pH 6.0, 1.34% yeast nitrogen base, 4x10⁻⁴ g/L biotin, 1% glycerol) and the
fermentation in BMMH medium (1 M potassium phosphate buffer pH 6.0, 1.34% yeast nitrogen base, 4x10⁻⁴ g/L biotin, 0.5% methanol). The pPICZαB vector was obtained from Invitrogen (California, USA).
18
3. Construction of the pPICZαB-STEAP1_6His expression
vector
Total RNA was previously extracted from LNCaP cell line as described in (98). From there, cDNA was synthesized with the NZY First-Strand cDNA Synthesis kit. The cDNA encoding STEAP1 protein was amplified by Polymerase Chain Reaction (PCR) using specific primers containing restriction sites for Not I and Pst I enzymes (STEAP1 FW: 5’ AA GCT GCA GGA ATG GAA AGC AGA AAA GAC ATC 3’; STEAP1 RV: 5’ AAG CGG CCG CTA ATG GTG ATG GTG ATG GTG CAA CTG GGA ACA TAT CTC AGT 3’). PCR conditions were conducted as followed: initial denaturation step at 95ºC for 5 minutes, 30 cycles of denaturation at 95ºC for 30 seconds, annealing at 60ºC for 30 seconds and extension at 72ºC for 1 minute and a final elongation step at 72ºC for 5 minutes.
Figure 6: pPICZαB expression vector (Retrieved from Invitrogen, EasySelect™ Pichia Expression Kit no. 25, 2010).
PCR amplification was confirmed by 1% gel electrophoresis. PCR products were purified with the kit NucleoSpin Gel and PCR Clean-up following the manufacturer’s instructions. The purified PCR products and vector pPICZαB (Figure 6) were digested with the restriction enzymes Not I and Pst I, and purified with kit NucleoSpin Gel and PCR Clean-up following the manufacturer’s instructions. The digested products were incubated together with 0.5 µL T4 DNA Ligase and 1 µL Buffer 10x. Different conditions of temperature, time of incubation and ratio of vector:insert DNA were tested as suggested by the enzyme’s manufacturer and presented in Table 1.
100 µL of competent E. coli TOP10 cells were transformed with the plasmid: 35 minutes on ice, followed by 2 minutes at 42ºC. The transformed cells were plated in LSLB medium with 25 µg/mL Zeocin. The plates were grown at 37ºC overnight. Several colonies were taken from
19 each plate, lysed (colony dissolved in 10 µL Mili-Q water and incubated for 10 minutes at 95ºC) and a screening by PCR was used to identify colonies with insert. Then, one colony was picked and grown in 2 mL of LSLB medium with 25 µg/mL Zeocin and incubated at 37ºC, 250 rpm, overnight. The plasmid was extracted and purified with the kit NZYMiniprep following the manufacturer’s instructions. The purified vector was sequenced using the primers for STEAP1 as well as for the promoter AOX1 (AOX1 FW: 5’ GACTGGTTCCAATTGACAAGC 3’; AOX1 RV: 5’ CAAATGGCATTCTGACATCC) using the kit Dye Terminator Cycle Sequencing with Quick Start Kit from Beckman Coulter (California, USA). The program BlastX was used to analyze the DNA sequence in order to confirm the identity and frame of the insert.
4. Pichia pastoris X33 transformation
Using the sequenced vector, 10ng were digested with Sac I for 2 hours at 37ºC. The digested vector was purified with the kit NucleoSpin Gel and PCR Clean-up, and the purified linearized vector was stored at -80ºC.
Untransformed Pichia pastoris X33 cells were streaked on YPD plates, which were grown at 30ºC for 2-3 days. An isolated colony was picked and transferred to 5 mL of YPD medium in a 50 mL Falcon tube and grown overnight at 30ºC at 250 rpm. From there, 100 µL of the overnight culture was transferred to 250 mL YPD medium and the cells were grown at 30ºC until the OD600 reached 1.3-1.5. The culture was centrifuged in four separate 50 mL Falcon tubes at 4ºC for 5 minutes at 1500 g. The pellets were recovered and the supernatant discarded. Each pellet was dissolved in 20 mL of cold Sorbitol 1 M. All the pellets were gathered in one Falcon and centrifuged at 4ºC for 5 minutes at 1500 g. The supernatant was discarded and the pellet was dissolved in 1 mL of cold Sorbitol 1 M. The vector, previously stored at -80ºC, was added to 80 µL cells and the mixture was transferred to a cold 0.2 cm electroporation cuvette (Bio-Rad, California, USA) and incubated on ice for 5 minutes. The cells were pulsed once at 2500 V and, immediately after, 1 mL of cold Sorbitol 1 M was added. The mixture was transferred to a 15 mL Falcon tube and grown for 2 hours at 30ºC. Afterward, 12.5 µL, 25 µL, 50 µL and 100 µL of cells were streaked on four YPDS plates with 200 µg/mL Zeocin, and grown at 30ºC for 4 days.
20 Figure 7: Schematics of gene insertion into Pichia pastoris’ genome.
An isolated colony was picked from the ones originated from the 100 µL and transferred to 5 mL of YPD medium with 200 µg/mL of Zeocin in a 50 mL Falcon tube and grown overnight at 30ºC at 250 rpm. From there, 2 mL of the culture was added to 100 mL of YPD medium with 200 µg/mL of Zeocin and grown at 30ºC, 250 rpm, until the OD600 reached 1.2-1.3. To 3 mL of glycerol was added 7 mL of the culture and stored in aliquots with 500 μl at -80ºC.
To further confirm the presence of the vector, PCR was performed with Pichia
pastoris genomic DNA (gDNA). From the fermentation process, 1 mL of medium was harvested
and centrifuged at 14000 rpm for 2 minutes. The supernatant was discarded. The extraction and purification of gDNA were achieved with the Wizard® Genomic DNA Purification Kit. PCR reactions were carried out using STEAP1 and AOX1 primers.
5. Biosynthesis of STEAP1 in Pichia pastoris
An initial fermentation was carried out with the following conditions: an aliquot of transformed Pichia pastoris X33 with the vector pPICZαB-STEAP1_6His was streaked on YPD plates with 200 µg/mL Zeocin and grown at 30ºC for 2-3 days. An isolated colony was picked and transferred to 50 mL of BMGH medium in 250 mL shake flasks and grown at 30ºC, 250 rpm until OD600 reached 5-6. Then, an aliquot was collected and centrifuged at 15000 g, at room temperature for 5 minutes and added to 100 mL of BMMH medium in 500 mL shake flasks in
21 order to fix the initial OD600 at 1.0. To determine the volume of pre-fermentation to collect, the formula (1) was used:
𝑂𝐷𝑝𝑟𝑒−𝑓𝑒𝑟𝑚× 𝑉𝑝𝑟𝑒−𝑓𝑒𝑟𝑚= (𝑉𝑝𝑟𝑒−𝑓𝑒𝑟𝑚+ 𝑉𝑓𝑒𝑟𝑚𝑒𝑛𝑡𝑎𝑡𝑖𝑜𝑛) × 𝑂𝐷𝑓𝑒𝑟𝑚𝑒𝑛𝑡𝑎𝑡𝑖𝑜𝑛 (1)
The fermentation was carried out during 120 h at 30ºC and 250 rpm and supplemented with 1% methanol every 24 hours. Finally, the cells were harvested by centrifugation at 1500g for 5 min at 4ºC. The supernatant/extracellular medium and pellet were stored at −20ºC until use. Afterward, the time of fermentation, methanol concentration, time of induction, temperature and use of chaperones were altered to optimize protein production.
6. Protein Recovery and Solubilization
The cell mass previously harvested was weighted and lysed in 2 volumes of lysis buffer (150 mM NaCl, 50 mM Tris, 1 mM MgCl2, pH 7.8), 2 volumes of glass beads (500 μm, Sigma-Aldrich, St. Louis, MO, USA) and protease inhibitors cocktail (Sigma-Aldrich, St. Louis, MO, USA) following the manufacturer’s instructions. The mixture was vortexed 7 times for 1 min with an interval of 1 min on ice and centrifuged at 500g for 5 minutes at 4ºC. The supernatant was discarded and the pellet with the glass beads was resuspended in the same volume of lysis buffer. The resolubilized pellet was transferred to a lysis tube and added DNase (0.25 mg/mL), and centrifuged at 16000g for 30 min at 4ºC. The 16000g supernatant (S16000g) was
collected, and the 16000g pellet (P16000g) was solubilized in the same volume of lysis buffer
plus 1% Triton X-100 at 4ºC. For most samples, Triton X-100 was the detergent used. However, other detergents were tested, such as SDS, Tween 20 and Tween 80, as well as urea.
7. Agarose gel electrophoresis
The DNA electrophoresis was performed on a gel containing 1% agarose. The buffer used was a Tris-acetic acid buffer (40 mM Tris base, 20 mM acetic acid and 1 mM EDTA, pH 8.0). The run was realized at 120 V for 30 min and the bands were visualized under UV light using the program UVITEC FireReader (UVItec, Cambridge, UK).
22
8. Total protein quantification
The protein concentration in the samples obtained after solubilization were quantified with the Pierce BCA Protein Assay Kit (Thermo Fisher Scientific, Waltham, MA, USA), using bovine serum albumin (BSA) as the standard with concentrations from 25 to 2000 µg/mL according to manufacturer’s instructions. The plate was read in xMark™ Microplate Absorbance Spectrophotometer (Bio-Rad). The following curves were used to quantify the P16000g fraction, according to the detergent used in the final step of solubilization.
Figure 8: A- BSA calibration curve with Lysis Buffer; B- BSA calibration curve with Lysis Buffer (150 mM NaCl, 50 mM Tris, 1 mM MgCl2, pH 7.8) and Triton X-100 1%; C- BSA calibration curve with Lysis Buffer with and urea 6M; D- BSA calibration curve with Lysis buffer and Tween 20 1%; E- BSA calibration curve with Lysis buffer and SDS 1%; F- BSA calibration curve with Lysis buffer and Tween 80 1%.
23
9. Western Blot Analysis
Total protein was resolved by 12% SDS-PAGE gel at 120 V for 1h45min at room temperature with Running buffer, and then, electrotransferred to a Polyvinylidene difluoride membrane (GE Healthcare, Buckinghamshire, UK) at 0.75 A for 45 minutes in CAPS buffer. Membranes were blocked for 1 h in a 5% (w/v) milk solution and incubated overnight with a rabbit polyclonal antibody against human STEAP1 (diluted at 1:600, Santa Cruz Biotechnology, Dallas, Texas, U.S.A.) at 4ºC with constant stirring. The membranes were then washed with Washing buffer and incubated with a polyclonal antibody anti-rabbit (diluted 1:40000; Cosmo Bio Co. Ltd., Tokyo, Japan) for 1 h at room temperature with constant stirring. Finally, the membranes were once more washed with Washing buffer, exposed to ECL substrate (Advansta, CA, USA) for 5 minutes and visualized on the Molecular Imager FX (Biorad, Hercules, USA).
24
CHAPTER IV- RESULTS AND DISCUSSION
1. Construction of the expression vector
pPICZαB-STEAP1_6His
The initial step was to amplify by PCR the STEAP1 gene and insert it into the pPICZαB expression vector. The primers contained the restriction sites for two different restriction enzymes (Pst I and Not I, respectively). These restriction enzymes were chosen because they can be used to cut the expression vector pPICZαB in the multiple cloning site. Using two restriction enzymes instead of just one facilitates the directional insertion of the gene into the expression vector. It was also added a sequence coding a 6 Histidine tag in the primer reverse to facilitate the purification process. Since the primers had never been used before, in the first PCR done to amplify the STEAP1 gene, three annealing temperatures were tested (60ºC, 62ºC, and 65ºC). All temperatures were effective, as it can be seen in Figure 9A. The temperature of annealing chosen was 60ºC since it created the band with the highest intensity.
Figure 9: Agarose Gel 1%. A: M- NZYDNA ladder VI marker; 1- Annealing at 60ºC; 2- Annealing at 62ºC; 3- Annealing at 65ºC; B: MW- NZYDNA ladder VI marker; 1- Digested PCR products; 2- Digested pICZαB vector.
The PCR product and pPICZαB vector were digested with the restriction enzymes and purified. The digestion was complete as it can be seen in Figure 9B by the presence of a single band. In order to determine the best condition for DNA cloning, different quantities of digested PCR were added to 1 µL pPICZαB vector, supplemented by 1 µL Buffer, 0.5 µL T4 DNA Ligase and water Mili-Q until a total volume of 10 µL (Table 1).
25 Table 1: Different conditions tested for DNA cloning into a pPICZαB vector.
REACTION PURIFIED PCR FRAGMENTS TEMPERATURE TIME
1 0.5 µL Room T 3h 2 1 µL Room T 3h 3 2 µL Room T 3h 4 4 µL Room T 3h 5 1 µL 4ºC Overnight 6 2 µL 4ºC Overnight 7 1 µL Room T 4h 8 2 µL Room T 4h
Of all the conditions tested, the best one was the Reaction 8, since it was the only reaction that was amplified by PCR with the STEAP1 primers (Figure 10, lane 5). The vector was purified and sequenced to confirm the correct placement of the gene. The PCR products were also sequenced and analyzed using the BlastX program.
Figure 10: Agarose gel 1%; 1-4: reaction 1-4; 5- reaction 8.
2. Pichia pastoris X33 transformation
The sequenced vector was digested with the restriction enzyme Sac I, to linearize it and enable its insertion into the Pichia pastoris’ genome. To confirm the correct insertion, the transformed cells were grown in YPD plates with zeocin. Since the resistance to this antibiotic is given by the vector, colonies that grew on the plate will have it. Several volumes of
26 transformed Pichia pastoris were plated: 12.5 µL, 50 µL, 100 µL and 200 µL. A colony from the 100 µL plate (Figure 11D) was selected and PCR amplification with STEAP1 and AOX1 primers confirmed the vector’s correct insertion into Pichia pastoris’ genome (Figure 12).
Figure 11: YPD plates with colonies with Pichia pastoris transformed with pPICZαB-STEAP1_6His expression vector; A- 12.5 µL of transformed cells; B- 25 µL of transformed cells; C- 50 µL of transformed cells; D- 100 µL of transformed cells.