Vol.47, n. 5 : pp. 669-676, September 2004
ISSN 1516-8913 Printed in Brazil
BRAZILIAN ARCHIVES OF
BIOLOGY AND TECHNOLOGY
A N I N T E R N A T I O N A L J O U R N A L
Path Analysis under Multicollinearity in Soybean
Henrique Stoco Bizeti
1, Claudio Guilherme Portela de Carvalho
2, José Roberto Pinto de
Souza
1and Deonisio Destro
1∗1
Departamento de Agronomia; Universidade Estadual de Londrina - UEL; C. P. 6001; 86051-990; Londrina - PR - Brazil. 2 Embrapa Soja; Rod. Carlos João Strass; C. P. 231; 86001-970; Londrina - PR - Brazil
ABSTRACT
This study aimed to establish the phenotypic correlations among several soybean traits with grain yield in direct and indirect effects using path analysis, and to compare alternative methods for minimizing the adverse effects of multicollinearity in estimating path coefficients. The experiment was conducted in greenhouse in a randomized complete block design with four replications. Nine soybean genotypes belonging to three seed size categories were used. The correlation studies and the path analysis showed that the seed size was not important for increased yield. The number of nodes and plant height at maturity showed significant correlation with grain yield. Using the least square methodology, the results obtained by path analysis under multicollinearity were not satisfactory. The ridge path analysis and the trait culling were efficient in reducing the adverse effects of multicollinearity. Both methods showed that only the number of nodes at maturity trait had a high direct effect on grai n yield per plant.
Key words: genetic breeding, Glycine max, grain yield, seed size, root and canopy traits
∗ Author for correspondence
INTRODUCTION
Grain yield, an extremely complex trait, is the result of the expression and association of several plant growth components. Correlation coefficients, although very useful in quantifying the size and direction of trait associations, can be misleading if the high correlation between two traits is a consequence of the indirect effect of other traits (Dewey and Lu, 1959). Wright (1921) proposed a method called path analysis, which partitions the estimated correlations in direct and indirect effects of traits over a basic one, to better understand the association among traits. This analysis was first carried out on plants by Dewey and Lu (1959) and was later applied to various crops. In soybean, Pandey and Torrie (1973), Wakankar et al. (1974), Ali et al. (1989), Shivashankar and Viswanatha (1989), Akther and Sneller (1996), Board et al.
(1997), Taware et al. (1997), Shukla et al. (1998) and Board et al. (1999) reported its use.
Measuring direct and indirect effects of a trait group on a basic trait requires the estimation of path coefficients, which are obtained by regression equations where the variables have been previously standardized. However, measuring can be adversely affected by the multicollinearity effects among the involved traits. Multicollinearity occurs when the sample observations of the independent variables, or their linear combinations, are correlated. The variances associated to the path coefficient estimators may become too large in the presence of high multicollinearity, making the estimation unreliable (Carvalho, 1995; Carvalho et al., 1999a).
to the least squares proposed by Carvalho et al. (1995) can be used. This method modifies the normal equation system by adding a constant value to the diagonal of the independent variable correlation matrix. Because of its similarity with the ridge regression method proposed by Hoerl and Kennard (1970a), it is called ridge path analysis.
The objectives of this study were: a) to partition the phenotypic correlations among several soybean traits with grain yield in direct and indirect effects using path analysis; and b) compare alternative methods of minimizing the adverse effects of multicollinearity in estimating path coefficients.
MATERIAL AND METHODS
Genetic material and experiment
The experiment was carried out in a greenhouse. Nine soybean genotypes from three seed size categories defined by the weight of one hundred seeds (WHS) were used. The first category included large-seed genotypes with WHS over 34 grams (F825722P, Soja Feira 86-13 and Tamba kurodaisu); the second category consisted of medium size seed genotypes with WHS ranging from 15 to 21 grams (BR 16, BR 36 and a selection from Stwart), and the third category consisted of small-seeded genotypes with WHS ranging from 8 to 10 grams (Lines 603, 626, 629). The following traits were assessed in individual plants according to the plant developmental stage: a) at germination (stage VE on the Fehr and Caviness scale, 1977): SD - seedling diameter (mm); b) at the beginning of flowering (R1 stage on the Fehr and Caviness scale, 1977): NDF - number of days to flowering; PHF - plant height (cm); RL - main or pivot root length (cm); RDM - root dry matter (g/plant), assessed after drying the whole root in a chamber; CDM - canopy dry matter (g/plant), assessed after drying the whole canopy in a chamber; c) at maturity, (R8 stage on the Fehr and Caviness scale, 1977): PHM - plant height (cm); SDM - stem diameter (mm); NNM - total number of nodes on the main stem; NP - number of pods with formed seeds; PW - pod width (mm); NSP - number of seeds per pod (mean/plant); PL - pod length (cm); GY - grain yield (g/plant); WHS - weight of one hundred seeds (g). The WHS was obtained from a sample of one hundred seeds from each harvested plant. When the plants did not produce one hundred
seeds, the WHS was estimated by the following equation: WHS = (GY x 100)/ni, where ni is the
number of seeds per plant.
A randomized complete block design with four replications was used. Each plot consisted of two pots for the traits SD, NDF and PHF. For the other traits, each plot consisted of one pot because of the dry matter assessed (one pot of the plot was harvested at flowering). Seven seeds were sown per pot followed by thinning 25 days after sowing to two plants per pot.
Statistical analysis
Analysis of variance and the phenotypic correlation estimates among traits were obtained as described by Mode and Robinson (1959). The significance of the correlations was tested by the t test, with n-2 degrees of freedom (Vencovsky and Barriga, 1992). These correlations were partitioned in direct and indirect effects of the traits (independent variables of the regression model) on grain yield (dependent variable or basic) using path analysis (Wright, 1921).
Two procedures were adopted to handle cases of moderate to severe multicollinearity among the independent variables: (i) elimination in the X´X correlation matrix of variables that contributed most to the observed multicollinearity until weak multicollinearity was obtained (Carvalho et al., 1999a), and (ii) the use of the alternative least squares methodology proposed by Carvalho et al. (1995) to estimate the path coefficients. According to this method, a constant K is added to the diagonal of the X´X matrix, and the path coefficients obtained by solving the following equation:
(X´X + KIp)b* = X’Y where,
X´X is the correlation matrix among the
independent variables of the regression model; K
is a small amount added to the elements of the diagonal of the X´X matrix; Ip is the identity
matrix; b* is the ridge path coefficients vector; and X’Y is the correlation matrix among the dependent variables with each independent variable of the regression model.
coefficient estimates was used.
The multicollinearity degree of the X´X matrix was established based on its condition number (CN - ratio between the largest and smallest eigenvalue of the matrix) (Montgomery and Peck, 1981). If CN < 100, the multicollinearity was considered weak and was not a serious problem in the analysis. If 100 > CN > 1000 the multicollinearity was considered moderate to strong, and if CN > 1000 the multicollinearity was considered severe. The analysis of the eigenvalues of the matrix was carried out to identify the approximate nature of the linear dependency between the traits, detecting those that contributed to the presence of multicollinearity (Belsley et al., 1980). The traits that showed the highest elements in the eigenvectors associated to lowest eigenvalues were those that most contributed to this presence. Multicollinearity diagnosis and the other analyses of this study were solved by using the GENES software (Cruz, 1997). The identification of yield components as indirect selection criteria for grain yield was based on Board et al. (1997).
RESULTS AND DISCUSSION
The analysis of variance detected significant differences among lines at the 5% probability level (Table 1) for all the assessed traits. The smallest coefficient of variation was obtained for NDF (1.96%) and the largest for NP (26.01%) and GY (23.6%). Lopes et al. (1997) also reported high coefficients of variation (36.10% for plot yield) in their study. Although these two traits presented high coefficients of variation, the experimental accuracy may be considered satisfactory because of the significance of the effects tested.
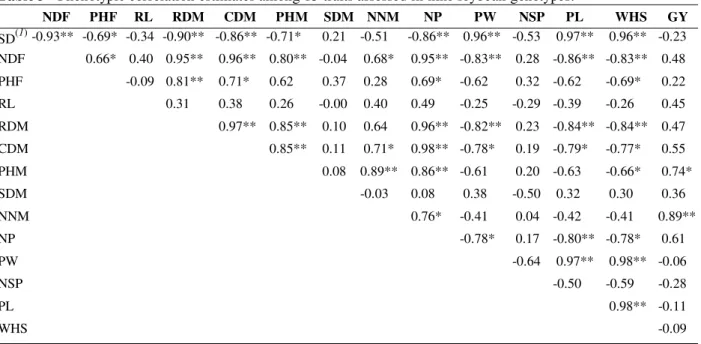
The highest grain yield per plant was found in Line 626, although this genotype was significantly different only from BR 16 and BR 36 (Table 2). The GY trait presented significant phenotypic correlations with NNM and PHM (Table 3), indicating that they were the most important traits linked to yield. Similar results were also obtained by Shivashankar and Viswanatha (1989) and Taware et al. (1997) for PHM, and by Akther and Sneller (1996) for NNM. On the other hand, Shukla et al. (1998), obtained non-significant correlations for GY with PHM and NNM.
Chloupek and Rod (1992) reported that, for most crops, the variation in root system size
corresponded to the variation in stem size. Significant correlations were obtained for RDM with PHF, CDM and PHM, which is in line with the quoted authors. The significant correlations of NDF with RDM, CDM and PHF indicated that plant root and canopy growth at flowering were largely controlled by genes that govern NDF. The significant correlation between WHS and SD indicated that seed size affects only seedling development; the larger the seed the higher the seedling diameter.
The highest PHF, PHM, RDM, CDM and NNM were found in Line 626. Plants from small seeds were the highest and had the highest accumulation of canopy and root dry matter (Tables 2 and 3). However, the WHS trait showed no correlation with GY. The non-significant relationship between seed size and grain yield was also observed by Taware et al. (1997), Shukla et al. (1998) and Board et al. (1999). Thus, it was found that soybean could increase or decrease the number of seeds in function of their size in a kind of buffer effect, without significantly varying the yield. The significant negative correlation between WHS and NP also suggested this kind of effect.
Path analysis
The phenotypic correlation matrix of the independent variables showed severe multicollinearity (CN > 1000). Using the least
squares method (K = 0) and carrying out an
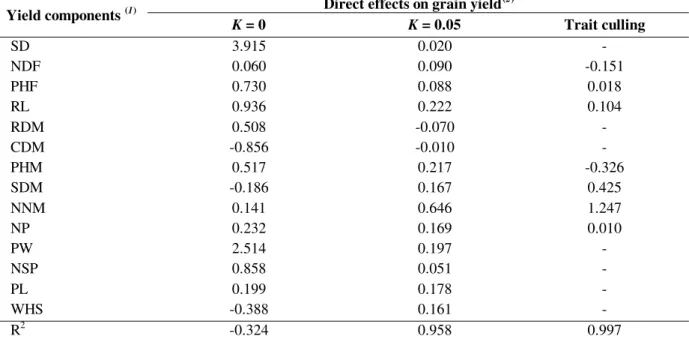
analysis with all the assessed traits (Table 4), the highest direct effects on GY were obtained with SD (3.915) and PW (2.514). Table 4 did not show the magnitude of indirect effects, but very high values were detected (ranging from -3.385 to 3.818) to be associated with all the traits. This created difficulties in interpreting the results. Furthermore, high residual effect (1.151) (Cruz and Regazzi, 1994) and negative determination coefficients (R2) were obtained.
High indirect effects associated with all traits, high residual effect and negative R2 values could be the result of the adverse effects of the multicollinearity
in the X´X matrix. When this occured, the least
squares methodology (K = 0) could not provide
Table 1- Analysis of variance, mean and coefficient of variation for 15 traits assessed in nine soybean genotypes.
Mean Square Sources of
variation df SD(1) NDF PHF RL RDM CDM PHM SDM
Blocks 3 0.003 1.296 148.490 50.718 12.623 51.237 289.874 2.028 Genotypes 8 1.103** 317.000** 3494.901** 105.011* 243.015** 7246.964** 4729.155** 2.846* Residue 24 0.009 0.796 211.574 33.128 5.997 94.641 456.611 0.864 Mean 2.353 45.500 136.747 49.091 13.641 61.127 164.439 7.707
C.V. (%) 4.16 1.96 10.62 11.78 17.95 15.91 12.99 12.06
NNM NP PW NSP PL WHS GY
Blocks 3 2.904 323.497 0.073 0.010 0.011 6.166 111.749
Genotypes 8 27.508** 48678.568** 17.600** 0.148** 2.211** 824.113** 1099.156** Residue 24 2.037 1477.020 0.041 0.024 0.018 3.881 312.954 Mean 15.32
8
148.320 9.991 2.020 4.249 22.561 74.875
C.V. (%) 9.31 26.01 2.05 7.80 3.22 8.73 23.62
* and ** indicate significance at P<0.05 and P<0.01 by F test.
(1)
SD - seedling diameter at emergence; NDF - number of days to flowering; PHF - plant height at flowering; RL - main or pivot root length at flowering; RDM - root dry matter; CDM - canopy dry matter; PHM - plant height at maturity; SDM - stem diameter at maturity; NNM - number of nodes on the main stem; NP - number of pods per plant; PW - pod width; NSP - number of seeds per pod; PL - pod length; WHS - weight of one hundred seeds; GY - grain yield per plant.
Table 2- Means of nine genotypes for 15 soybean traits.
Treatment SD(1) NDF PHF RL RDM CDM PHM SDM NNM NP PW NSP PL WHS GY
Large seeds
F825722P 2.82 b(2) 45.75c 132.55bcd 49.95ab 8.67b 32.12c 144.63cd 9.17a 14.12cde 77.25c 13.07a 1.81b 5.11b 40.20b 83.65ab
Soja de Feira 86-13
2.82 b 39.00cd 87.13d 50.95ab 5.97b 22.25c 164.63bcd 6.58b 17.62ab 74.72c 11.70b 1.91b 4.81b 33.87c 86.10ab
Tamba kurodaisu
3.20 a 34.25e 106.15cd 44.95ab 4.47b 27.17c 123.05d 8.21ab 13.12de 38.50c 12.85a 1.83b 5.46a 47.02a 68.00ab
Medium size seeds
BR16 2.26 d 41.00c 131.40bc 44.37ab 7.67b 28.20c 137.75d 6.80ab 13.25de 65.95c 9.02d 2.44a 4.17c 18.45de 55.35b BR36 2.55 c 37.00d 134.63bc 49.87ab 9.55b 23.12c 133.75d 7.68ab 11.37e 60.50c 10.27c 1.95b 4.16c 20.70d 50.90b Seleção de
Stwart
2.17 d 49.25b 182.13a 39.12b 20.10a 83.57b 197.25ab 8.01ab 16.25bcd 180.75b 9.27d 2.11ab 4.13c 15.22e 76.05ab
Small seeds
Line 603 1.79 e 56.00a 152.00ab 55.50a 20.60a 100.92b 159.33bcd 7.25ab 15.50bcd 258.00b 7.72e 1.98b 3.40d 9.47f 71.93ab Line 626 1.79 e 56.00a 172.00a 55.50a 24.60a 127.90a 225.33a 8.49ab 19.82a 347.00a 8.10e 2.05b 3.57d 8.85f 106.20a Line 629 1.77 e 56.25a 134.25bc 51.62a 21.12a 104.87ab 194.25ab 7.15ab 16.87abc 232.25b 7.80e 2.11ab 3.42d 9.25f 75.70ab DMS 0.23 2.14 34.96 13.80 5.88 23.38 51.35 2.37 3.43 87.38 0.49 0.38 0.32 4.73 45.52 (1)
SD - seedling diameter at emergence; NDF - number of days to flowering; PHF - plant height at flowering; RL - main or pivot root length at flowering; RDM - root dry matter; CDM - canopy dry matter; PHM - plant height at maturity; SDM - stem diameter at maturity; NNM - number of nodes on the main stem; NP - number of pods per plant; PW - pod width; NSP - number of seeds per pod; PL - pod length; WHS - weight of one hundred seeds; GY - grain yield per plant.
(2)
Means within a column followed by the same letter are not significantly different (P<0.05 - least significant difference).
If there is perfect multicollinearity among some of the independent variables, the matrix will be singular, and there will be no single inverse matrix (Carvalho et al., 1999b). An infinite number of vectors can thus be established, but none of them will have practical significance. The hypothetical condition of perfect multicollinearity is an extreme
case. However, according to these authors, as the correlation matrix approaches singularity, the corresponding path coefficient estimates become less reliable due to the variance increases associated with these coefficients.
using the ridge path analysis or with the trait culling (Carvalho et al., 1999a). In the ridge path analysis, as the K value increases the variances of the path coefficients are reduced. However, the estimates become more biased (Carvalho, 1995).
Furthermore, when K increases, the mean
quadratic error (variance + square of bias) decreases until a minimum value and then increases again (Hoerl and Kennard, 1970b). The chosen K value should be the smallest possible to reduce the variance of the estimator and to cause only a small bias, so that the mean quadratic error is smaller or equal to that of the least squares estimation. As can be seen in the examination of the ridge line (Fig. 1), the b* estimates stabilize for a value of K = 0.05. This was the K value used for ridge path analysis. For a better visualization, the figure only shows the estimates of the seven traits that contributed most to multicollinearity.
As there is no statistical test to verify whether the
mean quadratic error of b* is smaller than that
obtained by the least squares method, it is difficult to decide when the use of the ridge path analysis is most suitable. The results obtained from this analysis, however, were more satisfactory than those from the least squares. When K = 0.05, the residual effect decreased considerably (0.206) and
the R2 value was close to unit. For this K value, SD and PW presented low direct effects. The trait that presented the greatest direct effects on GY (0.646) was NNM, with low indirect effects. In this case, the multivariate analysis ratified the univariate result.
In the analysis with the trait culling, the contribution of each trait to the multicollinearity was estimated. According to this diagnostic, several traits were discarded until a CN < 100 was obtained for the X´X matrix (Table 4). The results obtained with the trait culling were similar to those of the ridge path analysis. All the traits eliminated had presented low direct effect in the ridge path analysis. Accordingly, the NNM trait also presented high direct effect on GY, a fact that was not observed when the least squares method was used. The PHM trait, which showed negative direct effect (-0.326) in the trait culling method, was the only example of disagreement with the ridge path analysis (0.217). Similar results using these alternative methods were also obtained in sweet peppers by Carvalho et al., (1999a). In spite of the simplicity of the trait culling method, however, Johnston (1972) and Heady and Dillon (1969) reported limitation of this method in regression analysis.
Table3 - Phenotypic correlation estimates among 15 traits assessed in nine soybean genotypes.
NDF PHF RL RDM CDM PHM SDM NNM NP PW NSP PL WHS GY
SD(1) -0.93** -0.69* -0.34 -0.90** -0.86** -0.71* 0.21 -0.51 -0.86** 0.96** -0.53 0.97** 0.96** -0.23 NDF 0.66* 0.40 0.95** 0.96** 0.80** -0.04 0.68* 0.95** -0.83** 0.28 -0.86** -0.83** 0.48
PHF -0.09 0.81** 0.71* 0.62 0.37 0.28 0.69* -0.62 0.32 -0.62 -0.69* 0.22
RL 0.31 0.38 0.26 -0.00 0.40 0.49 -0.25 -0.29 -0.39 -0.26 0.45
RDM 0.97** 0.85** 0.10 0.64 0.96** -0.82** 0.23 -0.84** -0.84** 0.47
CDM 0.85** 0.11 0.71* 0.98** -0.78* 0.19 -0.79* -0.77* 0.55
PHM 0.08 0.89** 0.86** -0.61 0.20 -0.63 -0.66* 0.74*
SDM -0.03 0.08 0.38 -0.50 0.32 0.30 0.36
NNM 0.76* -0.41 0.04 -0.42 -0.41 0.89**
NP -0.78* 0.17 -0.80** -0.78* 0.61
PW -0.64 0.97** 0.98** -0.06
NSP -0.50 -0.59 -0.28
PL 0.98** -0.11
WHS -0.09
* and ** indicate significance at P<0.05 and P<0.01 by F test.
(1)
Table 4 - Estimates of direct effects of yield components on grain yield obtained from nine soybean genotypes.
Direct effects on grain yield(2) Yield components (1)
K = 0 K = 0.05 Trait culling
SD 3.915 0.020 -
NDF 0.060 0.090 -0.151
PHF 0.730 0.088 0.018
RL 0.936 0.222 0.104
RDM 0.508 -0.070 -
CDM -0.856 -0.010 -
PHM 0.517 0.217 -0.326
SDM -0.186 0.167 0.425
NNM 0.141 0.646 1.247
NP 0.232 0.169 0.010
PW 2.514 0.197 -
NSP 0.858 0.051 -
PL 0.199 0.178 -
WHS -0.388 0.161 -
R2 -0.324 0.958 0.997
(1)
SD - seedling diameter at emergence; NDF - number of days to flowering; PHF - plant height at flowering; RL - main or pivot root length at flowering ; RDM - root dry matter; CDM - canopy dry matter; PHM - plant height at maturity; SDM - stem diameter at maturity; NNM - number of nodes on the main stem; NP - number of pods per plant; PW - pod width; NSP - number of seeds per pod; PL - pod length; WHS - weight of one hundred seeds.
(2)
The path coefficients were estimated using the ridge path analysis (K = 0 e K = 0.05) and with trait culling.
Figure 1 - Path coefficient estimates (b*) as a function of K values.
-2 -1 0 1 2 3 4 5
K values
b*
K values
Similarly to the ridge path analysis, the R2 for the method with trait culling was close to the unit. This showed that the variation of the basic variable GY was very well explained by the other traits. On
the other hand, the R2 = -0.324 obtained in the
least squares method could have resulted from the method’s poor estimation of the path coefficients. The different seed size among the genotypes used in this study, measured by the WHS trait, did not greatly influence the grain yield variation. The ridge path analysis indicated that this trait presented low direct effect (0.161) on yield confirming the correlation study data. These results differed from those obtained by Ali et al. (1989), Shivashankar and Viswanatha (1989) and Taware et al. (1997), who found important direct effect of WHS on yield.
In spite of the importance detected in the correlation studies, the PHM trait presented a low direct effect in the path analysis. This showed the contribution of the path analysis in showing the true relationships of cause and effect among the traits assessed. The significant correlation between PHM and GY was the result of the high indirect effect of NNM, through PHM. Shivashankar and Viswanatha (1989), Taware et al. (1997) and Shukla et al. (1998) also found low association between PHM and GY. On the other hand, Ali et al. (1989) reported direct high effects of PHM on GY in soybean cultivated in different periods.
In summary, the results obtained in this study with ridge path analysis and with trait culling highlighted the NNM trait as the most associated with GY. The direct effect was high, as the correlation. NNM also showed minimum negative indirect effects through the other assessed traits. Also using path analysis, similar results were obtained by Akther and Sneller (1996), but highlighting PHM by side of NNM trait. Studies by Board et al. (1997) and Shukla et al. (1998), however, found variable and little influence of NNM on the grain yield, respectively.
CONCLUSIONS
The number of nodes on the main stem trait was highly correlated and has direct effect on soybean grain yield. It could, therefore, help at an indirect selection for yield. The path ridge analysis and the trait culling method were efficient in reducing the adverse effects of multicollinearity in the estimation of the path coefficients.
ACKNOWLEDGEMENTS
The authors thank CNPq and CAPES for grants and financial support.
RESUMO
Este trabalho teve como objetivos: a) desdobrar as correlações fenotípicas em efeitos diretos e indiretos de várias características sobre a produção de grãos da soja, através da análise de trilha, e b) comparar métodos alternativos de contornar os efeitos adversos da multicolinearidade na estimação dos coeficientes de trilha. O experimento foi conduzido em casa de vegetação, em delineamento de blocos completos casualizados, com quatro repetições. Foram utilizados nove genótipos de soja pertencentes a três categorias de tamanho de sementes. Os estudos de correlações e análise de trilha mostraram que o tamanho das sementes não foi importante no aumento da produção. Número de nós e altura de planta na maturação apresentaram correlações significativas com produção de grãos. Utilizando-se a metodologia dos quadrados mínimos, os resultados obtidos por meio da análise de trilha sob multicolinearidade foram pouco satisfatórios. A análise de trilha em crista e a eliminação de variáveis foram eficientes em reduzir os efeitos adversos de multicolinearidade. Esses dois métodos destacaram apenas o caráter número de nós na maturação como tendo alto efeito direto sobre a produção de grãos por planta.
REFERENCES
Akhter, M. and Sneller, C. H. (1996), Yield and yield components of early maturing soybean genotypes in the mid-south. Crop Science, 36, 877-882.
Ali, A. A. D. M.; Fraj B. H. and Ibraheen, S. A. (1989),
Correlation and path-coefficient analysis of yield and
certain characters of soybean (Glycine max (L)
Merrill) in Iraq. Paper presented at 4th Conferencia Mundial de Investigación en soja, Buenos Aires. Belsley, D. A.; Kuh, E. and Welch, R. E. (1980),
Regression diagnostics: identifying data and sources of collinearity. New York : John Wiley and Sons. Board, J. E.; Kang, M. S. and Harville, B. G.
Board, J. E.; Kang, M. S. and Harville, B. G. (1999), Path analyses of the yield formation process for late-planted soybean. Agronomy Journal, 91, 128-135. Carvalho, S. P. (1995), Métodos alternativos de
estimação de coeficientes de trilha e índices de
seleção, sob multicolinearidade. Thesis,
Universidade Federal de Viçosa, Viçosa, Brazil. Carvalho, C. G. P.; Oliveira, V. R.; Cruz, C. D. and
Casali, V. W. D. (1999a), Análise de trilha sob multicolinearidade em pimentão. Pesquisa Agropecuária Brasileira, 34, 603-613.
Carvalho, S. P.; Cruz, C. D. and Carvalho, C. G. P. (1999b), Estimating gain by use of a classic selection under mulcollinearity in wheat (Triticum aestivum).
Genetics and Molecular Biology, 22, 109-113.
Chloupek, O. and Rod, J. (1992), The root system as a selection criterion. Plant Breeding Abstracts, 62, 1337-1341.
Cruz, C. D. (1997), Programa Genes: aplicativo
computacional em genética e estatística. UFV,
Viçosa, (http://www.genetica.dbg.ufv.br).
Cruz, C. D. and Regazzi, A. J. (1994), Modelos
biométricos aplicados ao melhoramento genético.
UFV, Viçosa.
Dewey, D. R. and Lu, K. H. (1959), A correlation and path coefficient analysis of components of crested wheatgrass seed production. Agronomy Journal, 51, 515-518.
Fehr, W. R. and Caviness, C. E. (1977), Stages of
soybeans development. Iowa State Univ., Ames,
(Special Report, 80).
Heady, E. O. and Dillon, J. L. (1969), Agricultural
production functions. The Iowa State University
Press, Ames.
Hoerl, A. E. and Kennard, B. G. (1970a), Ridge regression: aplications to monorthogonal problems.
Technometrics, 12, 69-82.
Hoerl, A. E. and Kennard, B. G. (1970b), Ridge regression: biased estimation for monorthogonal problems. Technometrics, 12, 55-68.
Johnston, J. (1972), Econometric methods. New York : McGraw-Hill Book Company.
Lopes, E. C. A.; Destro, D.; Montalván, R.; Ventura, M. U. and Guerra, E. P. (1997), Genetic gain and correlations among traits for stink bug resistance in soybeans. Euphytica, 97, 161-166.
Mode, J. C. and Robinson, H. F. (1959), Pleiotropism and genetic variance and covariance.
Biometrics, 15, 518-537.
Montgomery, D. C. and Peck, E. A. (1981),
Introduction to linear regression analysis. New York : John Wiley and Sons.
Pandey, J. P. and Torrie, J. H. (1973), Path coefficient analysis of seed yield components in soybeans (Glycine max (L) Merrill). Crop Science, 13, 505-507 Shivashankar, G. and Viswanatha, S. R. (1989),
Soybean introduction and improvement in Karnataka state of India. Paper presented at 4th Conferencia Mundial de Investigación en soja, Buenos Aires. Shukla, S.; Singh, K. and Pushpendra (1998),
Correlation and path coefficient analysis of yield and its components in soybean (Glycine max (L) Merrill).
Soybean Genetics Newsletter, 25, 67-70.
Taware, S. P.; Halvankar, G. B.; Raut, V. M. and Patil, V. B. (1997), Variability, correlation and path analysis in soybean hybrids. Soybean Genetics Newsletter, 24, 96-98.
Vencovsky, R. and Barriga, P. (1992), Genética
biométrica no fitomelhoramento. Sociedade
Brasileira de Genética, Ribeirão Preto.
Wakankar, S. M.; Yadav, L. N. and Kelkar, G. M. (1974), Path coefficient analysis for some characters in soybean. JNKVV Research Journal, 8, 196-201. Wright, S. (1921), Correlation and causation. Journal
Agricultural Research, 20, 557-585.