Path analysis of iron and zinc contents and others traits in cowpea
Jeane de Oliveira Moura1*, Maurisrael de Moura Rocha2, Regina Lúcia Ferreira Gomes1, Francisco Rodrigues Freire
Filho2, Kaesel Jackson Damasceno e Silva2 and Valdenir Queiroz Ribeiro2
Received 04 November 2011
Accepted 29 October 2012
Abstract - The objective of this study was to estimate the direct and indirect effects of agronomic and culinary traits on iron and zinc contents in 11 cowpea populations. Correlations between traits were estimated and decomposed into direct and indirect effects using path analysis. For the study populations, breeding for larger grain size, higher number of grains per pod, grain yield, reduced cook-ing time, and number of days to flowercook-ing can lead to decreases in the levels of iron and zinc in the grain. Genetic gains for the iron content can be obtained by direct selection for protein content by indirect effects on the number of grains per pod, 100-grain weight and grain yield. The positive direct effect of grain size and protein content on the zinc content indicates the possibility of simultaneous gain by combined selection of these traits.
Key words: Vigna unguiculata, correlation, selection, breeding, biofortification.
1 Universidade Federal do Piauí, 64.049-550, Teresina, PI, Brazil. *E-mail: [email protected] 2 Embrapa Meio-Norte, C.P. 01, 64.006-220, Teresina, PI, Brazil
INTRODUCTION
Micronutrients, including iron and zinc, are essential elements for a balanced human nutrition, required in small amounts. These two minerals are essential for human well-being and an adequate iron and zinc supply helps prevent, respectively, iron deficiency anemia and strengthen the immune system, which are two frequent problems in de-veloping countries (Blair et al. 2009).
Cowpea (Vigna unguiculata (L.) Walp.) is a legume grown in tropical and subtropical regions of Africa, Asia, America, Europe, and Oceania, in 97 countries, on an estimated area of 14 million hectares, by the major producers Nigeria, Niger and Brazil. Cowpea is also known as black-eyed pea and in Brazil as “feijão-macássar” or “feijão-de-corda”, where it is a major food crop in the Northeast (Moreira et al. 2008, Freire Filho et al. 2011).
In cowpea breeding programs, selection is usually based on a wide range of traits, including grain yield and its com-ponents, adaptability and stability, resistance to major biotic (virus) and abiotic stresses (drought and high temperatures), earliness, uniform maturity, a modern plant architecture (semi-upright to upright growth, lodging resistance, etc.)
and targets, in the short term, biofortification (Freire Filho et al. 2011). Studies also showed the presence of considerable genetic variability for some important nutrients, especially iron, zinc and protein levels (Rocha et al. 2008, Mamiro et al. 2011), which, according to these authors, allows gains with selection.
To breed cultivars with good agronomic, nutritional, culinary, and commercial characteristics, the relationships between these traits must be known. The degree of asso-ciation between two variables is given by the correlation, mathematically defined as the average product of deviations of two variables from their own means (Griffiths et al. 2001). For breeding, the phenotypic, genetic and environmental correlations between two traits can be estimated. The most important of these is the genetic correlation, which may be due to pleiotropy or genetic linkage (Falconer and Mackay 1996). If the genetic correlations cannot be estimated, the estimates of the path coefficients derived from phenotypic correlations are also quite informative (Vencovsky and Barriga 1992).
The interpretation and quantification of the magnitude of a correlation can result in an erroneous selection strategy,
Crop Breeding and Applied Biotechnology 12: 245-252, 2012 Brazilian Society of Plant Breeding. Printed in Brazil
since a correlation can be high due to the effect of other traits (Cruz et al. 2004). In this context, path analysis is one of the methods to explain the causes involved in inter-trait relations, partitioning the correlation in direct and indirect effects of explanatory variables on a principal variable (Kurek et al. 2001).
The path analysis studies in cowpea have focused on the direct and indirect effects of yield components on grain yield (Bezerra et al. 2001, Oliveira et al. 2003, Peksen and Artik 2004, Kumari et al. 2010, Manggoel et al. 2012). However, studies on relations between these characters and the nutritional and culinary traits are scarce (Kar et al. 2000). Path analysis can underlie the choice of the most effective (direct or indirect) selection strategy to simultaneously develop higher-yielding genotypes and biofortification of the cowpea grains.
The aim of this study was to estimate the direct and indirect effects of some agronomic and culinary traits on the iron and zinc levels in grains of cowpea populations through path analysis.
MATERIAL AND METHODS
This study evaluated 11 cowpea populations, derived from three parent genotypes: BRS Xiquexique (P1), an iron and zinc-rich cultivar, from the Breeding Program of Embrapa Mid-North; IT-98K-205-8 (P2), an iron-rich cultivar and
IT-97K-1042-3 (P3), a zinc-rich cultivar, the latter two from the International Institute of Tropical Agriculture (IITA) in Ibadan, Nigeria; four F2 generations resulting from crosses between these parent genotypes, including the reciprocals
C1 - BRS Xiquexique x IT-98K-205-8, C2 - IT-98K-205-8 x BRS Xiquexique, C3 - BRS Xiquexique x IT-97K-1042-3, and C4 - IT-97K-1042-3 x BRS Xiquexique); and four backcrosses between F1 hybrids of these crosses for the recurrent parent BRS Xiquexique.
The populations were evaluated in 2010, in a field ex-periment at Embrapa Mid-North in Teresina, PI, (lat. 05º 05’ S, long. 42º 48’ W, and alt. 72 m asl) in a randomized complete block design with four replications. The experi-mental plots (3.2 m x 5.0 m) consisted of four 5-m rows, of which the two central rows were evaluated. Rows were spaced 0.80 m and plant holes 0.25 m apart, resulting in 20 plant holes per row.
The area was prepared by plowing and then disking; no fertilizer was applied. Four seeds were sown and thinned to one plant per hole 15 days later. A sprinkler irrigation system was applied in a schedule of five days a week for two hours. Prior to sowing, a fungicide based on metalaxyl-m
and Mancozeb was applied to the soil for fungi prevention and a Glyphosate-based herbicide for weed control.
Agronomic, nutritional and culinary traits were evalu-ated in the parent genotypes (P1, P2 and P3), and in the F2 generation (plant) / F3 generation (grain), resulting from crosses and backcrosses. The agronomic traits were number of days to the beginning of flowering (NDBF), number of grains per pod (NGP), weight of 100 grains (W100G) and grain yield (GY), the nutritional traits contents of protein (PC), iron (FeC) and zinc (ZnC), and one culinary trait, cooking time (CT).
The protein, iron and zinc levels were determined at the Laboratory of Analysis and Agricultural Environments (CAMPO) in Paracatu, Minas Gerais. Grain samples of each population were rinsed in distilled water and oven-dried at 65 °C for 48 hours. Thereafter each sample was ground in a zirconia ball mill. The protein content was determined by the Kjeldahl (AOAC 1990) method and the iron and zinc contents by means of nitric and perchloric digestion and by readings in a plasma spectrophotometer, as described by Sarruge and Haag (1974). The cooking time was determined using a Mattson cooker, in four samples of 25 grains population-1. The timer was only turned on when the Mattson cooker had been totally immersed in the beaker and the water was boiling. The cooking time was recorded when 13 of the total 25 rods had perforated the grains completely.
The trait data were obtained as plot averages and the populations were considered as fixed effect. The trait matrix of the phenotypic correlation was determined from the analysis of variance of the original data, using the estimator of the Pearson correlation coefficient. The significance of the estimates of the correlations was verified by the Mantel test (Cruz 2006). The multicollinearity of the explanatory variables was diagnosed, according to the methodology of Montgomery and Peck (1981), based on the condition number (CN), where CN <100 weak (no serious problem); 100 <CN <1000, moderate to strong and, CN > 1000, severe. The significant correlations were deployed in direct and indirect effects of explanatory variables on the dependent variable, in iron or zinc content.
explanatory variables can be estimated using the fol-lowing formula:
rix = Pix +
n
∑
j≠i rj Pjx
where rixis the correlation between dependent variable and the i-th explanatory variable; Pix is the direct effect of variable i on the dependent variable; rijPjxis the indirect effect of variable i, via the variable j on the dependent variable. The least squares solution of this system is given by the equation: β = (X’X)-1 (X’Y).
The interpretation of the results of path analysis was performed as described by Vencovsky and Barriga (1992). The following effects on path analysis were analyzed: a) Direct and indirect effects of the traits NDBF, NGP, W100G, GY, CT, PC, and ZnC (explanatory variables) on FeC (dependent variable), and b) direct and indirect effects of the traits NDBF, NGP, W100G, GY, CT, PC, and FeC (explanatory variables) on ZnC (dependent variable). All analyses were performed using the software package Genes (Cruz 2006).
RESULTS AND DISCUSSION
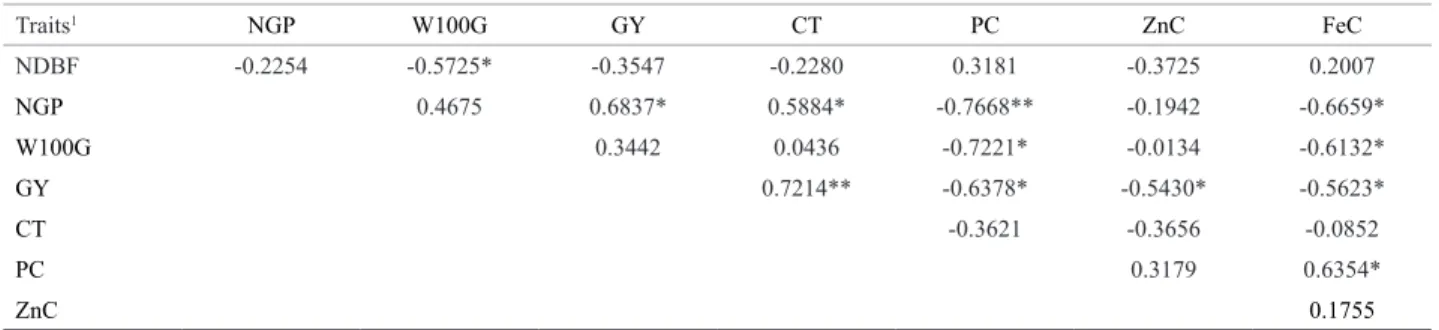
Estimates of correlation coefficients between the s traits are listed in Table 1. The total estimated correlations (28), 42.85% were significant, varying from medium (-0.54) to high (0.76). The number of days to the beginning of flowering (NDBF) was negatively correlated with the weight of 100 grains (W100G) (-0.57) (P <0.05). This correlation is favorable to increase the grain size and simultaneously improve genotypes for earliness. A larger grain size and shorter maturation cycle of cultivars are among the current goals of cowpea breeding (Freire Filho et al. 2011). This result contradicts Correa et al. (2012), who found no correlation between these two traits in 20 cowpea genotypes.
The number of grains per pod (NGP) correlated posi-tively and significantly (P <0.05) with grain yield (GY) (0.68) and cooking time (CT) (0.59), but negatively and significantly with protein content (PC) (-0.77) (P <0.01) and iron content (FeC) (-0.66) (P <0.05). The positive correlation with the traits NGP, GY and CT indicated that breeding for a higher number of grains per pod (de-sirable) can obtain yield gains, but increase the cooking time, which is undesirable; according to Coelho et al. (2007), consumers prefer a shorter cooking time. On the other hand, the negative correlation with NGP, PC and FeC indicated that an increased number of grains per pod
can in turn decrease the grain protein and iron contents. Therefore, indirect selection to increase the levels of these two nutrients by selection for NGP should be avoided. The magnitude and sign of the correlation between NGP and GY is consistent with results of Correa et al. (2012), but in contrast to those of Silva and Neves (2011), who stated no correlation between these two traits.
The trait W100G was significantly negatively correlated (P < 0.05) with protein (PC) (-0.72) and iron content (FeC) (-0.61). These correlations show that breeding for larger grain size (desirable) can induce a reduction in the grain protein and iron content. Thus, indirect selection to increase these two nutrients, via selection for W100G, should be avoided. According to Silva and Neves (2011), a large grain size is a consumer preference and is one of the important aspects, along with the grain coat color, in the establish-ment of the product price. A negative correlation between PC and W100G was also reported by Asante et al. (2004), in a study on grain weight, protein and tannin content in 32 cowpea accessions from Ghana, Africa. Moreover, Ajeigbe et al. (2008) obtained a high positive correlation (0.73) between these two traits in a study of nine cowpea cultivars in Nigeria, Africa.
Table 1. Estimates of the phenotypic correlation coefficients between the traits determined in 11 cowpea populations
Traits1 NGP W100G GY CT PC ZnC FeC
NDBF -0.2254 -0.5725* -0.3547 -0.2280 0.3181 -0.3725 0.2007
NGP 0.4675 0.6837* 0.5884* -0.7668** -0.1942 -0.6659*
W100G 0.3442 0.0436 -0.7221* -0.0134 -0.6132*
GY 0.7214** -0.6378* -0.5430* -0.5623*
CT -0.3621 -0.3656 -0.0852
PC 0.3179 0.6354*
ZnC 0.1755
*, ** Significant at 5 and 1% by the Mantel test based on 1000 simulations.
1 NDBF: number of days to beginning of flowering; NGP: number of grains per pod; W100G: 100-grain weight; GY: grain yield; PC: protein content; ZnC: zinc content;
Grain yield (GY) was significantly positively correlated (P < 0.01) with CT (0.72), but negatively and significantly (P <0.05) with the traits PC (-0.64), ZnC (-0.54) and FeC (-0.56). The positive correlation between GY and CT suggested that a higher yield will contribute to increase the cooking time, which is a negative aspect, since a short cooking time is a requirement of modern consumers (Coelho et al. 2007). The negative correlation between GY and the traits PC, ZnC and FeC suggested that selection for higher yield may decrease the Fe and Zn levels in the grains of the populations under study. Therefore, indirect selection via GY to increase the levels of these nutrients is not a recommendable strategy for improvement in these populations. In this case, direct selection would be a more viable strategy. The correlation between GY and PC contradicted the result obtained by Kar et al. (2000), who detected no association between these two traits in a study of 31 cowpea genotypes in Bengal, India.
The protein content (PC) was positively and significantly correlated (P < 0.05) with FeC (0.63). This suggests that the simultaneous selection of superior genotypes in the study population is possible for protein and iron content in the grain. This finding agrees with Boukar et al. (2011), who also observed a significant positive correlation (0.40) (P <0.05) in a study with 1541 cowpea accessions, conducted in Nigeria, Africa.
No correlation was found between PC and ZnC, PC and CT and TZ and FeC in this study, which disagrees with results of Boukar et al. (2011) who found positive and sig-nificant associations for these correlations in another study on cowpea. The absence of association between these traits indicates that breeding of one does not influence the other, so direct selection is most effective in this case.
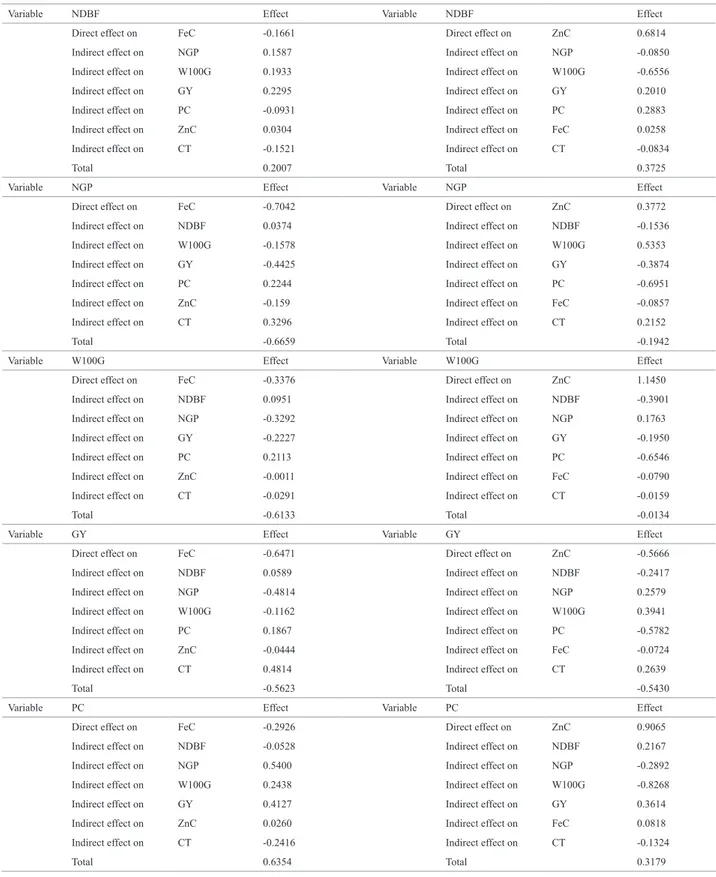
The results of the path analysis are presented in Table 2. Before this analysis, multicollinearity was diagnosed using the explanatory variables according to the methodology of Montgomery and Peck (1981), to check their independence. According to the condition numbers (CN = 70.73; 60.53), collinearity between the explanatory variables was considered weak (CN <100), representing no problem for the correlation matrix. According to Cruz (2006), to calculate the direct and indirect effects this matrix must be well-conditioned, since multicollinearity problems would make it nonsingular, and the least squares estimates would consequently be unreli-able. When this occurs, according to Coimbra et al. (2005), estimates of correlations and the direct and indirect effects of explanatory variables on the dependent variable may be overestimated and therefore inaccurate.
The direct and indirect effects of explanatory variables on the dependent variable FeC are shown in Table 2. Estimates
of the coefficients of determination (R2) observed in both analyses were medium to high. According to Borges (2011),
R2 is an indicator of adequacy of the model used. If R2 is close to unity (0.78), which is the case when considering FeC as dependent variable, it is accepted that variations in FeC are explained largely by variations of the explanatory variables. In the case where ZnC was considered as the dependent variable and the model explained a little more than half the variation (0.65), changes in ZnC were partly explained by variations in variables. According to Vencovsky and Barriga (1992), in the latter case, the dependent variable is not only result of the explanatory variables adopted but also of another factor or of a combination of residual factors. The R2 values found in this study were lower than those reported by Bezerra et al. (2001) (0.84) and Oliveira et al. (2003) (1.37). However, the model was best explained in relation to the R2 values adopted
by Udensi et al. (2011) (0.75) and Baghizadeh et al. (2010) (0.68) when compared to R2 of the path analysis, where FeC
was used as dependent variable, and by Sheela and Gopalan (2006) (0.48) compared to the R2 of the path analysis, in which ZnC was used as dependent variable.
Most explanatory traits had a negative direct effect on FeC, particularly NGP (-0.70) and GY (-0.65) (Table 2). In the case of these two characters, the correlation coefficient was almost equal to the direct effect. According to Vencovsky and Barriga (1992), when the correlation between a causal factor and the final trait is equal or similar to its direct effect on the magnitude and sign, this correlation explains the true existing association. As the direct effects and the correlations of the NGP and GY with FeC are negative, direct selection by increasing the NGP and GY lead to decreases in FeC, namely, the simultaneous selection of these traits is unfavorable for FeC. In this case, the success of indirect selection will be greater by positive indirect effects that are favorable to in-crease FeC, as is the case of indirect effects on the NGP FeC via PC (0.22) and CT (0.32) and GY on FeC via CT (0.48).
Table 2. Estimates of the direct and indirect effects of the explanatory variables1 on the iron and zinc contents, as determined in 11 cowpea populations
Variable NDBF Effect Variable NDBF Effect
Direct effect on FeC -0.1661 Direct effect on ZnC 0.6814
Indirect effect on NGP 0.1587 Indirect effect on NGP -0.0850
Indirect effect on W100G 0.1933 Indirect effect on W100G -0.6556
Indirect effect on GY 0.2295 Indirect effect on GY 0.2010
Indirect effect on PC -0.0931 Indirect effect on PC 0.2883
Indirect effect on ZnC 0.0304 Indirect effect on FeC 0.0258
Indirect effect on CT -0.1521 Indirect effect on CT -0.0834
Total 0.2007 Total 0.3725
Variable NGP Effect Variable NGP Effect
Direct effect on FeC -0.7042 Direct effect on ZnC 0.3772
Indirect effect on NDBF 0.0374 Indirect effect on NDBF -0.1536
Indirect effect on W100G -0.1578 Indirect effect on W100G 0.5353
Indirect effect on GY -0.4425 Indirect effect on GY -0.3874
Indirect effect on PC 0.2244 Indirect effect on PC -0.6951
Indirect effect on ZnC -0.159 Indirect effect on FeC -0.0857
Indirect effect on CT 0.3296 Indirect effect on CT 0.2152
Total -0.6659 Total -0.1942
Variable W100G Effect Variable W100G Effect
Direct effect on FeC -0.3376 Direct effect on ZnC 1.1450
Indirect effect on NDBF 0.0951 Indirect effect on NDBF -0.3901
Indirect effect on NGP -0.3292 Indirect effect on NGP 0.1763
Indirect effect on GY -0.2227 Indirect effect on GY -0.1950
Indirect effect on PC 0.2113 Indirect effect on PC -0.6546
Indirect effect on ZnC -0.0011 Indirect effect on FeC -0.0790
Indirect effect on CT -0.0291 Indirect effect on CT -0.0159
Total -0.6133 Total -0.0134
Variable GY Effect Variable GY Effect
Direct effect on FeC -0.6471 Direct effect on ZnC -0.5666
Indirect effect on NDBF 0.0589 Indirect effect on NDBF -0.2417
Indirect effect on NGP -0.4814 Indirect effect on NGP 0.2579
Indirect effect on W100G -0.1162 Indirect effect on W100G 0.3941
Indirect effect on PC 0.1867 Indirect effect on PC -0.5782
Indirect effect on ZnC -0.0444 Indirect effect on FeC -0.0724
Indirect effect on CT 0.4814 Indirect effect on CT 0.2639
Total -0.5623 Total -0.5430
Variable PC Effect Variable PC Effect
Direct effect on FeC -0.2926 Direct effect on ZnC 0.9065
Indirect effect on NDBF -0.0528 Indirect effect on NDBF 0.2167
Indirect effect on NGP 0.5400 Indirect effect on NGP -0.2892
Indirect effect on W100G 0.2438 Indirect effect on W100G -0.8268
Indirect effect on GY 0.4127 Indirect effect on GY 0.3614
Indirect effect on ZnC 0.0260 Indirect effect on FeC 0.0818
Indirect effect on CT -0.2416 Indirect effect on CT -0.1324
Total 0.6354 Total 0.3179
(2003), within a breeding program, aiming at the acceptance process of the new cultivar, attention should be given to the selection of genotypes that exhibit reduced cooking time.
The trait PC had a direct negative effect on FeC (-0.29). The correlation between these two traits was positive and the direct effect negative (0.63). In this case, according to Vencovsky and Barriga (1992), the correlation is caused by indirect effects and, in such situations, the indirect causal factors must be considered simultaneously in the selection process. Thus, NGP and GY are the indirect causal factors that most influenced the correlation and consequently, to improve FeC, indirect selection via NGP and GY is more advisable than direct selection via CT.
The trait W100G had a direct negative effect on FeC (-0.33) and the correlation between the two was negative (-0.61). Although the effect and correlation occur in the same direction, the effect occurs to a lesser extent than the correlation and both are unfavorable for selection for larger grain size and FeC. Some the current objectives of cowpea breeding in Brazil are a larger grain size and higher iron and zinc contents (Freire Filho et al. 2011). Therefore, direct selection via W100G should be avoided and the indirect ef-fects considered, favoring an increase in both traits, as is the case of the indirect effect of W100G on FeC, via PC (0.21).
Most explanatory variables had a positive direct effect on ZnC (Table 2). Although these effects were positive and high, the correlations between the explanatory variables and ZnC were low, except between GY and ZnC. In general, the correlations between the explanatory variables and ZnC are mainly caused by indirect effects and therefore there was no relation of cause and effect.
The trait W100G had the highest positive direct effect on ZnC (1.14). The correlation between these two traits was negative and low and the direct effect positive and high. In this case, according to Vencovsky and Barriga (1992), the indirect effects were responsible for the absence of correla-tion and, in such situacorrela-tions, attencorrela-tion should be paid to the indirect causal factors in the selection. In the case of this correlation, the indirect effects NDBF and PC should virtually be considered when breeding for FeC, since together they accounted for almost 100% by decreasing the correlation.
The NDBF had a positive direct effect on ZnC (0.68). The correlation between NDBF and ZnC was also positive, but lower, due to the presence of negative indirect effects, mainly via W100G (-0.65), which contributed to reduce this correlation. Since cowpea breeding is currently seeking a combination of earliness and biofortification (Freire Filho et al. 2011), the direct marked effect of NDBF on ZnC is
Variable ZnC Effect Variable FeC Effect
Direct effect on FeC 0.0817 Direct effect on ZnC 0.1287
Indirect effect on NDBF -0.0687 Indirect effect on NDBF 0.1367
Indirect effect on NGP 0.1367 Indirect effect on NGP -0.2512
Indirect effect on W100G 0.0045 Indirect effect on W100G -0.7023
Indirect effect on GY 0.3514 Indirect effect on GY 0.3186
Indirect effect on ZnC -0.0930 Indirect effect on PC 0.5760
Indirect effect on CT -0.2440 Indirect effect on CT -0.0312
Total 0.1755 Total 0.1755
Variable CT Effect Variable CT Effect
Direct effect on FeC 0.6673 Direct effect on ZnC 0.3658
Indirect effect on NDBF 0.0379 Indirect effect on NDBF -0.1553
Indirect effect on NGP -0.4143 Indirect effect on NGP 0.2219
Indirect effect on W100G 0.0147 Indirect effect on W100G -0.0499
Indirect effect on GY -0.4669 Indirect effect on GY -0.4088
Indirect effect on PC 0.1059 Indirect effect on PC -0.3282
Indirect effect on ZnC -0.2989 Indirect effect on FeC -0.0110
Indirect effect on -0.0852 Indirect effect on -0.3656
Total Total
R2 0.78 R2 0.65
Residual effect 0.22 Residual effect 0.35
Condition number 70.73 Condition number 60.53
1 NDBF: number of days to beginning of flowering; NGP: number of grains per pod; W100G: 100-grain weight; GY: grain yield; PC: protein content; ZnC: zinc content;
unfavorable to achieve these two objectives simultane-ously. To this end, the direct selection should be substituted by indirect selection via the indirect effect of W100G (-0.65), which is more favorable in this case.
The trait GY had a direct and negative effect on ZnC (-0.56). The correlation between GY and TZ was also nega-tive and of the same magnitude (-0.54), indicating a relation of cause and effect. According to Severino et al. (2002), for breeding it is essential to identify the traits with most favor-able direct effects among those with significant correlation for selection, so that the correlated response by means of indirect selection will be efficient. Currently, cowpea breeding aims to increase GY and Fe and Zn levels (Freire Filho et al. 2011). Thus, for the study population, the negative direct effect of GY is unfavorable for selection for higher grain ZnC. The probability of success can be raised with the use of indirect selection by positive indirect effects, such as the indirect effect of GY on ZnC via NGP, W100G and CT.
The trait PC had a positive and high direct effect on ZnC (0.91). The correlation between these traits is also positive, suggesting that this correlation explains the true existing association. In this case, according to Vencovsky and Barriga (1992), a direct selection for the causal factor (PC) would be efficient to improve the final trait, here ZnC. As the correlation was weak in relation to the direct effect, the negative indirect effects (NGP, W100G and CT) must have contributed to decrease the correlation between PC
and ZnC. Thus, to select for a higher ZnC, not only direct selection via PC, but also indirect selection via indirect positive effects (NDBF, GY and FeC) should be applied.
The effects of FeC and CT on ZnC were minor, agree-ing with the low correlations. This suggests that selection for these traits via direct gains in ZnC would be inefficient. The results indicate that, for the populations under study, breeding for larger grain size, higher number of grains per pod and grain yield, and reduced cooking time and number of days to flowering may lead to decreases in grain iron and zinc levels. Genetic gains for iron content can be obtained by direct selection of PC by indirect effects of NGP, W100G and GY. The positive direct effect on grain size and protein content on the zinc content indicates that simultaneous gains via combined selection of these three traits are possible.
The estimates of the direct and indirect effects found in this study helped understand the real cause of the correla-tions between the explanatory variables and the grain iron and zinc levels in the cowpea populations studied. This will be useful, underlying the selection of the cowpea breeding program, to develop biofortified cultivars with excellent agronomic characteristics.
ACKNOWLEDGEMENTS
The authors are indebted to the biofortification programs HarvestPlus and AgroSalud and Research Fund Embrapa-Monsanto/Projeto BioFort for the financial support.
Análise de trilha dos teores de ferro e zinco e outros caracteres em feijão-caupi
Resumo – O objetivo desse trabalho foi estimar os efeitos diretos e indiretos de caracteres agronômicos e culinários sobre os teores de ferro e zinco em onze populações de feijão-caupi. Estimativas de correlações e suas decomposições em efeitos diretos e indiretos foram realizadas por meio da análise de trilha. Para as populações em estudo, o melhoramento para o aumento do tamanho do grão, número de grãos por vagem e produtividades de grãos e redução do tempo de cocção e número de dias para a floração podem levar a decréscimos nos teores de ferro e zinco no grão. Ganhos genéticos para o teor de ferro podem ser obtidos pela seleção direta do teor de proteína via efeitos indiretos do número de grãos por vagem, peso de 100 grãos e produtividade de grãos. O efeito direto positivo do tamanho e do teor de proteína do grão sobre o teor de zinco indica que é possível obter ganhos simultâneos via seleção combinada desses caracteres.
Palavras-chave: Vigna unguiculata, correlação, seleção, melhoramento, biofortificação.
REFERENCES
Ajeigbe HA, Ihedioha D and Chikoye D (2008) Variation in
physico-chemical properties of seed of selected improved varieties of cowpea
as it relates to industrial utilization of the crop. African Journal of
Biotechnology 7: 3642-3647.
Asante IK, Adu-Dapaah H, Addison P (2004) Seed weight and protein
and tannin contents of 32 cowpea accessions in Ghana. Tropical
Science 44: 77-79.
Association of Official Analytical Chemists (1990) Official methods of
analysis. Editora AOAC, Virginia, 1298p.
Baghizadeh A, Tallei A and Ghasemi E (2010) Evaluation of genetic
variability for yield and some quantitative traits in Iran cowpea collection.
Agriculture and Biology Journal of North America1: 625-629.
Bezerra AAC, Anunciação Filho CJ, Freire Filho FR and Ribeiro VQ (2001)
Inter-relação entre caracteres de caupi de porte ereto e crescimento
Blair MW, Austudillo C, Grusak MA, Graham R and Beebe SE (2009) Inheritance of seed iron concentrations in common bean (Phaseolus vulgaris L.). Molecular Breeding 23: 197-207.
Borges V, Sobrinho FS, Lédo FJS and Kopp MM (2011) Associação entre caracteres e análise de trilha na seleção de progênies de meios-irmãos de Brachiaria ruziziensis. Revista Ceres 58:765-772.
Boukar O, Massawe F, Muranaka S, Franco J, Maziya-Dixon B, Singh B and Fatokun C (2011) Evaluation of cowpea germplasm lines for protein and mineral concentrations in grains. Plant Genetic
Resources: Characterization and Utilization 9: 515-522.
Carbonell SAM, Carvalho CRL and Pereira VR (2003) Qualidade tecnológica de grãos de genótipos de feijoeiro cultivados em diferentes ambientes.Bragantia 62: 369-379.
Coelho CMM, Zílio M, Piazzoli D, Farias FL, Souza CA and Bortoluzzi RLC (2007) Influência das características morfológicas e físicas dos grãos de feijão (Phaseolus vulgaris L.) na sua capacidade de hidratação e cocção. Revista Brasileira de Biociências 5: 105-107.
Coimbra JLM, Benin G, Vieira EA, Oliveira AC, Carvalho FIF, Guidolin AF and Soares AP (2005) Consequências da multicolinearidade sobre a análise de trilha em canola. Ciência Rural 35: 347-352.
Correa AM, Ceccon G, Correa CMA and Delben DS (2012) Estimativas de parâmetros genéticos e correlações entre caracteres morfológicos e morfoagronômicos. Revista Ceres 59: 88-94.
Cruz CD, Regazzi AJ and Carneiro PCS (2004) Modelos biométricos
aplicados ao melhoramento genético. Editora UFV, Viçosa, 390p.
Cruz CD (2006) Programa genes: estatística experimental e matrizes. Editora UFV, Viçosa, 285p.
Falconer DS and Mackay TFC (1996) Introduction to Quantitative
Genetics. Longman, Harlow, 464p.
Freire Filho FR, Rocha MM, Ribeiro VQ, Rocha MM, Damasceno-Silva KJ, Nogueira MSR and Rodrigues EV (2011) Feijão-caupi no Brasil: produção, melhoramento genético, avanços e desafios. Embrapa Meio-Norte, Teresina, 84p.
Griffiths AJF, Gelbart WM, Miller JH and Lewontin RC (2001) Genética
Moderna. Guanabara Koogan, Rio de Janeiro, 589p.
Kar N, Hazra P, Dasgupta T and Som MG (2000) Study on the relationship between protein content and pod yield in cowpea. Indian
Agriculturist 44: 59-62.
Kumari RU, Usharani KS, Suguna R and Anandakumar CR (2010) Relationship between the yield contributing characters in cowpea for grain purpose [Vigna unguiculata (L.) Walp.]. Electronic Journal of
Plant Breeding1: 882-884.
Kurek AJ, Carvalho FIF, Assmann IC, Marchioro VS and Cruz PJ (2001) Análise de trilha como critério de seleção indireta para rendimento de grãos em feijão. Revista Brasileira de Agrociência7: 29-32.
Mamiro PS, Mbwaga AM, Mamiro DP, Mwanri AW and Kinabo JL (2011) Nutritional quality and utilization of local and improved cowpea varieties in some regions in Tanzania. African Journal of Food,
Agriculture and Development 11: 4490-4506.
Manggoel W, Uguru MI, Ndam ON and Dasbak MA (2012)Genetic
variability, correlation and path coefficient analysis of some yield
components of ten cowpea [Vigna unguiculata (L.) Walp] accessions.
Journal of Plant Breeding and Crop Science 4:80-86.
Montgomery DC and Peck EA (1981) Introduction to linear regression
analysis. John Wiley, New York, 504p.
Moreira PX, Barbosa MM, Gallão MI, Lima AC, Azeredo HMC and Brito ES (2008) Estrutura e composição química do feijão-caupi (Vígna unguiculata (L.) Walp). InBrito ES (ed.) Feijão-caupi. Embrapa Agroindústria Tropical, Fortaleza, p.11-23.
Oliveira FJ, Anunciação Filho CJ, Bastos GQ, Reis OV and Teófilo EM (2003) Caracteres agronômicos aplicados na seleção de cultivares de caupi. Revista Ciência Agronômica34: 44-50.
Peksen E and Artik A (2004) Comparison of some cowpea (Vigna
unguiculata L. Walp.) genotypes from Turkey for seed yield and yield-related characters. Journal of Agronomy3: 137-140.
Rocha MM, Freire Filho FR, Damasceno-Silva KJ, Ribeiro VQ, Barreto ALH, Franco LJD, Bassinelo PZ, Nutti MR and Carvalho JLV (2008) Avaliação dos conteúdos de proteína, ferro e zinco em
germoplasma elite de feijão-caupi. Embrapa Meio-Norte, Teresina,
3p. (Comunicado Técnico, 212).
Sarruge JR and Haag HP (1974) Análise química em plantas. Editora ESALQ, Piracicaba, 54p.
Severino LS, Sakiyama NS, Pereira AA, Miranda GV, Zambolim L
and Barros UV (2002) Associações da produtividade com outras
características agronômicas de café (Coffea arabica L. “Catimor”).
Acta Scientiarum Agronomy 24: 1467-1471.
Silva JAL and Neves JA (2011) Produção de feijão-caupi semi-prostrado em cultivo de sequeiro e irrigado. Revista Brasileira de Ciências
Agrárias 6: 29-36.
Sheela MS and Gopalan A (2006) Association studies for yield and its related traits of fodder cowpea in F4 generation. Journal of Applied
Sciences Research 9: 584-586.
Udensi O, Edu EA and Ikpeme EV (2011) Optimization of correlation and coefficient analyses as selection techniques for yield in locally grown cowpea [Vigna unguiculata (L) Walp.]. International Journal
of Current Research 3:162-165.
Vencovsky R and Barriga P (1992) Genética biométrica no