Vol.52, n. 3: pp.541-548, May-June 2009
ISSN 1516-8913 Printed in Brazil BRAZILIAN ARCHIVES OF
BIOLOGY AND TECHNOLOGY
A N I N T E R N A T I O N A L J O U R N A L
Mineral Composition and Dry Mass Production of the Corn
Plants in Response to Phosphorus Sources and Aluminum
Concentration
Marcelo Augusto Batista
1*, José Carlos Pintro
1, Antonio Carlos Saraiva da Costa
1, Cássio
Antonio Tormena
1, Carlos Moacir Bonato
2and Michelli Fernandes Batista
11Departamento de Agronomia; Universidade Estadual de Maringá; Maringá - PR - Brasil. 2Departamento de
Biologia; Universidade Estadual de Maringá; 87020-900; Maringá - PR - Brasil
ABSTRACT
The corn plants were evaluated with different phosphate fertilizer sources and aluminum (Al) concentrations in a sandy substrate. A totally randomized experiment design was set up with two corn plants in the pots containing 2 kg of a sandy substrate, two phosphate sources (Triple Super Phosphate – TSP or Arad Phosphate – AP) and four Al concentrations. When Al concentrations increased, pH (CaCl2) substrate values decreased. There was an increase in the calcium and phosphorus contents in the sandy substrates that received the TSP and AP sources. The calcium, magnesium, phosphorus, and potassium concentrations of the corn plant’s shoot were higher in the TSP than without P and AP sources. When the Al concentration increased, the concentration values of the former elements decreased. The dry mass production of the corn plants responded positively to P sources. As the Al concentration increased, the dry mass values decreased significantly in the TSP source.
Key words: Zea mays, phosphate fertilizers, solubility, toxicity
* Author for correspondence: [email protected]
INTRODUCTION
The soils in the tropical region are usually acidic and contain high Al values and phosphorus deficiency (Sanchez and Salinas, 1981). When productivity is taken into account, the low response of the th crops to the fertilizers is largely due to the toxic levels of aluminum (Al) in the soil (Calbo and Cambraia, 1980). Al toxicity has been recognized, for a long time, as the main limiting factor of the plant growth in the acidic soils (Hartwell and Pember, 1918; Magistad, 1925). Al reduces the plant development as a whole (Randall
may occur both in the cell wall and externally in the plasma membrane of the root cap cells (McCornmick and Borden, 1972) or internally in the vacuole of the roots cells (Macklon and Sim, 1992). In addition, Al may reduce the solubility of P compounds in the external solution near the roots while it becomes less available to the plants (Pavan and Bingham, 1982; Camargo, 1985). The interactions between the P and Al, which affect plant growth in acid soil conditions, have been studied by several authors. For example, high levels of the P fertilizers may reduce the effects of Al toxicity owing to the formation of complexes with low chemical activity (Alva et al., 1986). The efficiency of the phosphate fertilizers depends on different factors related to their intrinsic characteristics, soil properties, management practices and plant characteristics (Khasawneh and Doll, 1978; Chien and Menon, 1995; Rajan et al., 1996). One of the commercial classifications of the phosphate fertilizers is their solubility in the water. For instance, Triple Super Phosphate (TSP) presents high water solubility, an Arad Phosphate (AP) shows low water solubility (Malavolta, 1981). These differences may affect uptake of the P by the plant (Goedert et al., 1986; Goedert and Souza, 1984). Recently, Pintro et al. (2004) working with the clayey soil in different P sources (TSP, AP and Tricalcium Phosphate) and Al saturation levels (86, 29 and 0%) observed the alterations in the corn dry mass production, soil and plant chemical attributes.
This work evaluated the influence of different phosphate fertilizer sources and levels of Al on dry mass production and mineral composition of the corn plants in a greenhouse experiment.
MATERIAL AND METHODS
The substrate was basically composed of sandy dried at the room temperature, sifted (2mm-mesh) and homogenized. The substrate samples were collected for the physical and chemical analysis (Embrapa, 1997).
The experimental design consisted of totally
randomized factorial block with three sources
of the P x four Al concentrations and four
replicates. The analysis of variance used
Tukey’s test to determine the statistical
significance at 5% probability by the SAS
software
(SAS
Institute,
1991).
Two sources of P were tested: Triple Super
Phosphate (TSP) and Arad Phosphate (AP). A
single P dose of 150 mg kg
-1and an additional
treatment without the P (WP) were used. Al
solution prepared from the AlCl
3.6H
2O p.a.
was applied to the substrate at four different
doses: 0, 25, 50 and 100 mg kg
-1substrate.
Four corn seeds (hybrid AS-3477) were sown
per pot (2 kg of substrate). Twelve days after
the emergence, the plants were thinned to two
uniformly-sized plants per pot. The substrate
was fertilized by a basic nutrient solution with
the following composition: N = 150; K = 150;
S = 38; Ca = 75; Mg = 38; Mo = 0.11; Zn = 3;
B = 0.61; Cu = 1; Fe = 1.16 mg kg
-1substrate
(NOVAIS et al., 1991) split in three
applications (5, 10 and 20 days). The
experimental units were irrigated with the
distilled water, when necessary. The plants
were harvested after 35 days; the roots and
shoots were separated; dried to constant
weight at 70
oC, and weighed. The samples of
the plant’s dry mass were chemically analyzed
according to Malavolta et al. (1997). At the
same time, the substrate samples were
collected, dried, sifted and submitted to the
same chemical analysis of the original
substrate, following Embrapa (1997).
RESULTS AND DISCUSSION
Results of the particle size distribution were: sand
= 880; silt = 10; clay = 110 g kg-1. The chemical
analysis results were: pH in CaCl2 0.01 mol L-1
(1:2.5) = 6.1; P = 4 mg dm-3; organic carbon =
0.36 g dm-3; H+ + Al3+ = 1.49; Al3+ = 0; Ca2+ +
Mg2+= 1.49; Ca2+ = 1.14; K+ = 0.03 cmol
c dm-3;
sum of bases (SB = Ca2+ + Mg2+ + K+) = 1.52
cmolc dm-3 and cation exchange capacity (CEC =
SB + H+ + Al3+) = 3.01 cmolc dm-3.
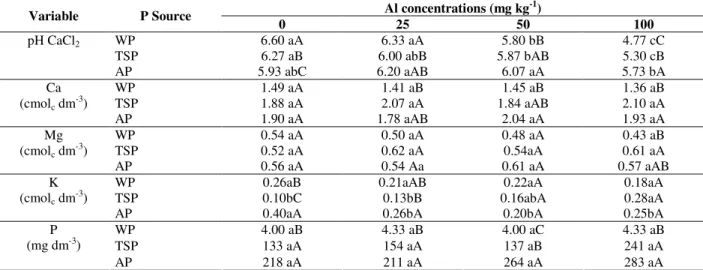
Table 1 shows the substrate’s chemical analysis
after the experimental period. The pH (CaCl2)
values decreased in proportion to an increase in the Al concentration values in the WP and in the TSP sources. Pintro et al. (2004), working with a clayey soil observed similar results. The AP source also presented some variations but statistical difference
(P <0.05) was only observed in the treatment with
sources were mutually compared, pH values were significantly higher in the WP source than in the AP
or in the TSP source at the Al 0 and 25 mg kg-1
concentrations (Table 1). Regarding the Al, the TSP source had a higher acidification process than that of the AP source. The same behavior was not observed (Pintro et al., 2004) for the same P sources (TSP and AP) when the substrate had higher buffer capacity due to the presence of the organic matter and iron oxides (Novais and Smyth, 1999). Taking the TSP source into account, the acidification process has also been reported by Malavolta (1981) and Ernani et al. (2001).
For the same P source, no significant differences
(P<0.05) in the Ca concentrations values in the
substrate were reported as the Al concentration increased (Table 1). Since they have Ca in their
chemical compositions (14% and 20%,
respectively), Ca numerical values in the substrate were higher and/or significantly higher in the TSP and AP sources than in the WP treatment (COAMO, 1998).
Mg values in the substrate were not affected by the P sources and Al concentration. An exception was
noted in the TSP source at 100 mg kg-1 of Al,
where the Mg value was significantly higher
(P<0.05) than that in WP (Table 1).
K values in the substrate, fertilized with the TSP source, increased with the Al doses (Table 1). This variation was related to the dry mass production of the corn plants which, in the TSP source, was inversely related to the Al dose applied to the substrate. In the AP source, the K values in the
substrate decreased with an increase in the Al doses. The highest numerical K value in the substrate with the AP source was observed in the treatment without Al, followed by 25, 100 and 50
mg Al kg-1 dose treatments. When the P sources in
the same Al dose were compared, the 0 and 25 mg
kg-1 doses revealed similar decreasing order of the
K values, AP < WP < TSP. No statistical difference existed between the K concentrations in P sources in the remaining Al doses (50 and 100
mg kg-1). The AP had high Ca and Mg
concentrations (20 and 15%, respectively) which were important to K absorption dynamics. With
regard to the lowest Al doses (0 and 25 mg kg-1),
Ca and Mg values, observed in the AP source, might have influenced the negative K absorption. The P values in the substrate were not affected by the Al concentrations. However, P values in the same Al concentration were significantly higher in the TSP and AP sources than in the WP treatment (Table 1) (Pintro et al. 2004). Although there was no significant difference between the TSP and AP
sources, except at 50 mg kg-1 of the Al, in which
the AP source was significantly higher than that in the TSP (Ernani et al. 2001). A higher P value availability in the substrate which received the AP source could be justified by the fact that the P was analyzed by means of an acid extractor, i.e.
Mehlich-1 (HCl 0.05 N + H2SO4 0.025 N) which
dissolved calcium phosphate particles present in the AP fertilizer, and thus overestimated the P availability to the plants (Ernani et al., 2001).
Table 1 - Substrate Chemical Analysis Where Corn Plants Were Cultivated for 35 Days Using Different Phosphate
Sources and Aluminum (Al) Concentrations.
Al concentrations (mg kg-1)
Variable P Source
0 25 50 100
WP 6.60 aA 6.33 aA 5.80 bB 4.77 cC
TSP 6.27 aB 6.00 abB 5.87 bAB 5.30 cB
pH CaCl2
AP 5.93 abC 6.20 aAB 6.07 aA 5.73 bA
WP 1.49 aA 1.41 aB 1.45 aB 1.36 aB
TSP 1.88 aA 2.07 aA 1.84 aAB 2.10 aA
Ca (cmolc dm-3)
AP 1.90 aA 1.78 aAB 2.04 aA 1.93 aA
WP 0.54 aA 0.50 aA 0.48 aA 0.43 aB
TSP 0.52 aA 0.62 aA 0.54aA 0.61 aA
Mg (cmolc dm-3)
AP 0.56 aA 0.54 Aa 0.61 aA 0.57 aAB
WP 0.26aB 0.21aAB 0.22aA 0.18aA
TSP 0.10bC 0.13bB 0.16abA 0.28aA
K (cmolc dm-3)
AP 0.40aA 0.26bA 0.20bA 0.25bA
WP 4.00 aB 4.33 aB 4.00 aC 4.33 aB
TSP 133 aA 154 aA 137 aB 241 aA
P (mg dm-3)
AP 218 aA 211 aA 264 aA 283 aA
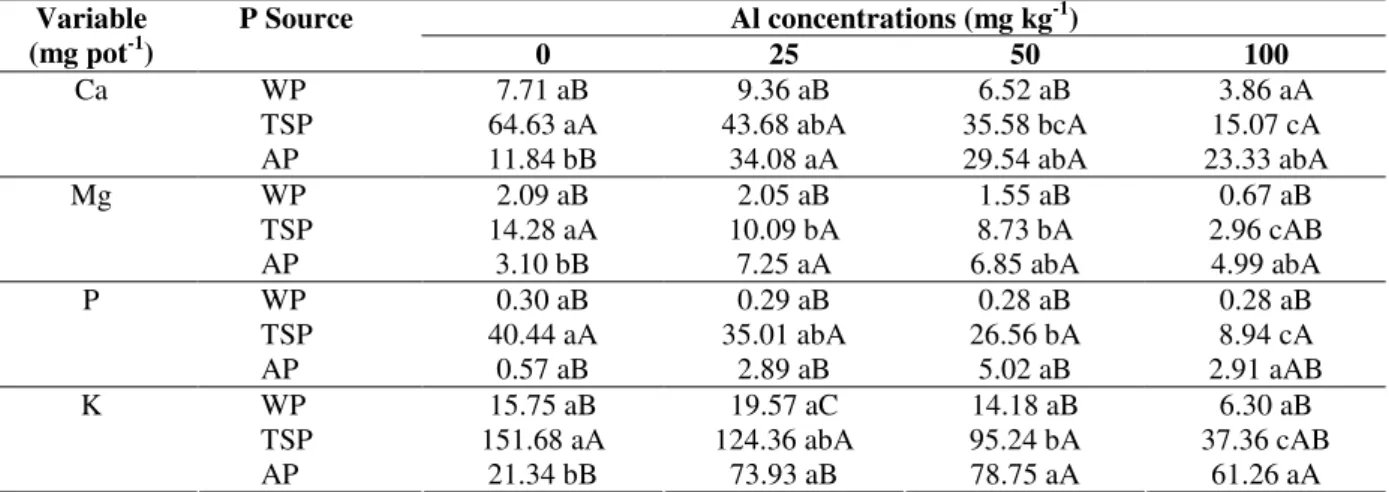
Table 2 presents the amount of the mineral elements in the plant’s shoot. Although the Al levels increased, no significant difference in the Ca and Mg values in the WP treatment occurred. On the other hand, with the increasing Al doses, the Ca and Mg values in the shoot of the corn plant in TSP source were significantly reduced (Table 2). With regard to the AP source, the Ca and Mg values were significantly higher in the treatments with the Al than in those without it.
With the increasing Al concentrations in the substrate, a significant reduction occurred in the P amount in the shoot of the corn plant’s shoot, albeit only in the TSP source (Table 2). When the P sources were compared at the same Al concentration level, the P values in the shoot were higher in the TSP source than in the control (WP) or AP source. Significant reduction in the P values in the shoot of the corn plant’s shoot on the increase of the Al concentration in the substrate
could be justified by the formation of the low solubility compounds between P from TSP and Al in the substrate and/or on the surface of the corn plant’s roots (Helyar, 1978; Calbo and Cambraia, 1980; Roy et al., 1994).
As the Al concentration increased in the substrate, the K values in the shoot of the corn plant failed to decrease significantly in the treatment without the P (WP) (Table 2). On the other hand, when the
concentrations were 50 and 100 mg kg-1 in the
TSP source, the K values were significantly lower
than the Al concentrations 0 and 25 mg kg-1. It
could be noted that in the AP source, the K values in the shoot of the corn plant were higher with the Al than without it. When the P sources were compared, the K values in the shoot were higher in the TSP than in the WP and AP source, except at
the Al concentration 100 mg kg-1, where the AP
source showed the highest values.
Table 2 - Mineral Composition of Corn Plant Shoot Cultivated for 35 Days Using Different Phosphate Sources and
Aluminum (Al) Concentrations.
Al concentrations (mg kg-1)
Variable
(mg pot-1)
P Source
0 25 50 100
WP 7.71 aB 9.36 aB 6.52 aB 3.86 aA
TSP 64.63 aA 43.68 abA 35.58 bcA 15.07 cA
Ca
AP 11.84 bB 34.08 aA 29.54 abA 23.33 abA
WP 2.09 aB 2.05 aB 1.55 aB 0.67 aB
TSP 14.28 aA 10.09 bA 8.73 bA 2.96 cAB
Mg
AP 3.10 bB 7.25 aA 6.85 abA 4.99 abA
WP 0.30 aB 0.29 aB 0.28 aB 0.28 aB
TSP 40.44 aA 35.01 abA 26.56 bA 8.94 cA
P
AP 0.57 aB 2.89 aB 5.02 aB 2.91 aAB
WP 15.75 aB 19.57 aC 14.18 aB 6.30 aB
TSP 151.68 aA 124.36 abA 95.24 bA 37.36 cAB
K
AP 21.34 bB 73.93 aB 78.75 aA 61.26 aA
Means followed by the same upper-case letter (vertical) and lower-case letter (horizontal) indicate no significance at 5% of probability (Tukey test). (WP – without P; TSP - Triple superphosphate; AP – Arad Phosphate).
The corn shoot’s dry mass production in the WP substrate was not affected by the Al concentrations (Fig. 1A). Otherwise, the increment of the Al determined high inhibition rate in the shoot growth when the TSP source was used. The TSP-treated plants presented higher nutrient concentrations
values, with the exception of Mg at 100 mg kg-1.
On the other hand, as the Al concentration increased in the TSP source, the shoot’s dry mass values decreased significantly.
In the case of the AP source, since Al
concentration ranged from 25 to 50 mg kg–1 in the
substrate, the shoot dry mass production increased
significantly when compared to the control
(without Al). At 100 mg kg–1 Al concentration, the
shoot’s dry mass production decreased, although
the values did not differ from 0 and 25 mg kg-1 Al
treatments. The values of the shoot’s dry mass were higher in the TSP when compared to the WP
or in AP source, at least up to 50 mg kg-1 Al
concentration (Fig. 1A). A similar behavior was
shown in the response of triticale plants to the Al
was significantly higher at Al 50 mg kg-1 in the AP
source than without Al and at 100 mg kg-1 Al
treatments. A positive interaction between the P from the AP and Al in the above P source increased the shoot’s dry mass production (Fig. 1A). Salvador et al. (2000) showed that, when the
Al in the nutrient solution ranged from 5 to 10 mg
kg-1, the growth and development of the guava
plants were higher than in the control (without Al) and when the Al concentrations ranged from 20 to
25 mg kg-1.
S
h
o
o
t
D
ry
M
a
ss
(
g
p
o
t
-1)
0 1 2 3 4
5 WP
AP TSP
Al (mg kg-1)
R
o
o
t
D
ry
M
a
ss
(
g
p
o
t
-1)
0 1 2 3
0 25 50 100
aB bB
aA
aC abB
aA
aB
bAB bA
aB cA
aC
aB aB
aA
aB abA
aA
aB aA
bA
aB aA
bAB
A
B
Figure 1 - Dry mass of corn plants (A - shoot and B - roots) cultivated using different commercial
phosphate fertilizers and aluminum concentrations. Means followed by the same upper-case letter indicate no significance at 5% of probability (Tukey test) between phosphate sources and for each Al concentration value. Means followed by the same lower-case letter indicate no significance at 5% of probability (Tukey test) between Al concentration values and for each phosphate source. (WP – without P; AP – Arad
phosphate; TSP - Triple superphosphate).
The increase in the shoot and dry matter
production in the Al 25 to 50 mg kg-1 doses could
partially be explained by the steady and increasing P availability by the AP source which protected the cell’s membrane against the Al toxic actions. The AP source could be another possibility, different than the TSP source, which would gradually and continuously be bound to the Al and precipitate it.
Fig. 1B show results of the root’s dry mass production. When the Al concentration increased, the shoot’s dry mass production was significantly and continuously reduced only at the TSP source. Other P sources failed to present the same negative influence on the values of the root’s dry mass. The highest values for the root dry mass were reported in the TSP source and without Al treatment. As the
Al concentration increased, the root’s dry mass production decreased significantly. The dry mass root production for the AP and TSP treatments were
not statistically different (P>0.05) with 25 and 50
mg Al kg-1 substrate, i.e., these P sources made
available similar P concentrations in the solution. Similar behavior was not observed in the clayey tropical soils (Novais and Smyth, 1999; Pintro et al., 2004) due to the formation of inner sphere complexes between the iron and aluminum oxides and phosphorus. Rheinheimer et al. (1994) and Pintro et al. (1996), also recorded the reduction in the root’s dry mass due to the Al toxicity.
mass decreased significantly only in the TSP
source, more specifically in the 100 mg kg-1 Al
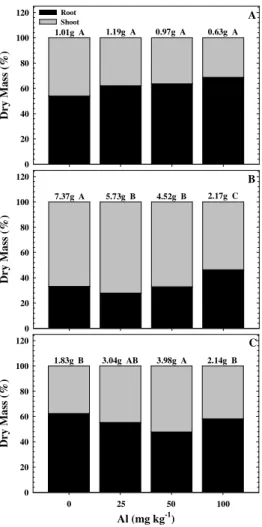
concentration. The contribution of roots and shoot (in relative values) to the total dry mass was influenced by the P sources and Al concentration in the substrate (Fig. 2).
When the Al concentration increased in the WP treatment, an increase was noted in the root participation (in relative values) in the total dry mass, with values ranging from 54 to 69% (Fig. 2A). This might have occurred because the root grown without P might have minor protection against the Al at the membrane level, since P was important for the structural integrity of the phospholipids in the membrane. The increase of the root’s dry mass may, in this case, denounced
greater Al damage, or rather, the Al activity could cause higher thickening rates to the radical and, consequently, greater total root weight. This meant that there was an increase in the root/shoot ratio in proportion to an increase in the Al concentration in the solution. In the TSP source, the total dry mass production was significantly reduced by increasing the Al concentrations. It was important to note that in this P source (TSP) the contribution of the root values was lower than 50% of the total dry mass values (Fig. 2B). The opposite occurred in the WP treatment (Fig. 2A). In the AP source, the total dry mass increased when the Al concentration ranged
from 0 to 50 mg kg–1 and decreased by 46% when
the Al ranged from 50 to 100 mg kg–1 (Fig. 2C).
D
ry
M
a
ss
(
%
)
0 20 40 60 80 100
120 Root
Shoot
1.01g A 1.19g A 0.97g A 0.63g A
A
D
ry
M
a
ss
(
%
)
0 20 40 60 80 100
120 B
7.37g A 5.73g B 4.52g B 2.17g C
Al (mg kg-1)
D
ry
M
a
ss
(
%
)
0 20 40 60 80 100
120 C
1.83g B 3.04g AB 3.98g A 2.14g B
0 25 50 100
Figure 2 - Distribution of the total dry mass of corn plants cultivated for 35 days using different
The values of the root participation in the total dry mass were higher than 50%, very similar to that reported in the WP treatment (Fig. 2A). The rates of the root participation were lower than 50%, but
only at 50 mg kg–1 of Al. Results of the current
investigation were different from those obtained by Zanata and Mundstock (1988), where the participation of the wheat roots in the total dry mass decreased when the Al concentration increased.
Phosphorus availability in the substrate of the AP source determined by Mehlich-1 extractor (Table 1) did not result in high P values in the shoot of the corn plant (Table 2) and in the dry mass production (Fig. 2C). Faria and Albuquerque (1989) observed that the Mehlich-1 extractor was not an appropriate method to evaluate the P availability to a buffel-grass pasture in the semi-arid northeastern Brazil, where partially acidulated phosphate was used as a P source. Conversely, it seemed that in the TSP source, a good correlation existed between the P availability in the substrate (Table 1), P values in the shoot of the corn plant (Table 2) and the total dry mass production (Fig. 1 and 2B).
In proportion to the increases in the Al concentration, the total dry mass of the corn plant decreased when the TSP source was used. On the other hand, when the AP source was taken into account, an increase in the total dry mass values occurred when the Al concentration ranged from 0
to 25 and 50 mg kg-1. Although the values of the
total dry mass in the AP source were lower than those in the TSP source, in relative terms, there was a positive interaction between the AP and Al, reducing the Al activity (i.e. its toxicity) up to 50
mg kg-1. Within this range (0 to 50 mg kg-1), no
negative influence on the dry mass production was reported, as was observed in the TSP source. In studies that involved the Al toxicity and P, the Al concentrations and P sources should be also taken into account. In this study, the TSP source decreased the shoot and root dry mass production with the increasing Al concentration, while the AP source did not present similar behavior.
ACKNOWLEDGMENTS
The financial support given by CNPq (Conselho Nacional de Pesquisa e Desenvolvimento), Brasília, DF, Brazil is appreciated.
RESUMO
Foram avaliadas plantas de milho submetidas a diferentes fontes de fertilizantes fosfatados e diferentes concentrações de alumínio em um substrato de areia. O experimento foi conduzido com duas plantas por vaso contendo 2 kg de areia, duas fontes de fósforo (Fosfato Supertriplo - TSP ou Fosfato de Arad - AP) e quatro concentrações de Al. Com o aumento das concentrações de Al
houve diminuição dos valores de pH (CaCl2) do
substrato. Os valores de cálcio e fósforo aumentaram no substrato nos tratamentos com TSP e AP. As concentrações de cálcio, magnésio, fósforo e de potássio das plantas de milho foram maiores em TSP do que nos tratamentos sem P ou com AP. Como o aumento da concentração de Al observou-se redução na concentração de cálcio, magnésio, fósforo e de potássio nas plantas. A produção de massa seca da parte aérea respondeu positivamente com as fontes de P. Com o aumentou da concentração de Al os valores de massa seca diminuíram significativamente com TSP.
REFERENCES
Adrew, C.S.; Berg, P.J.V. (1973), The Influence of aluminum on phosphate adsorption by whole plants and excised roots of some pasture legumes. Aust. J. Agric. Res., 24, 341-351.
Alva, A.K.; Edwards, D.G.; Asher, C.J.; Blamey, F.P.C. (1986),Effects of phosphorus/aluminum molar ratio and calcium concentration on plant response to aluminum toxicity.Soil Sci. Soc. of Am. J., 50,
133-137.
Calbo, A.G.; Cambraia, J. (1980), Efeito do alumínio sobre a composição mineral de dois cultivares de sorgo (Sorghum bicolor L. Moench). Rev. Ceres, 27,
369-378.
Camargo, C.E.O. (1985), A concentração de fósforo na tolerância de cultivares de trigo à toxicidade de alumínio em soluções nutritivas. Bragantia, 44,
49-64.
Chien, S.H.; Menon, R.G. (1995),Factors affecting the agronomic effectiveness of phosphate rock for direct application. Fertilizer Research, 41, 227-234.
Coamo. (1998), Fertilidade do solo e nutrição de plantas. Coamo/Coodetec. Campo Mourão, PR, Brasil.
Costa, A.; Campos, L.A.C.; Riede, C.R. (2003), Reaction of wheat genotypes to soil aluminum differential saturations. Braz. Arch. Biol. Technol.,
Embrapa. (1999), Manual de análises químicas de solos, plantas e fertilizantes. Embrapa, Brasília, DF, Brasil.
Ernani, P.R.; Steckling, C; Bayer, C. (2001), Características químicas de solo e rendimento de massa seca de milho em função do método de aplicação de fosfatos, em dois níveis de acidez. Rev. Bras. de Ci. Solo, 25, 939-946.
Faria, C.M.B.; Albuquerque, S.G. (1989), Fosfato parcialmente solubilizado em pastagem de capim-búfel no submédio São Francisco. Rev. Bras. de Ci. Solo, 13, 393-397.
Fleming, A.L. (1983), Amonnium upatke by wheat varieties differing in Al tolerance. Agron. J., 75,
726-730.
Goedert, W.J.; Souza, D.M.G. (1984), Uso de fertilizantes fosfatados. In-Simpósio sobre fertilizantes na agricultura brasileira. Brasília, ed. Espinoza, W; Oliveira, A.J. de. DF, 06-10 agosto 1984. EMBRAPA-DID, Brasília, DF. (Documentos, 14), pp. 255-290.
Hartwell, B.L.; Pember, F.R. (1918), The presence of aluminum as a reason for the difference in the effect of so-called acid soil on barley and rye. Soil Sci., 6, 259-281.
Helyar, K.R. (1978), Effects of aluminum and manganese toxicity on legume growth. In. Mineral nutrition of legumes in tropical and subtropical soils, ed. Andrew, C.S.; Kamprath, E.J.; CSIRO, Melborne, Australia, pp. 207-231.
Khasawneh, F.E.; Doll, E.C. (1978), The use of phosphate rock for direct application to soils. Adv. Agr., 30, 159-206.
Macklon, A.E.S.; Sim, A. (1992), Modifying effects of a non-toxic level of aluminum on phosphate fluxes and compartmentation in root cortex cells of intact ryegrass seedlings. J. Exp. Bot., 43, 1483-1490. Magistad, O.C. (1925), The aluminum content of the
soil solution and its realtion to soil reaction and plant growth. Soil Sci., 20, 181-227.
Malavolta, E. (1981), Manual de química agrícola: Adubos e Adubação. Editora Agronômica Ceres Ltda, São Paulo, Brasil.
Malavolta, E.; Vitti, G. C.; Oliveira, S. A. de. (1997), Avaliação do estado nutricional das plantas: princípios e aplicações. POTAFÓS, Piracicaba. Matsumoto, H.; Morimura, S. (1980), Repressed
template activity of chromatin of pea roots treated by aluminum. Plant Cell Physiol., 21, 951-959.
McCormick, L.H. (1974), The occurrence of aluminum phosphate precipitate in plant roots. Agron. J., 38,
931-934.
McCormick, L.H.; Borden, F.Y. (1972), Phosphate fixation by aluminum in plant roots. Soil Sci. Soc. Am. Proc., 36, 799-802.
Novais, R. F. de; Neves, J. C. L.; Barros, N. F. de. (1991), Ensaio em ambiente controlado. In-Métodos de Pesquisa em Fertilidade do Solo, ed. Oliveira, A. J. de; Garrido, W. E.; Araujo, J. D. de; Lourenço, S. Brasília: EMBRAPA-SEA, 189-253.
Novais, R. F.; Smyth, T. J. (1999), Fósforo em solo e planta em condições tropicais. UFV, Viçosa.
Pavan, M.A.; Binghan, F.T. (1982), Toxidez de alumínio em cafeeiros cultivados em solução nutritiva. Pesq. Agropec. Bras., 17, 1293-1302.
Pintro, J.; Barloy, J.; Fallavier, P. (1996), Aluminum effects on the growth and mineral composition of corn plants cultivated in nutrient solution at low aluminum activity. J. Plant Nutr., 19, 729-741.
Pintro, J.C.; Inoue, T.T., Tormena, C.A., Costa, A.C.S.; Silva, M.A.G. (2004), Mineral composition and dry mass production of corn plants affected by different phosphate sources and different soil aluminum saturation levels. J. Plant Nutr., 27, 2149-2158.
Quartin, V.L.; Azinheira, H.G.; Nunes, M.A. (2001), Phosphorus deficiency is responsible for biomass reduction of triticale in nutriente solution with aluminum. J. Plant Nutr., 24, 729-741.
Rajan, S.S.S.; Watkinson, J.H.; Sinclair, A.G. (1996), Phosphate rocks for direct application to soils. Adv. Agr., 57, 78-159.
Randall, P.J.; Vose, P.B. (1963), Effect of aluminum on uptake and translocation of phosphorus by perennial ryegrass. Plant Physiol., 38, 403-409.
Rheinheimer, D.S.; Petry, C.; Kaminski, J.; Bartz, H.R. (1994), Influência do estresse de alumínio em plantas de fumo: I. Efeito no sistema radicular, na absorção de fósforo e cálcio e no acúmulo de massa seca. Rev. Bras. de Ci. Solo, 18, 63-68.
Roy, A.K.; Sharma, A.; Talukder, G. (1994), Some aspects of aluminum toxicity in plants. Bot. Rev., 54, 145-177.
Salvador, J.O.; Moreira, A.; Malavolta, E.; Cabral, C.P. (2000), Influência do alumínio no crescimento e na acumulação de nutrientes em mudas de goiabeira. Rev. Bras. de Ci. Solo, 24, 787-796.
Sanchez, P.A.; Salinas, J.G. (1981), Low input technology for managing Oxisols and Ultisols in tropical America. Adv. Agr., 34, 280-406.
SAS Institute (1991), SAS/STAT procedure guide for personal computers. 5. ed. SAS Inst., Cary, N. C. Zanata, A.C.A.; Mundstock, C,M, (1988), Efeito dos
níveis de fósforo e alumínio sobre os sistemas aéreo e radicular do trigo. Pesq. Agropec. Bras., 23, 1355-1370.