Correlations and path analysis of yield components in cowpea
Adriano dos Santos¹*, Gessí Ceccon², Livia Maria Chamma Davide¹, Agenor Martinho Correa³ and Valdecir Batista Alves¹
Received 05 December 2012 Accepted 02 February 2014
Abstract – Obtaining correlations and direct and indirect effects of yield components is important for the selection of promising parental and segregating populations. The objective of this research was to estimate the genotypic and phenotypic correlations, and to analyze the direct and indirect effects of yield components on grain yield in 20 cowpea (Vigna unguiculata) genotypes. The experi-mental design was in randomized blocks with 20 treatments and 4 replications. The character showed low to moderate possibility of gain from indirect selection, with greater possibility for success when joining multiple character and a genotype of better performance.
Key words: Correlation analysis, indirect selection, Vigna unguiculata.
Crop Breeding and Applied Biotechnology 14: 82-87 2014 Brazilian Society of Plant Breeding. Printed in Brazil
ARTICLE
http://dx.doi.org/10.1590/1984-70332014v14n2a15
¹ Universidade Estadual do Norte Fluminense Darcy Ribeiro, Avenida Alberto Lamego, no 2.000, Parque Califórnia, 28.013-602, Campos dos Goytacazes, RJ, Brazil *E-mail: [email protected]
² Embrapa Agropecuária Oeste - CPAO, Caixa Postal 661, 79.804-970, Dourados, MS, Brazil
³ Universidade Estadual de Mato Grosso do Sul (UEMS), Rod. Aquidauana - CERA, km 12, 79.200-000, Aquidauana, MS, Brazil INTRODUCTION
Cowpea beans have become a good second crop option for farmers in the Center West region of Brazil, following traditional crops such as soybeans and corn. It has low production cost, good adaptation to rainfall pattern and the possibility of mechanized harvest (Freire Filho et al. 2008). This increase in the importance of the crop has been noted by breeders, who have sought to develop cultivars with better performance of agronomic character, especially in regard to yield.
Yield is a complex character, the result of the expression and association of different character, which are highly
in-fluenced by the environment (Amorim et al. 2008). Artificial selection for character of low heritability and with difficult
estimation of gene action should be practiced in advanced generations with reduced frequency of heterozygosity (Al-lard 1999). Nevertheless, indirect selection by means of less complex character with greater heritability and easy measurement may result in greater genetic progress in com-parison to the use of direct selection (Hartwig et al. 2007). For this reason, breeders may adopt indirect selection for quantitative character with low heritability, a selection through correlated characters (Hamawaki et al. 2012). Correlation allows evaluation of the degree of association between two characters and the viability of indirect selection,
which, in some cases, may lead to a progress faster than selection for the desired character (Cruz and Regazzi 2006).
In spite of being an easily obtained statistical parameter, care must be taken in interpreting the magnitude of a correla-tion since it is hampered by the direccorrela-tion, by the difference in importance of the character, by the effect of two or more character, and by the effect of environment on expression of the character. In addition, correlation does not allow inferences regarding cause and effect, and so knowledge of the type of association that governs the pair of character is not possible (Furtado et al. 2002).
This information, which is indispensable for breeding, can be obtained by means of path analysis. This analysis allows a breakdown of the estimated correlations in direct and indirect effects of each character on a basic variable (Hartwig et al. 2007). The success of this analysis is in the formulation of the cause and effect relationship between the characters studied (Silva et al. 2005), which depends on prior knowledge of the researcher. With these data in hands, it is possible to identify the best selection strategy of superior genotypes of a plant genetic breeding program.
MATERIAL AND METHODS
The experiment was carried out with 20 cowpea bean genotypes of prostrate (climbing) and semi-prostrate (semi-climbing) plant type, with 15 advanced lines and 5 commercial varieties originating from the germplasm bank of Embrapa Meio Norte (Table 1). Studies were conducted in two municipalities of Mato Grosso do Sul (Aquidauana and Dourados), Brazil, in the fall-winter period of 2010.
Aquidauana is located in the Pantanal (tropical wetland) of Mato Grosso do Sul, with average altitude of 174 m; the climate is Tropical Wet and Dry or Savanna (Aw),
accord-ing to the Köppen classification, with annual rainfall from
1200 to 1300 mm, and annual mean temperature of 26 ºC.
The experiment was carried in the experimental field of the
Universidade Estadual de Mato Grosso do Sul, in Aquidauana city, in a soil Distrophic Red Yellow Podzolic/Typic.
Dourados is located in the high plains zone of the state, including the southern part of the Central West region, with average altitude of 400m; Cwa climate type (humid
subtropical), according to the Köppen classification, with
rainy summer and dry winter; mean annual rainfall of 1500 mm; and annual mean temperature of 22 ºC. The
experi-ment was carried out in the experiexperi-mental field of Embrapa
Agropecuária Oeste, in an Oxisol/Hapludox.
A randomized block experimental design with 20 treat-ments and 4 replications was used. The experimental unit
consisted of four five-meter rows, spaced at 0.50 m, with
the two center rows as useful area. In Aquidauana, sowing was performed manually on April 17th, 2010, with a density of 16 seeds per meter. One week after emergence, manual thinning was performed, leaving 8 plantlets per meter, obtaining a population of 160,000 plants per hectare. In Dourados, sowing was performed on February 6th, 2010, with a density of 8 seeds per meter, using a plot seeder.
Harvest of plants was carried out manually and evaluated
for the following character: number of days to flowering
(DF), number of days to maturity (DM), green pod length
(GPL), average pod length in cm of five randomly chosen
plants at physiological maturity; pod weight (PW), consider-ing the average weight in grams of previously chosen pods; 100 seed weight (HSW); number of beans per pod (NBP), performed by counting the beans in the pods collected for the previous samples; average number of pods per plant (NPP), considering the average of the pods collected from
five plants, and grain yield at 13% moisture (YLD).
Initially, analysis of variance was carried out for each environment separately, verifying the uniformity of residual variance; then, joint analysis of variance was performed, considering the effects of genotypes and environments as
fixed, and estimating the genotypic correlations. The phe -notypic and ge-notypic variances were estimated, as well as
their respective coefficients of variation.
The degree of multicollinearity of the X’X matrix was
Table1. Listing of prostrate and semi-prostrate plant type cowpea bean genotypes used in the experiment
Line Parents/origin Market class
MNCO1-649F-1-3 TE96-282-22G X IT81D-1332 Striped
MNCO1-649F-2-1 TE96-282-22G X IT81D-1332 Striped
MNCO1-649F-2-11 TE97-309G-24 X MNC01-608D-2-5 Striped
MNCO2-675-4-9 TE97-309G-24 X TE96-406-2E-28-2 Brown
MNCO2-675F-9-5 TE97-309G-24 X TE96-406-2E-28-2 Brown
MNCO2-676F-1 TE97-309G-24 X EVx91-2E-2 Brown
MNCO2-677F-2 TE97-309G-24 X TE96-406-2E Ever Green
MNCO2-677F-5 TE97-309G-24 X TE96-406-2E Brown
MNCO2-680F-1-2 TE97-309G-24 X IT91K-118-2 Ever Green
MNCO2-689F-2-8 TE97-309G-24 X MNC00-519D-2-1-1 Ever Green
MNCO2-701F-2 TE93-210-13F X (TE96-282-22G X COSTELÃO) White
MNCO3-736F-2 (TE97-309G-24 X IT90N-284-2) X TE96-282-22G White
MNCO3-736F-6 (TE97-309G-24 X IT90N-284-2) X TE96-282-22G White
MNCO3-761F-1 TE96-282-22G X VITA-7 Ever Green
PINGO DE OURO-1-2 IGUATU, CE Canapu
BRS-XIQUEXIQUE TE87-108-6G X TE87-98-8G White
BRS-JURUÁ GV-10-1-1-1 X TE93-222-11F Green
BRS-ARACÊ MNC00-599F-11 X MNC99-537F-14-2 Green
BRS-GURGUÉIA BR10-PIAUÍ X CE-315 Ever Green
established based on its number of conditions (NC), which is the ratio between the greatest and the least eigenvalue of the X’X correlation matrix (Montgomery and Peck 1981). This criterion considers that multicollinearity will be weak between the explanatory variables only when the ratio between the greatest and the least eigenvalue is lower than or equal to 100. When the NC resulting from this division is 100<NC<1,000 multicollinearity is considered to be
moderate to severe, and for NC≥1,000, multicollinearity is
considered to be severe. The value obtained was 52.0263,
being classified as weak collinearity.
After the establishment of the basic path analysis equa-tions, resolution in the matrix form was obtained according
to the equation: X’Xβ = X’Y, where X’X is a non-singular
matrix of the correlations between the primary variables;
β is the column vector of path coefficients, and X’Y is the
column vector of the correlations between the explanatory variables and the dependent variable.
The correlation between the dependent variable and the explanatory variables was estimatedby equation (1):
(1)
being rix the correlation between the dependent variable, and the i-th explanatory variable;Pix is the direct effect of the i variable on the dependent variable; rjPjx is the indirect effect of the i variable by j variable under the dependent variable. The last square solution of this system is given
by the equation: β = (X’X)-1 (X’Y).
The hypothesis considered for path analysis was: the grain yield variable as the dependent variable, and the
others as explanatory variables, with number of beans per pod, number of pods per plant; and one hundred seed weight being considered as primary variables, and days to
flowering, days to maturity, pod length and pod weight as
secondary variables. All statistical analysis was performed with use of the Genes program (Cruz 2006).
RESULTS AND DISCUSSION
Analysis of variance showed the existence of genetic variability among the genotypes evaluated since the effect
of genotypes was significant for all the character evalu -ated, except for hundred seed weight (HSW) (Table 2). In
a breeding program, quantification of genetic variability
of a population is a determining factor since it reveals the genetic structure of the populations.
The coefficients of heritability based on the mean of
families (hˆ 2
x) showed magnitudes from moderate to high for the character of days to flowering (DF), green pod length
(GPL), number of beans per pod (NBP), number of pods per
plant (NPP) and hundred seed weight (HSW), confirming
that most of the phenotype is attributed to genetic causes (Table 3).
The low value of heritability and the high value of the
phenotypic coefficient of variation observed for grain yield
(YLD) indicate that direct selection based solely on such a character will not be effective. This result may be explained by the polygenic origin of the character, which results from the sum of the environmental effect in each gene.
Phenotypic coefficients of variation (CˆVP) were greater than genotypic coefficients of variation (CˆVg) for all the
character, which indicated that all the character interacted
Table 2. Summary of analysis of variance for the eight character evaluated in 20 cowpea bean genotypes, Aquidauana and Dourados, MS, Brazil
SV df DF DM GPL PW
Genotypes (G) 19 5.7092** 48.7562** 5.4983** 41.8736*
Environment (E) 1 390.6250** 1139.5562** 56.4062** 18533.0250**
G. x E. 19 7.4934** 49.8852** 2.5651 36.7881
Error 120 1.3875 23.4979 1.7895 23.2307
Mean - 45.51 81.24 18.71 27.3
CV (%) - 2.58 5.96 7.14 17.65
SV NBP NPP HSW YLD
Genotypes (G) 19 3.8588** 10.9092** 39.2250 212014.7667*
Environment (E) 1 10.5062** 172.2250** 0.9100 10197465.3062**
G. x E. 19 4.3615** 4.9881* 0.9000 237170.2667*
Error 120 1.3104 4.2333 0.7958 122660.1687
Mean - 11.51 7.78 20.21 998.10
CV (%) - 9.93 26.42 4.41 35.08
with the environment to a greater or lesser degree. Phenotypic and genotypic correlations ranged in
mag-nitude and significance. High coefficients of correlation
allow indirect selection, while the existence of low
coef-ficients does not represent lack of association between the
character, but rather the lack of a cause-effect relationship (Vencovsky and Barriga 1992) (Table 4).
The greatest positive correlations were found between
the character pairs; days to flowering (DF) x days to ma -turity (DM); days to ma-turity (DM) x pod weight (PW); days to maturity (DM) x number of beans per pod (NBP); pod weight (PW) x number of beans per pod (NBP); green pod length (GPL) x pod weight (PW); and number of pods per plant (NPP) x grain yield (YLD). In most cases, the genotypic correlations were greater than the phenotypic correlations, indicating low contribution of the environ-ment, and consequently greater reliability of the use of this parameter in indirect selection.
Only the variables of days to maturity and number of
beans per pod correlated in a negative and significant way
with grain yield. Negative correlation between the variable of days to maturity and grain yield allows inferences to be made regarding the possibility of joint selection for early maturity and grain yield.
Positive and significant correlations between character
pairs of number of pods per plant x grain yield are in agree-ment with the results found by Matos Filho et al. (2009), indicating that grain yield may be obtained in an indirect manner with selection for increase in the number of pods per plant.
The coefficients of phenotypic and genotypic correla -tions quantify the associa-tions in magnitude and direction;
nevertheless, they are not sufficient for expressing the direct
and indirect effects, while path analysis allows a clearer interpretation of the direct effect of one variable on another, and of the interference that other variables have on this association. Thus, it is possible to know the effects of the character involved in a previously established diagram in a
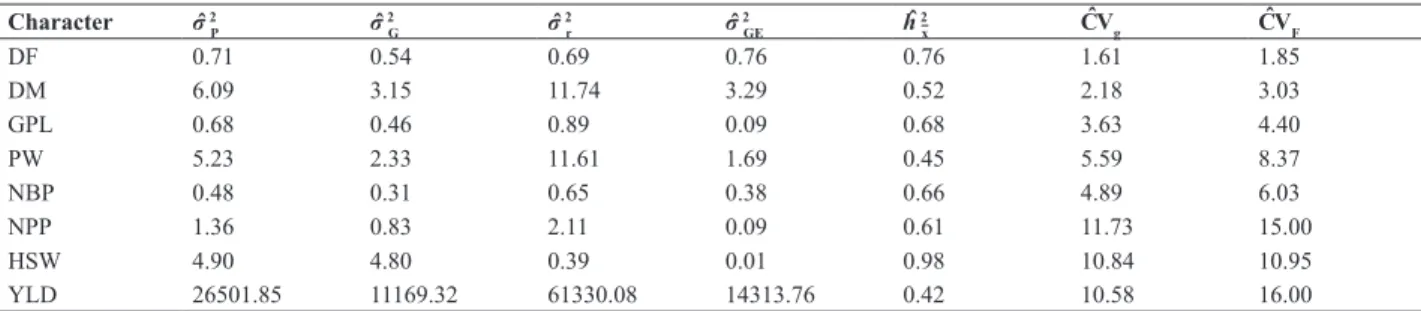
Table 3. Estimates of phenotypic variance (σˆ 2
P); genotypic variance (σˆ 2
G); residual variance (σˆ 2
r); variance of the genotype x environment interaction
(σˆ 2
GE)heritability based on the mean of families (hˆ 2
x); the genetic coefficient of variation (CˆVg); and of phenotypic coefficient of variation (CˆVP) for
eight character evaluated in 20 cowpea bean genotypes, Aquidauana and Dourados, MS, Brazil
Character σˆ 2
P σˆ
2
G σˆ
2
r σˆ
2
GE hˆ
2
x CˆVg CˆVF
DF 0.71 0.54 0.69 0.76 0.76 1.61 1.85
DM 6.09 3.15 11.74 3.29 0.52 2.18 3.03
GPL 0.68 0.46 0.89 0.09 0.68 3.63 4.40
PW 5.23 2.33 11.61 1.69 0.45 5.59 8.37
NBP 0.48 0.31 0.65 0.38 0.66 4.89 6.03
NPP 1.36 0.83 2.11 0.09 0.61 11.73 15.00
HSW 4.90 4.80 0.39 0.01 0.98 10.84 10.95
YLD 26501.85 11169.32 61330.08 14313.76 0.42 10.58 16.00
DF: days to flowering; DM: days to maturity for harvest; GPL: green pod length; PW: green pod weight, NBP: number of beans per pod, NPP: number of pods per plant, HSW: hundred seed weight, YLD: grain yield.
Table 4. Coefficients of phenotype (rF) and genotype (rG) correlations in seven agronomic character in cowpea bean genotypes, Aquidauana and Dourados, MS, Brazil
Character DM GPL PW NBP NPP YLD
rF 0.5276* -0.5090* -0.2173 0.0935 0.2713 0.0980
DF rG 0.8522** -0.6676* -0.3515 0.1341 0.4117 0.1959
rF -0.1415 0.3895 0.4490* -0.0761 -0.2893*
DM rG -0.2056 0.6068* 0.8305** -0.1531 -0.3952*
rF 0.4726** 0.2910 -0.1134 -0.0111
GPL rG 0.5513** 0.2978 -0.1497 0.0847
rF 0.6142** -0.4708* -0.1204
PW rG 0.7540** -0.6547* -0.2091
rF -0.3751* -0.4288*
NBP rG -0.5375* -0.8551**
rF 0.4179**
NPP rG 0.7982
**
detailed way and this justifies the existence of positive and
negative correlations of high and low magnitudes among the character studied.
Considering the direct positive effects on grain yield, green pod length was the variable that showed the greatest effect (1.8128) (Table 5). Nevertheless, total correlation of green pod length exhibited a low value (0.0847) due to the indirect negative effect of the other variables, hindering selection for grain yield by pod weight through breeding programs.
Total positive correlation of 0.7982 was observed on the variable of number of pods per plant and grain yield, but its direct effect was negative (-0.7521), while for this variable, the indirect effect of the other variables, mainly of the number of pods per plant (1.8946), is important since it indicates the direction of correlation. Manggoel et al. (2012) observed the same effect for this variable, where the direct effect was negative (-0.97), and the total correlation posi-tive (0.64). Under these conditions, Vencovsky and Barriga (1992) suggest using a restricted selection for the purpose
of eliminating the undesirable indirect effects, thus taking advantage of the existing direct effect.
The variable of days to maturity presented direct positive effect; nevertheless total correlation was negative (-0.3952). It is noteworthy that the heritability of this character was
of significant magnitude, manifesting the possibility of
joint selection for early maturity and grain yield (Table 5).
The variable of days to flowering obtained high direct
effect on grain yield, while the indirect effects of the other
variables ratified the total correlation, showing low associa -tion with grain yield (0.1959).
The variable of number of beans per pod obtained direct negative effect (-3.5249) with the variable of grain yield, being in agreement with the results found by Ullah et al. (2011). Magnitudes of the direct effects of the character analyzed on grain yield were greater than the magnitudes of their respective correlations. Considering this informa-tion as a base, it is possible to infer that there are various characteristics affecting both the magnitude, as well as the
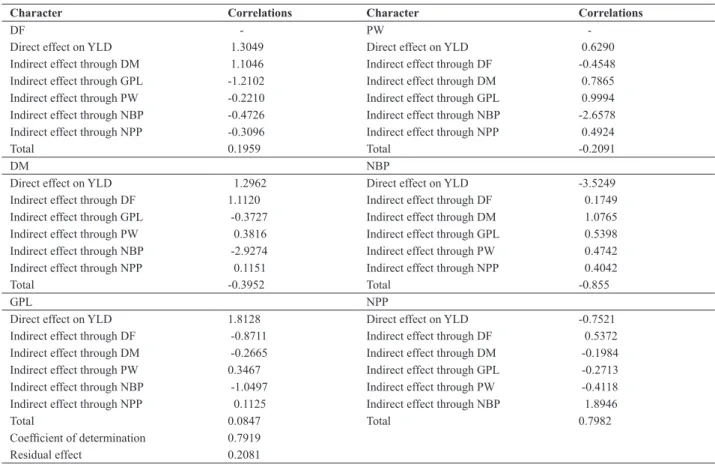
Table 5. Analysis of genotype correlations into direct and indirect effect components involving the main dependent variable YLD and the independent explanatory variables GPL, PW, NBP, NPP and HSW, evaluated in 20 cowpea bean genotypes, Aquidauana and Dourados, MS, Brazil
Character Correlations Character Correlations
DF - PW
-Direct effect on YLD 1.3049 Direct effect on YLD 0.6290
Indirect effect through DM 1.1046 Indirect effect through DF -0.4548
Indirect effect through GPL -1.2102 Indirect effect through DM 0.7865
Indirect effect through PW -0.2210 Indirect effect through GPL 0.9994
Indirect effect through NBP -0.4726 Indirect effect through NBP -2.6578
Indirect effect through NPP -0.3096 Indirect effect through NPP 0.4924
Total 0.1959 Total -0.2091
DM NBP
Direct effect on YLD 1.2962 Direct effect on YLD -3.5249
Indirect effect through DF 1.1120 Indirect effect through DF 0.1749
Indirect effect through GPL -0.3727 Indirect effect through DM 1.0765
Indirect effect through PW 0.3816 Indirect effect through GPL 0.5398
Indirect effect through NBP -2.9274 Indirect effect through PW 0.4742
Indirect effect through NPP 0.1151 Indirect effect through NPP 0.4042
Total -0.3952 Total -0.855
GPL NPP
Direct effect on YLD 1.8128 Direct effect on YLD -0.7521
Indirect effect through DF -0.8711 Indirect effect through DF 0.5372
Indirect effect through DM -0.2665 Indirect effect through DM -0.1984
Indirect effect through PW 0.3467 Indirect effect through GPL -0.2713
Indirect effect through NBP -1.0497 Indirect effect through PW -0.4118
Indirect effect through NPP 0.1125 Indirect effect through NBP 1.8946
Total 0.0847 Total 0.7982
Coefficient of determination 0.7919
Residual effect 0.2081
direction of correlations.
Considering the direct effect of the variables of days
to flowering, days to maturity, green pod length and pod
weight, it may be observed that the values are greater than that of the residual effect (0.2081). That means that the increase in production has a cause and effect relationship with these variables, distorting the values of the genetic correlations found among these variables and grain yield.
The coefficient of determination of 0.7919 which was found in this study indicates that 79% of the grain yield
obtained results from the effects of the variables analyzed (Table 5), showing that the independent explanatory variables
of days to flowering, days to maturity, green pod length,
pod weight, number of beans per pod, and number of pods
per plant explained a significant part of the variation of the
main character YLD. This value is restricted to the character under analysis since grain yield is a quantitative character with a large number of genes of small effect bearing on the character, showing marked environmental variance, and consequently low heritability.
In this study, character showed low to moderate possibility of gain through indirect selection, with greater probability of success combining several character and genotype of best performance.
Correlações e análise de trilha dos componentes de rendimento de grãos em
genótipos de feijão-caupi
Resumo – A obtenção de correlações e os efeitos diretos e indiretos dos componentes do rendimento com a produtividade de grãos são importantes para a seleção de parentais e populações segregantes promissoras. O objetivo da pesquisa foi estimar as correlações fenotípicas e genotípicas e o desdobramento dos efeitos diretos e indiretos dos componentes de rendimento com o rendimento de grãos de20 genótipos de feijão-caupi (Vigna unguiculata). O delineamento experimental foi em blocos casualizados, com 20 tratamentos e 4 repetições. Os caracteres demonstraram baixa à moderada possibilidade de ganho por seleção indireta, havendo maior probabilidade de sucesso ao aliar múltiplos caracteres e genótipo de melhor performance.
Palavras-chave: Análise de correlação, seleção indireta,Vigna unguiculata.
REFERENCES
Allard RW (1999) Principles of plant breeding. J. Wiley, New York, 485p.
Amorim EP, Ramos NP, Ungaro MRG and kiihl TAM (2008) Correlações e análise de trilha em girassol. Bragantia 67: 307-316.
Cruz CD (2006) Programa Genes: biometria. UFV, Viçosa, 382p.
Cruz CD and Regazzi AJ (2006) Modelos biométricos aplicados ao
melhoramento genético. UFV, Viçosa, 585p.
Furtado MR, Cruz CD, Cardoso AA, Coelho ADF and Peternelli LA (2002) Análise de trilha do rendimento do feijoeiro e seus componentes primários em monocultivo e em consórcio com a cultura do milho.
Ciência Rural 32: 217-220.
Freire Filho FR, Rocha MM, Ribeiro VQ and Sitollin IM (2008) Avanços e perspectivas para a cultura do feijão-caupi. In Albuquerque ACS and Silva AG (eds.) Agricultura tropical: quatro décadas de inovações tecnológicas, institucionais e políticas. Embrapa Informação Tecnológica, Brasília, p. 285-250.
Hamawaki OT, Sousa LB, Romanato FN, Nogueira APO, Santos Júnior CD and PolizelAC (2012) Genetic parameters and variability in soybean genotypes. Comunicata Scientiae 3: 76-83.
Hartwig I, Carvalho FIF, Oliveira AC, Silva JAG, Lorencetti C, Benin G,
Vieira EA, Bertan I, Silva GO, Valério IP, André D and Schmidt M (2007) Estimativa de coeficientes de correlação e trilha em gerações segregantes de trigo hexaplóide. Bragantia 66: 203-218.
Manggoel W, Uguru MI, Ndam ON and Dasbak MA (2012) Genetic variability, correlation and path coefficient analysis of some yield components of ten cowpea [Vigna unguiculata(L.) Walp] accessions.
Journal of Plant Breeding and Crop Science 4: 80-86.
Matos Filho CHA, Gomes RLF, Rocha MM, Freire Filho FR and Lopes ÂCA (2009) Potencial produtivo de progênies de feijão-caupi com arquitetura ereta de planta. Ciência Rural 39: 348-354.
Montgomery DC and Peck EA (1981) Introduction to linear regression analysis. John Wiley, New York, 504p.
Silva SA, Carvalho FIF, Nedel JL, Cruz PJ, Silva JAG, Caetano VR, Hartwig I and Sousa CS (2005) Análise de trilha para os componentes de rendimento de grãos em trigo. Bragantia 64: 191-196.
Ullah MZ, Hasan MJ, Rahman AHMA and Saki AI (2011) Genetic variability, character association and path analysis in yard long bean.
SAARC Journal of Agriculture 9: 9-16.
Vencovsky R and Barriga P (1992) Genética biométrica no