Rev. Caatinga
GENETIC VARIABILITY AND SELECTION OF EXTRA
-
EARLY COWPEA
PROGENIES
1ANTÔNIO MOREIRA BARROSO NETO2*, RENATA FERNANDES DE MATOS2, MARCELO DE SOUSA
PINHEIRO2, CÂNDIDA HERMÍNIA CAMPOS DE MAGALHÃES BERTINI2, JÚLIO CÉSAR DOVALE2
ABSTRACT- The precocity of cowpea is important because it indicates the possibility of increasing and/or stabilizing production in regions with long periods of drought. The aim of this study was to evaluate genetic variability and select extra-early cowpea progenies. Fifteen F3:6 progenies were evaluated in 2014 while
sixty-two F7 progenies were evaluated in 2015. Two commercial cultivars were used in experiments performed
in the irrigated perimeter of Baixo Acaraú, in Marco, CE. The following characteristics were evaluated: number of days for flowering (NDF), number of days for maturity (NDM), plant height (PH), pod length (PL), number of seeds per pod (NSP), number of grains per plant (NGP), weight of 100 grains (W100G) and total weight
(MTOT). Data were analyzed in lattice and RBD, according to the methodology of mixed models by the
REML/BLUP procedure. Also, the components of variance and genetic values were estimated. Variability among progenies, high heritability and high accuracy were identified for all traits. For NDF and NDM, the progenies presented higher behavior than the controls. The lattice arrangement contributed to a greater gain with the selection of NDF, NDM, PH, NSP, NGP and WTOT. The genotypes 12, 15, 30, 33, 41, 43 and 52 are
among the top ten because they have high genetic values in three or more traits. The genotypes 12, 15, 30, 33, 43 and 52 highlight extra-earliness (precocity).
Keywords: Vigna unguiculata. Selective accuracy. Mixed model. REML / BLUP.
VARIABILIDADE GENÉTICA E SELEÇÃO DE PROGÊNIES DE FEIJÃO-CAUPI
EXTRAPRECOCES
RESUMO- A precocidade é importante para o feijão-caupi por representar a possibilidade de aumentar e/ou estabilizar a produção em regiões com longos períodos de estiagem. Objetivou- se avaliar a variabilidade genética e selecionar progênies de feijão-caupi extraprecoces. Foram avaliadas 15 progênies F3:6 em 2014 e 62 progênies F7 em 2015, juntamente com duas cultivares comerciais em experimentos conduzidos no perímetro irrigado Baixo Acaraú, localizado no município de Marco, CE. Foram avaliados os caracteres: número de dias para o florescimento (NDF), número de dias para a maturação (NDM), altura de planta (ALT), comprimento de vagem (CPV), número de grãos por vagem (NGV), número de grãos por planta (NGP), massa de 100 grãos (M100G) e massa total (MTOT). Os dados foram analisados em DBIL e DBC, segundo a
metodologia de modelos mistos, via procedimento REML/BLUP. Foram estimados os componentes de variância e os valores genéticos. Identificou-se variabilidade entre as progênies, alta herdabilidade e elevada acurácia em todos os caracteres avaliados. As progênies apresentaram comportamento superior às testemunhas para NDF e NDM. O arranjo em látice apresentou maior eficiência que o DBC, pelo maior ganho obtido com a seleção nos caracteres NDF, NDM, ALT, NGV, NGP e MTOT. Os genótipos 12, 15, 30, 33, 41, 43 e 52
encontram-se entre os dez superiores, por apresentarem valores genéticos elevados em três ou mais caracteres. Os genótipos 12, 15, 30, 33, 43 e 52 destacam-se como os mais precoces.
Palavras-chave: Vigna unguiculata. Acurácia seletiva. Modelos Mistos. REML/BLUP.
_____________________ *Corresponding author
1Received for publication in 08/21/2016; accepted in 12/02/2016.
Paper approved from IV CONAC 2016.
Extracted from the first author's dissertation, funded by CNPq.
2Center of Agricultural Sciences, Universidade Federal do Ceará, Fortaleza, CE, Brazil; [email protected],
Rev. Caatinga
INTRODUCTION
Cowpea (Vigna unguiculata (L.) Walp.) has great genetic variability that makes it versatile; hence, it is used for several purposes and production systems. Currently, Brazil is the third largest producer in the world, and cowpea is mainly cultivated in the North, Northeast and Central West regions of the country (BEZERRA et al., 2010).
The largest cowpea production (87.32%) takes place in the Northeast and accounts for 97.47% of the cowpea cultivated area in the country. In this region, cowpea has favorable ecological conditions for its development, becoming one of the most important sources of protein in the diet of rural and urban populations. In the Central-West, this culture has been highlighted by the possibility of a second harvest, being a new option for productive arrangements and diversification of the agribusiness of this region (DAMASCENO-SILVA, 2011).
The different productive arrangements require cultivars with different characteristics for the maturation cycle, plant size, grain yield and resistance to pests and diseases. Thus, precocity (early maturation) is one of the main objectives of crop improvement, since it makes it possible to perform up to three cycles per year, using dry farming and irrigated crops (FREIRE FILHO, 2011; OLIVEIRA et al., 2016).
In order to minimize losses from summer crops, cowpea farmers have selected and developed extra-early maturing cultivars, which minimize losses and/or stabilize the production in regions with long periods of drought (MACHADO et al., 2008; AYO-VAUGHAN et al., 2011). Therefore, it is necessary to understand the genetic components that influence precocity in cowpea, because it would help in the development of strategies to improve grain yield and the adaptation of cultivars to stressful environments (ISHIYAKU-SINGH; CRAUFURD et al., 2005).
In recent years, the cultivation of cowpea has expanded to the Cerrado biome of the Brazilian Central-West, where it has been incorporated into the productive arrangements of the second harvest after soybean, rice or corn (FREIRE FILHO, 2011). In these arrangements, cowpea is cultivated after the middle of the rainy season, when there is no expectation of precipitation that may allow the cultivation of a second crop. In this context, there is a small gap of planting for farmers interested in growing cowpea, in which cultivars of early and semi-early cycles fit perfectly, since they last from 60 to 80 days. Thus, an alternative to enlarge the planting gap for cowpea would be the use of extra-early cultivars, with cycles of less than 60 days (OLIVEIRA et al., 2016).
It is estimated that about six or seven genes are involved in the expression of cowpea precocity, indicating its polygenic nature. Since it is a
quantitative trait, there is great environmental influence on its expression, which makes it difficult to select superior genotypes (ADEYANJU; ISHIYAKU, 2007; AYO-VAUGHAN et al., 2011).
According to Piepho et al. (2008), the development and recommendation of new varieties require a selection that must be made among a larger group of candidate genotypes, so the estimation of genetic values should be the focus of any effort in this direction.
To overcome these difficulties, in the selection of quantitative traits, the breeder uses genetic-statistical tools capable of isolating only the genotypic components, and predicting real genetic values in the selection. The methods based on BLUP (Best Linear Unbiased Prediction) and REML (Restricted Maximum Likelihood Estimation), with mixed models approach, are estimators that present greater accuracy and precision in the selection of genotypes with high genetic value (BORGES et al., 2010).
The aim of this study was to evaluate the efficiency of incomplete blocks with lattice design and randomized complete block design (RCBD) on the estimation of genetic variability and to select extra-early/ extra-precocious cowpea progenies.
MATERIAL AND METHODS
Fifteen progenies of F3:6 cowpea were
evaluated and a selection was made between and within these progenies, resulting in sixty-two F7
progenies, which were evaluated in 2015. These progenies originate from the Embrapa Meio Norte Cowpea Breeding Program, Teresina-PI, and were obtained from diallel crosses between the genitors
IT82D-889, AU94MOB-816, IT82D-60, MNC04- 789B-119-2-3-1 and MNC05-820B-240
and selected by the Bulk method within and between families, by Oliveira et al. (2016).
F3:6 progenies were evaluated in 2014 in a
RCBD with three replications. Two commercial cultivars (BRS Tumucumaque and Sempre Verde) were used as controls. The plot was composed by a line of 4.5 m and by 18 plants, with spacing of 1.00 m between plots and 0.25 m between holes within the line. The usable area was represented by the 16 central plants of the plot.
F7 progenies were obtained from the selection
in progenies F3:6, using an intensity of 10%. In 2015,
Rev. Caatinga
area was represented by 16 central plants of the plot. In both tests, a single-bed was fertilized with superphosphate (40 kg / ha) and potassium chloride (20 kg / ha) according to soil analysis (6.0 mg / kg phosphorus and 0.15 cmol / kg potassium). After fifteen days of sowing, thinning was performed, leaving one plant per hole. After twenty days of sowing, cover fertilization with urea (30 kg / ha) was performed, following the recommendations for the crop. The cultivation was carried out in an irrigated system by using a micro sprinkler, with irrigation shift of five days on average, for two hours.
The traits evaluated in both trials were: number of days for flowering (NDF), number of days for maturity (NDM), plant height (PH), pod length (PL), number of seeds per pod (NSP), number of grains per plant (NGP), weight of 100 dry grains (W100G) and total production of dry grains (WTOT).
After evaluating all traits, an index which resulted from an adaptation of the selection method of Pesek and Baker (1969) was adopted. According to the objectives of the program, for each character, a different weight was attributed with proper specification of the desired gains. Precocity, grain weight and plant height were included in the index. Thus, for each character, weights 1, 2 and 3 were attributed, respectively. The index was composed of the sum of the weights of all traits for each progeny, establishing precocity (evaluated by the number of days for flowering and pod maturation) as a priority, followed by the other traits in order of importance.
Data were submitted for statistical analysis using the methodology of mixed models, by the REML/BLUP procedure, using the likelihood ratio test (LRT), according to Resende (2002).
RESULTS AND DISCUSSION
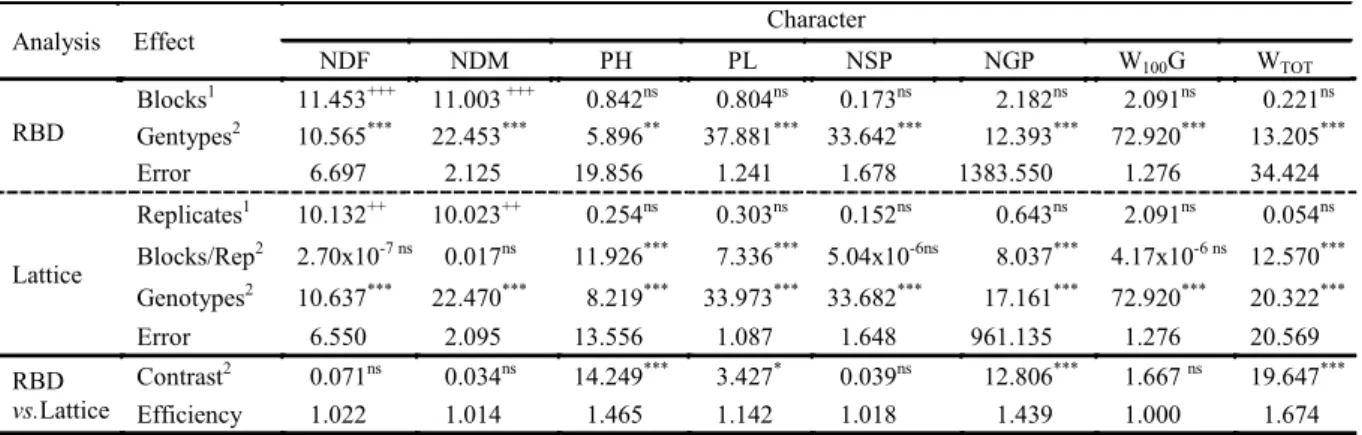
According to the results of the experiment conducted in 2015, for data from the randomized block design (RBD), the effect was only for the number of days for flowering (NDF) and number of days for maturation (NDM). This shows that there was a difference between the phenotypic values of these traits at the blocks level, which indicates the existence of environmental variability due to the heterogeneity of the experimental area.
On analyzing the data according to the lattice arrangement, most of the characters evaluated presented a significant difference for the effects of repetitions and blocks. For the effect of repetitions, a significant difference was verified only in NDF and NDM.
Regarding the effect of blocks within replications, the test found a significant difference for plant height (PH), pod length (PL), number of grains per plant (NGP) and total weight (WTOT),
which were not significant when data were analyzed according to the complete randomized block design.
In addition, there was a difference regarding the experimental error when both designs were compared. The lattice arrangement provided a reduction in experimental error, justifying the choice of this design over the complete randomized block. This is because the lattice arrangement separates a component from the experimental error due to the variance of repetitions effect, thereby increasing the experimental accuracy. This separation was not possible in the RCBD because the blocks were assembled in repetitions, not allowing to calculate an estimate of the error with the separation of the component due to the effect of repetitions (RAMALHO; FERREIRA; OLIVEIRA et al., 2012).
Another fact that justifies the choice of lattice design is the number of progenies evaluated in this work, since it is a matter of evaluating characters with quantitative inheritance (controlled by several genes), there is a need of evaluating a large number of progenies. This impairs the efficiency of the RCBD, due to the heterogeneity of the area to shelter blocks containing all the progenies to be evaluated (SILVA et al., 1999; RAMALHO; FERREIRA; OLIVEIRA et al., 2012).
Silva et al. (1999) and Regazzi et al. (1999) studied the advantages of the lattice experimental design in the evaluation of corn hybrids, and observed that for most evaluated environments, the lattice was superior to RBD. For Cruzio (2014), who worked with 97 progenies of cowpea, the lattice provided greater efficiency when compared to the block design. According to the authors, the main advantage of the lattice was the reduction of experimental error, being a good alternative to minimize the effects of environmental heterogeneity when the number of treatments or the size of the plots are very large.
The results of the aforementioned authors corroborate with the present study, regarding the reduction of experimental error presented in the table of deviance analysis (Table 1). It was observed that the use of a lattice provided a higher efficiency for
all evaluated traits, except for the weight of 100-grains (W100) which was 100%. Ramalho,
Ferreira and Oliveira et al. (2012) stated that when this efficiency is less than 100, it is recommended to despise the lattice analysis and to have the experiment analyzed in complete randomized blocks. In the present study, the efficiency of the lattice slightly exceeded the threshold of 100%, thereby justifying the choice of this design. However, since the selection of cowpea has a high degree of endogamy, with F7 progenies, this
efficiency (although very small) can directly contribute to the conduction of a final selection with greater effectiveness. This efficiency is probably due to the fact that this type of design captures information of possible intrablock variability, not
Rev. Caatinga
Some studies with cowpea have reported the efficiency of the lattice over RBD. Rodrigues et al. (2016) evaluated drought tolerance in cowpea genotypes in a lattice design and obtained an efficiency of over 100% for most of the evaluated traits, including the number of days for flowering and maturation, with efficiencies of 120.55% and 125.23%, respectively.
In both designs, for the genotype effect, a differential behavior was verified in all evaluated traits, evidenced by the Likelihood Ratio Test (LRT). These results confirm that due to the existing genetic variability, it is possible to identify superior genotypes, allowing selection among them for the development of future cultivars, as cited by Torres et al. (2015) and Oliveira et al. (2016). According to Correa et al. (2012), the significance of the effects of genotypes contributes to the selection success, since this is influenced by genetic variance. For Krause, Rodrigues and Leal et al. (2012), the significance of the effect of genotypes on the great majority of traits, indicates the existence of variability, resulting from the action of additive and non-additive gene effects in the control of the evaluated characters.
These effects were identified by Ishiyaku; Singh and Craufurd et al. (2005) and Ayo-Vaughan et al. (2011), when studying and controlling precocity in cowpea. For these authors, both additive and non-additive effects control earliness (precocity). The additive effects are the most important because they are inheritable in nature. For selection purposes, the interest is in the additive genetic value, which is the sum of the effects of the alleles at the locus that controls the quantitative character under selection (NDF and NDM).
The significance of the effect of the genotypes reveals the existence of variability in the progenies of the present study. Thus, it has become necessary to know the origin of this variability (environmental or genetic), its portion can contribute to the selection process, being necessary to understand and estimate its real values and proportions. Using estimates of the variance and heritability components at the mean level of genotypes obtained by the REML / BLUP methods, in both designs (Table 2), it was verified that all traits presented a high magnitude of heritability, except for PH in the RBD, according to the classification proposed by Resende (2002). All other characters presented a high magnitude of heritability (above 0.5), showing that most of the presented variability can be explained by genotypic variation.
The high heritability observed for all evaluated traits is explained by the advanced stage of the genotypes (F7), with a high degree of
homozygosity, as verified by Rocha et al. (2009) and Barros et al. (2011). The same results were obtained by Ishiyaku; Singh and Craufurd et al. (2005), for NDF and NDM in cowpea, with heritability restricted to 0.86.
These heritability values can be justified by genotypic variance, which confirms the existence of genetic variability among them. According to Garcia and Nogueira (2005), Rosado et al. (2012), Sousa (2015) and Torres et al. (2015), high estimates of heritability coefficient show evidence that the genetic component presents high expression in the phenotype, showing great potential for selection and good perspectives of genetic gain.
Table 1. Deviance analysis considering the randomized block designs and the square lattice for the number of days for flowering (NDF), number of days for maturity (NDM), plant height (PH), pod length (PL), Number of seeds per pod (NSP), number of grains per plant (NGP), weight of 100 grains (W100G) and total weight (WTOT) evaluated in 62 genotypes derived
from F7 progenies of cowpea and two commercial controls.
1Wald F Statistic; +++significant at 1% of probability; nsnon-significant.
2Likelihood Ratio Test (LRT), tested by chi-square with 1 as degree of freedom; ***significant at 1% of probability;
**significant at 5% of probability; nsnon-significant.
Analysis Effect Character
NDF NDM PH PL NSP NGP W100G WTOT
Blocks1 11.453+++ 11.003 +++ 0.842ns 0.804ns 0.173ns 2.182ns 2.091ns 0.221ns RBD Gentypes2 10.565*** 22.453*** 5.896** 37.881*** 33.642*** 12.393*** 72.920*** 13.205***
Error 6.697 2.125 19.856 1.241 1.678 1383.550 1.276 34.424
Lattice
Replicates1 10.132++ 10.023++ 0.254ns 0.303ns 0.152ns 0.643ns 2.091ns 0.054ns
Blocks/Rep2 2.70x10⁻⁷ ns 0.017ns 11.926*** 7.336*** 5.04x10⁻⁶ns 8.037*** 4.17x10⁻⁶ ns 12.570***
Genotypes2 10.637*** 22.470*** 8.219*** 33.973*** 33.682*** 17.161*** 72.920*** 20.322*** Error 6.550 2.095 13.556 1.087 1.648 961.135 1.276 20.569
RBD
vs.Lattice
Rev. Caatinga
Based on the selection made in F3:6 progenies,
the gain obtained with the selection in NDF, NDM and PH was negative. This was explained by the purpose of the program in reducing the expression of these traits (precocity). In general, the gain with the selection varied from -3.611 to 72.721% and -3.598 to 65.236%, for lattice and RBD, respectively. The lowest values were for NDF and NDM, in both designs. For the lattice, the values were: -4.764% and -3.611%, and for RBD, -4.757% and -3.598%; respectively. Although the gains with selection are small, they are of great relevance, when compared with the other traits, considering the high degree of endogamy and genotypes selection.
The estimates for gain with selection were higher in the lattice design. However, for all traits, the relationship between selection gains in both designs was close to one unit, showing that the designs were matched for GS. This fact is explained by the essence of lattice, which separates from the experimental error another factor of variation, explaining the environmental variability existing in the block within the repetition. These values directly influence the experimental accuracy, indicating that the lattice was superior to RBD.
By observing the results of the lattice accuracy, it can be seen that all the traits showed an accuracy above 0.5. The highlights were: pod length (PL), number of seeds per pod (NSP), and W100G,
which presented a high accuracy (close to one),
implying directly that the selection process is efficient.
This higher predictive accuracy for PL, NGV and W100G is due to the fact that random effects
predictions are forced towards the overall mean (shrinkage), eliminating the residual environmental effects that are embedded in the phenotypic data and correcting the phenotypic value in function of the heritability of the character under selection. It does not happen when the effects are considered fixed. According to Viana et al. (2010) and Pinheiro et al. (2013), with this adjustment of the phenotypic values by heritability, it is concluded that the higher the adjusted heritability, the lower the shrinkage, the greater the selective accuracy and the greater the genetic gain.
For Pimentel et al. (2014) and Torres et al. (2015), high accuracy values showed good experimental quality, indicating an excellent relationship between the predicted and real values, which results in selection safety. These high values of accuracy in all characters can be justified by the efficiency of the mixed models and REML/BLUP predictors. These predictors are efficient in estimating the components of variance and genetic values, since they aid in the estimation of genetic values based on the unfolding of phenotypic variation in various genetic components (BALDISSERA et al., 2012; RESENDE et al., 2014).
Table 2. Estimates of genotypic and block variances within the replicate, heritability at the level of means, gains with selection (in absolute terms and percentage), and accuracy of the selection process, considering the randomized block designs and the square lattice for the number of days for flowering (NDF), number of days for maturity (NDM), plant height (PH), pod length (PL), Number of seeds per pod (NSP), number of grains per plant (NGP), weight of 100 grains (W100G) and total weight (WTOT) evaluated in 62 genotypes derived from F7 progenies of cowpea and two commercial
controls.
Design Parameters Characters
NDF NDM PH PL NSP NGP W100G WTOT
RBD
2
ˆ
g
4.335 2.571 8.465 2.545 3.025 1012.483 6.146 26.4872
m
h
0.564 0.708 0.460 0.804 0.783 0.594 0.906 0.606GS -1.615 -1.778 -2.871 2.800 2.983 58.365 4.878 9.154
GS(%) -4.757 -3.598 -11.745 16.730 25.884 61.431 33.824 65.236
Accuracy 0.675 0.863 0.516 0.945 0.931 0.719 0.989 0.736
Lattice
2
ˆ
b r
0.133 0.032 6.576 0.226 0.029 465.905 7.42x10⁻⁷ 15.0292
ˆ
g
4.383 2.575 9.231 2.397 3.036 1029.628 6.146 27.6492
m
h
0.572 0.711 0.577 0.815 0.787 0.682 0.906 0.729GS -1.617 -1.785 -3.332 2.704 2.992 62.995 4.878 10.204
GS(%) -4.764 -3.611 -13.629 16.154 25.963 66.306 33.824 72.721
Accuracy 0.687 0.867 0.694 0.952 0.934 0.835 0.989 0.885
RBD
Rev. Caatinga
This selective accuracy reflects the quality of the information of the procedures used in the prediction of genetic values. It is also associated with the precision of the selection based on predicted genetic values which are more reliable, with inferences about genotype means and non phenotype means. This helps in determining the reliability of how accurate the "ranking" of cowpea genotypes will be (PIMENTEL et al., 2014).
The genotypic values of the characters in the 62 progenies are presented in Tables 3 and 4. The
lowest estimates were observed in NDF, NDM and PH (Table 3). Values lower than at least one of the controls (BRS Tumucumaque and Sempre Verde), showed that all these progenies may be the basis for future breeding programs aimed at earliness (precocity), for presenting extra-early cycle plants, according to Freire Filho (2011). This is in addition to composing future programs which are aimed at reducing the size of plants.
Table 3. Genotypic values for number of days for flowering (NDF), number of days for maturity (NDM), plant height (PH), pod length (PL), considering the randomized block designs and the square lattice evaluated in 62 genotypes derived from F7
progenies of cowpea and two commercial controls.
Progenies NSP NGP W100G WTOT
RBD Lattice RBD Lattice RBD Lattice RBD Lattice
1 11.897 11.868 92.330 96.006 14.097 14.097 12.805 13.764
2 12.679 12.649 110.747 118.911 15.100 15.100 16.525 18.279
3 14.245 14.203 187.384 190.477 12.140 12.140 25.266 25.363
4 10.722 10.666 102.726 104.334 15.194 15.194 15.956 16.711
5 11.505 11.506 91.142 102.237 12.636 12.636 13.009 15.059
6 10.331 10.274 115.202 113.257 18.103 18.103 19.171 18.899
7 11.114 11.087 73.913 73.448 13.761 13.761 10.374 10.368
8 9.548 9.510 88.765 87.948 14.518 14.518 13.469 13.416
9 10.722 10.748 111.341 113.374 16.194 16.194 17.072 17.915
10 10.918 10.939 71.537 69.464 18.456 18.456 11.276 10.987
11 11.114 11.117 104.806 91.260 17.910 17.910 19.639 17.616
12 12.288 12.299 105.400 102.953 11.760 11.760 12.992 12.166
13 10.722 10.780 94.409 101.537 14.303 14.303 14.199 15.510
14 11.505 11.513 107.776 100.285 16.300 16.300 17.127 15.461
15 11.505 11.540 101.538 100.702 12.977 12.977 14.499 14.347
16 11.505 11.536 83.715 77.703 13.177 13.177 11.269 9.790
17 8.765 8.753 77.478 66.769 13.805 13.805 11.336 9.588
18 11.505 11.501 104.806 99.900 18.412 18.412 20.511 20.663
19 10.331 10.302 93.518 70.562 16.709 16.709 15.841 11.620
20 11.505 11.484 90.548 78.165 12.038 12.038 12.068 9.626
21 10.331 10.358 83.715 81.521 11.633 11.633 10.172 9.237
22 10.918 10.895 96.785 79.928 15.136 15.136 14.476 10.844
23 14.245 14.265 185.602 189.431 12.619 12.619 23.284 23.482
24 11.309 11.311 101.538 90.413 10.345 10.345 12.102 9.363
25 11.505 11.506 73.022 74.884 12.341 12.341 9.544 9.797
26 10.526 10.518 69.754 72.903 14.281 14.281 10.405 10.876
27 12.092 12.071 89.953 79.700 12.488 12.488 11.458 8.714
28 11.505 11.484 88.765 89.348 15.447 15.447 13.195 13.346
29 11.114 11.144 84.607 95.773 15.951 15.951 13.385 15.466
30 9.548 9.518 84.013 78.498 14.597 14.597 11.720 9.894
31 15.420 15.444 124.114 132.094 11.657 11.657 15.407 16.376
32 9.156 9.148 75.695 73.984 14.298 14.298 12.650 12.387
33 10.918 10.938 97.082 105.613 12.028 12.028 12.053 13.544
34 13.462 13.489 72.131 78.747 11.406 11.406 9.371 10.361
35 13.071 13.077 79.557 70.885 13.859 13.859 12.594 10.808
36 12.288 12.292 89.062 92.805 10.603 10.603 10.910 11.328
37 11.505 11.560 69.160 81.163 15.414 15.414 10.419 12.628
38 13.071 13.080 78.369 75.138 9.348 9.348 8.947 7.288
39 12.288 12.320 96.191 103.167 13.805 13.805 14.400 15.893
40 9.156 9.170 71.834 72.669 14.529 14.529 10.605 10.656
41 11.505 11.513 83.715 87.466 12.791 12.791 11.152 11.949
42 9.352 9.344 69.457 72.873 20.362 20.362 12.096 13.126
43 11.114 11.097 70.051 68.182 12.336 12.336 9.171 8.725
44 10.722 10.758 75.398 85.515 16.465 16.465 11.413 13.311
45 12.679 12.671 89.953 85.627 11.091 11.091 11.217 9.507
46 13.854 13.878 117.282 124.564 15.458 15.458 20.722 22.983
Rev. Caatinga
Table 3. Continuation.
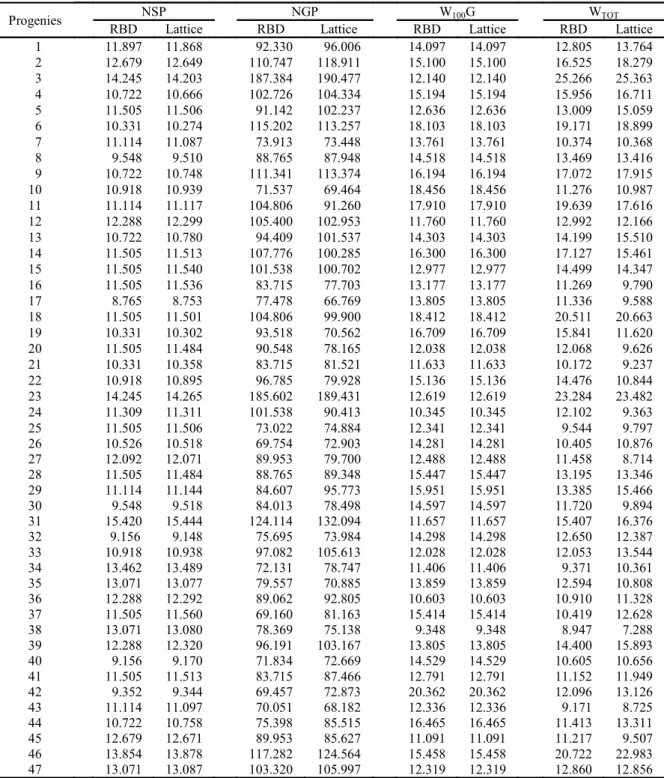
In most of the progenies, the results were lower than the controls for PL (Table 3), NGV, NGP, W100G and WTOT (Table 4). Ordering the best
progenies, ten showed the lowest genotypic values for NDF(19, 15, 12, 33, 52, 37, 30, 43, 41 and 35); ten for NDM (52, 33, 21, 16, 30, 43, 22, 12, 15 and 25); ten for PH (2, 1, 36, 14, 27, 20, 46, 55, 62 and 45); eight for PL (31, 41, 53, 46, 27, 55, 25 and 30); ten for NSP (17, 26, 18, 41, 48, 15, 50, 59, 60 and 42); ten for NGP (18, 40, 10, 38, 46, 4, 43, 26, 25 and 60); ten for W100G (42, 58, 56, 60, 48, 4, 15, 13,
6 and 5) and ten for WTOT (56, 61, 62, 55, 8, 41, 39,
59, 4 and 58).
The means for the number of days for maturation in this study ranged from 47 to 52 days, which are lower than those obtained by Oliveira et al. (2016), who obtained variation from 52 to 56 days, when studying the crosses that gave rise to the progenies evaluated in this work, indicating that, after the advancement of generations inside and between families, the selection was efficient in obtaining extra-early progenies.
Table 4. Genotypic values for Number of seeds per pod (NSP), number of grains per plant (NGP), weight of 100 grains (W100G) and total weight (WTOT) considering the randomized block designs and the square lattice evaluated in 62 genotypes
derived from F7 progenies of cowpea and two commercial controls.
Progenies NSP NGP W100G WTOT
RBD Lattice RBD Lattice RBD Lattice RBD Lattice
48 13.071 13.094 105.103 115.965 14.224 14.224 14.856 16.998
49 10.722 10.729 72.428 80.236 15.090 15.090 11.159 12.594
50 11.505 11.496 82.527 75.442 16.220 16.220 13.141 11.550
51 11.897 11.892 89.062 93.953 16.227 16.227 13.700 14.765
52 9.352 9.389 62.922 75.152 15.768 15.768 9.717 11.868
53 12.679 12.679 150.551 159.123 16.743 16.743 23.441 24.802
54 11.505 11.526 68.566 72.612 13.985 13.985 9.955 10.632
55 11.897 11.915 102.132 108.588 14.213 14.213 14.537 15.468
56 9.939 9.919 93.221 92.507 13.910 13.910 12.959 13.378
57 13.071 13.040 112.232 99.709 13.101 13.101 14.640 12.012
58 11.505 11.469 89.359 84.472 14.042 14.042 13.200 12.826
59 9.939 9.950 70.348 73.852 13.801 13.801 10.524 11.498
60 12.288 12.257 103.320 95.099 14.094 14.094 20.275 19.655
61 7.199 7.171 72.725 67.563 20.575 20.575 12.808 12.723
62 11.897 11.886 104.212 101.152 15.365 15.365 16.583 16.589
BRS Tumucumaque 13.071 13.061 133.619 130.121 19.889 19.889 25.014 25.232
Sempre Verde 15.811 15.812 138.966 146.773 15.539 15.539 21.386 23.553
Progenies NSP NGP W100G WTOT
RBD Lattice RBD Lattice RBD Lattice RBD Lattice
1 11.897 11.868 92.330 96.006 14.097 14.097 12.805 13.764
2 12.679 12.649 110.747 118.911 15.100 15.100 16.525 18.279
3 14.245 14.203 187.384 190.477 12.140 12.140 25.266 25.363
4 10.722 10.666 102.726 104.334 15.194 15.194 15.956 16.711
5 11.505 11.506 91.142 102.237 12.636 12.636 13.009 15.059
6 10.331 10.274 115.202 113.257 18.103 18.103 19.171 18.899
7 11.114 11.087 73.913 73.448 13.761 13.761 10.374 10.368
8 9.548 9.510 88.765 87.948 14.518 14.518 13.469 13.416
9 10.722 10.748 111.341 113.374 16.194 16.194 17.072 17.915
10 10.918 10.939 71.537 69.464 18.456 18.456 11.276 10.987
11 11.114 11.117 104.806 91.260 17.910 17.910 19.639 17.616
12 12.288 12.299 105.400 102.953 11.760 11.760 12.992 12.166
13 10.722 10.780 94.409 101.537 14.303 14.303 14.199 15.510
14 11.505 11.513 107.776 100.285 16.300 16.300 17.127 15.461
15 11.505 11.540 101.538 100.702 12.977 12.977 14.499 14.347
16 11.505 11.536 83.715 77.703 13.177 13.177 11.269 9.790
17 8.765 8.753 77.478 66.769 13.805 13.805 11.336 9.588
18 11.505 11.501 104.806 99.900 18.412 18.412 20.511 20.663
19 10.331 10.302 93.518 70.562 16.709 16.709 15.841 11.620
20 11.505 11.484 90.548 78.165 12.038 12.038 12.068 9.626
21 10.331 10.358 83.715 81.521 11.633 11.633 10.172 9.237
22 10.918 10.895 96.785 79.928 15.136 15.136 14.476 10.844
23 14.245 14.265 185.602 189.431 12.619 12.619 23.284 23.482
Rev. Caatinga
Table 4. Continuation.
Progenies 12, 15, 30, 33, 41, 43 and 52 are among the top ten for at least three of the eight traits analyzed, being the most indicated for cultivation, because they have the shortest maturation cycle. For the progenies that are not indicated for planting, they may be used as the basis for future cycles of hybridization with the purpose of reducing the size, being capable of providing positive results. Increasing commercial traits, considering that these progenies present small and colorful grains, which are characteristics that are not appreciated by the consumer market.
CONCLUSION
The number of days for flowering, number of days for maturation, plant height, number of grains per pod, number of grains per plant and total weight
presented greater genetic variability and greater gain with the selection. Progenies 12, 15, 30, 33, 41, 43 and 52 are among the top ten because they have high genetic values in three or more traits, while progenies 12, 15, 30, 33, 43 and 52 stand out in relation to extra earliness (precocity).
REFERENCES
ADEYANJU, A. O.; ISHIYAKU, M. F. Genetic study of earliness in cowpea (Vigna unguiculata L. Walp). International Journal of Plant Breeding and Genetics, New York, v. 64, n. 1, p. 34-37, 2007.
AYO-VAUGHAN, M. A. et al. Diallel analysis of earliness in cowpea. African Crop Science Conference Proceedings, Kampala, v. 10, n. 4, p. 1-4, 2011.
Progenies NSP NGP W100G WTOT
RBD Lattice RBD Lattice RBD Lattice RBD Lattice
25 11.505 11.506 73.022 74.884 12.341 12.341 9.544 9.797
26 10.526 10.518 69.754 72.903 14.281 14.281 10.405 10.876
27 12.092 12.071 89.953 79.700 12.488 12.488 11.458 8.714
28 11.505 11.484 88.765 89.348 15.447 15.447 13.195 13.346
29 11.114 11.144 84.607 95.773 15.951 15.951 13.385 15.466
30 9.548 9.518 84.013 78.498 14.597 14.597 11.720 9.894
31 15.420 15.444 124.114 132.094 11.657 11.657 15.407 16.376
32 9.156 9.148 75.695 73.984 14.298 14.298 12.650 12.387
33 10.918 10.938 97.082 105.613 12.028 12.028 12.053 13.544
34 13.462 13.489 72.131 78.747 11.406 11.406 9.371 10.361
35 13.071 13.077 79.557 70.885 13.859 13.859 12.594 10.808
36 12.288 12.292 89.062 92.805 10.603 10.603 10.910 11.328
37 11.505 11.560 69.160 81.163 15.414 15.414 10.419 12.628
38 13.071 13.080 78.369 75.138 9.348 9.348 8.947 7.288
39 12.288 12.320 96.191 103.167 13.805 13.805 14.400 15.893
40 9.156 9.170 71.834 72.669 14.529 14.529 10.605 10.656
41 11.505 11.513 83.715 87.466 12.791 12.791 11.152 11.949
42 9.352 9.344 69.457 72.873 20.362 20.362 12.096 13.126
43 11.114 11.097 70.051 68.182 12.336 12.336 9.171 8.725
44 10.722 10.758 75.398 85.515 16.465 16.465 11.413 13.311
45 12.679 12.671 89.953 85.627 11.091 11.091 11.217 9.507
46 13.854 13.878 117.282 124.564 15.458 15.458 20.722 22.983
47 13.071 13.087 103.320 105.997 12.319 12.319 12.860 12.856
48 13.071 13.094 105.103 115.965 14.224 14.224 14.856 16.998
49 10.722 10.729 72.428 80.236 15.090 15.090 11.159 12.594
50 11.505 11.496 82.527 75.442 16.220 16.220 13.141 11.550
51 11.897 11.892 89.062 93.953 16.227 16.227 13.700 14.765
52 9.352 9.389 62.922 75.152 15.768 15.768 9.717 11.868
53 12.679 12.679 150.551 159.123 16.743 16.743 23.441 24.802
54 11.505 11.526 68.566 72.612 13.985 13.985 9.955 10.632
55 11.897 11.915 102.132 108.588 14.213 14.213 14.537 15.468
56 9.939 9.919 93.221 92.507 13.910 13.910 12.959 13.378
57 13.071 13.040 112.232 99.709 13.101 13.101 14.640 12.012
58 11.505 11.469 89.359 84.472 14.042 14.042 13.200 12.826
59 9.939 9.950 70.348 73.852 13.801 13.801 10.524 11.498
60 12.288 12.257 103.320 95.099 14.094 14.094 20.275 19.655
61 7.199 7.171 72.725 67.563 20.575 20.575 12.808 12.723
62 11.897 11.886 104.212 101.152 15.365 15.365 16.583 16.589
BRS
Tumucumaque 13.071 13.061 133.619 130.121 19.889 19.889 25.014 25.232
Rev. Caatinga
BALDISSERA, J. N. C. et al. Uso do melhor Preditor Linear Não-Viesado (BLUP) na predição de híbridos em feijão. Bioscience Journal, Uberlândia, v. 28, n. 3, p. 395-403, 2012.
BARROS, F. R. et al. Potencial genético de progênies de feijão-caupi segregantes quanto ao tipo da inflorescência. Pesquisa Agropecuária Brasileira, Brasília, v. 46, n. 2, p.182-189, 2011. BEZERRA, A. K. P. et al. Rotação cultural feijão caupi/milho utilizando-se águas de salinidades diferentes. Ciência Rural, Santa Maria, v. 40, n. 5, p. 1075-1082, 2010.
BORGES, V. et al. Seleção de clones de batata-doce pelo procedimento REML/BLUP. Acta Scientiarum Agronomy, Maringá, v. 32, n. 4, p. 643-649, 2010. CORREA, A. M. et al. Estimativas de parâmetros genéticos e correlações entre caracteres fenológicos e morfoagronômicos em feijão-caupi. Revista Ceres, Viçosa, v. 59, n. 1, p. 88-94, 2012.
CRUZIO, A. S. Eficiência da seleção precoce para tamanho de grão e seu efeito em outros caracteres de feijão-caupi. 2014. 79 f. Dissertação (Mestrado
em Genética e Melhoramento) - Universidade Federal do Piauí, Teresina, 2014.
DAMASCENO-SILVA, K. J. Estatística da produção de feijão-caupi. 2011. Disponível em:
<https://www.agencia.cnptia.embrapa.br/gestor/ feijaocaupi/arvore/
CONTAG01_16_510200683536.htm>. Acesso em: 20 nov. 2014.
FREIRE FILHO, F. R. Feijão-caupi no Brasil:
produção, melhoramento genético, avanços e desafios. 1. ed. Teresina, PI: Embrapa Meio-Norte, 2011. 84 p.
GARCIA, C. H.; NOGUEIRA, M. C. S. Utilização da metodologia REML/BLUP na seleção de clones de eucalipto. Scientia Forestalis, Piracicaba, v. 34, n. 68, p.107-112, 2005.
ISHIYAKU, M. F.; SINGH, B. B.; CRAUFURD, P. Q. Inheritance of time to flowering in cowpea (Vigna unguiculata (L.) Walp.). Euphytica, Wageningen, v.142, n. 3, p. 291-300, 2005.
KRAUSE, W.; RODRIGUES, R.; LEAL, N. R. Capacidade combinatória para características agronômicas em feijão de vagem. Ciência Agronômica, Fortaleza, v. 43, n. 3, p. 522-531, 2012.
MACHADO, C. F. et al. Identificação de genótipos de feijão-caupi quanto à precocidade, arquitetura da
planta e produtividade de grãos. Revista Ciência Agronômica, Fortaleza, v. 39, n. 1, p.114-123, 2008. OLIVEIRA, R. M. M. et al. Diallel analysis in cowpea aiming at selection for extra-earliness. Crop Breeding and Applied Biotechnology, Viçosa, v. 16, n. 3, p. 167-173, 2016.
PESEK, J.; BAKER, R. J. Desired improvement in relation to selection indices. Canadian Journal of Plant Science, Ottawa, v. 1, n. 1, p. 215-274, 1969.
PIEPHO, H. P. et al. BLUP for phenotypic selection in plant breeding and variety testing. Euphytica, Wageningen, v. 161, n. 1, p. 209-228, 2008.
PIMENTEL, A. J. B. et al. Estimação de parâmetros genéticos e predição de valor genético aditivo de trigo utilizando modelos mistos. Pesquisa Agropecuária Brasileira, Brasília, v. 49, n. 11, p. 882-890, 2014.
PINHEIRO, L. C. M. et al. Parentesco na seleção para produtividade e teores de óleo e proteína em soja via modelos mistos. Pesquisa Agropecuária Brasileira, Brasília, v. 48, n. 9, p. 1246-1253, 2013. RAMALHO, M. A. P.; FERREIRA, D. F.; OLIVEIRA, A. C. Experimentação em genética e melhoramento de plantas. 2. ed. Lavras, MG: Editora UFLA, 2012. 522 p.
REGAZZI, A. J. et al. Análise de experimentos em látice quadrado com ênfase em componentes de variância. II. Análise conjunta. Pesquisa Agropecuária Brasileira, Brasília, v. 34, n. 11, p. 1987-1997, 1999.
RESENDE, M. D. V. Genética biométrica e estatística no melhoramento de plantas perenes. 1. ed. Brasília, DF: Embrapa Informação Tecnológica; Colombo: Embrapa Florestas, 2002. 975 p.
RESENDE, M. A. V. et al. Divergência genética e índice de seleção via BLUP em acessos de algodoeiro para características tecnológicas da fibra. Pesquisa Agropecuária Tropical, Goiânia, v. 44, n. 3, p. 334-340, 2014.
ROCHA, M. M. et al. Controle genético do comprimento do pedúnculo em feijão-caupi. Pesquisa Agropecuária Brasileira, Brasília, v. 44, n. 3, p. 270-275, 2009.
Rev. Caatinga
ROSADO, A. M. et al. Seleção simultânea de clones de eucalipto de acordo com produtividade, estabilidade e adaptabilidade. Pesquisa Agropecuária Brasileira, Brasília, v. 47, n. 7, p. 964-971, 2012.
SILVA, H. D. et al. Análise de experimentos em látice quadrado com ênfase em componentes de variância. I. Análises individuais. Pesquisa Agropecuária Brasileira, Brasília, v. 34, n. 10, p. 1811-1822, 1999.
SOUSA, C. M. B. Seleção de progênies F2 de feijão-vagem para produção via modelos mistos.
2015. 56 f. Dissertação (Mestrado em Genética e Melhoramento de Plantas) - Universidade Estadual do Norte Fluminense Darcy Ribeiro, Campos dos Goytacazes, 2015.