Acidificante urinário em dieta com elevado excesso de bases para gatos adultos
Carolina Padovani Pires1,Flávia Maria de Oliveira Borges Saad2, Rosana Cláudio Silva Ogoshi3,
Jéssica Santana dos Reis3, João Paulo Fernandes Santos4, Márcio Antonio Brunetto4
ABSTRACT
Maintaining the pH of urine in the ideal range (6.2 - 6.4) is of great importance for health promotion in the lower urinary tract of cats. In the economic and stand ard feed sector this is a major concern, given that the animal urine tends to be alkaline after food consumption of those commercial segments, which predispose to the formation of struvite urolith. Therefore, this study aimed to study the effects of increasing levels of urinary acidifiers (0.0%, 0.3%, 0.6% and 0.9%, on a dry matter base) in feed with high excess base over the acid-basic balance in the organism, apparent digestibility coefficients of nutrients, urinary pH, hydro-electrolyte balance in cats, as well as the adequacy of equations proposed in the literature to estimate the urinary pH. Twenty-four adult cats, males and females were distributed in a completely randomized design, consisting of six animals per treatment. The dry matter content of urine presented a quadratic behavior (p<0,05; y = 9.5863 + 3.2299x + 0.7871x2 R2 = 99,91%), HCO
3-, total CO2 and excess blood base during the period in which the animals were fed were high when including 0.9% acidifier compared to 0.6% (p<0.05). In contrast, the use of the additive did not change the urinary pH, blood electrolyte concentration, nutrient digestibility, fecal score, food and water intake (p>0.05). The equations proposed in the literature, which use excess of base in feed to estimate urinary pH, overestimated the pH values found in this study.
Index terms: Feline, blood gas, pH.
RESUMO
A manutenção do pH da urina na faixa ideal (6,2 - 6,4) é de grande importância para a promoção da saúde do trato urinário inferior de felinos. Em alimentos do segmento econômico e standard essa é uma grande preocupação, já que a urina dos animais tende a ser alcalina, após o consumo de alimentos desses segmentos comerciais, predispondo à formação de urólito de estruvita. Nesse sentido, neste trabalho, objetivou-se estudar os efeitos de níveis crescentes de acidificante urinário (0,0%; 0,3%; 0,6%; e 0,9%, em base de matéria seca) em alimento com elevado excesso de bases sobre o balanço ácido-básico do organismo, coeficientes de digestibilidade aparente dos nutrientes, pH urinário, equilíbrio hidro-eletrolítico de gatos, bem como a adequação de equações propostas na literatura para estimar o pH urinário. Foram utilizados vinte e quatro gatos adultos, machos e fêmeas, distribuídos em delineamento inteiramente casualizado, constituído de seis animais por tratamento. A matéria seca da urina apresentou comportamento quadrático (p<0,05; y = 9.5863 + 3.2299x + 0.7871x2 R2 = 99,91%), o HCO
3 -, CO
2 total e excesso de bases sanguíneos, no período em que os animais estavam alimentados, apresentaram-se elevados, na inclusão de 0,9% de acidificante em comparação a 0,6% (p<0,05). Em contrapartida, a utilização do aditivo não alterou o pH urinário, a concentração de eletrólitos sanguíneos, digestibilidade dos nutrientes, escore fecal, consumo de alimento e de água (p>0,05). As equações propostas na literatura, que utilizam o excesso de bases do alimento para estimar o pH urinário, superestimaram os valores de pH encontrados no presente estudo.
Termos para indexação: Felinos, hemogasometria, pH.
(Received in march 10, 2013 and approved in may 3, 2013) INTRODUCTION
Urolithiasis is a disorder of the urinary tract, characterized by the appearance of macroscopic concretions that form in the urinary tract (CONFER; PANCIERA, 1998). When urine is supersaturated and the urine pH is favorable for the crystallization, mineral precipitates out of the solution to form crystals
1Universidade Federal de Lavras/UFLA – Lavras – MG – Brasil
2Universidade Federal de Lavras/UFLA – Departmento de Zootecnia/DZO – Cx. P. 3037 – 37200-000 – Lavras – MG – Brasil – [email protected] 3Universidade Federal de Lavras/UFLA – Departmento de Zootecnia/DZO – Lavras – MG – Brasil
4Universidade de São Paulo/USP – Departamento de Nutrição e Produção Animal – São Paulo – SP – Brasil
(ROBERTSON et al. 2002; HOUSTON et al. 2003), which when accumulated can form uroliths (HOUSTON et al. 2003).
tract, since the feed ingredients and eating patterns can influence the parameters volume, pH and concentration of urinary solutes (MARKWELL; BUFFINGTON; SMITH, 1998).
In Brazil most dogs and cats that receive feed from the standard and economic segment, which are
characterized by variable formulation, besides higher concentrations of minerals and low levels of crude protein (CARCIOFI et al., 2006), suggesting that an expressive portion of Brazilian feeds possibly induce animals to produce alkaline urine, favoring the formation of struvite urolithiasis.
Therefore, this study aimed at evaluating increasing levels of urinary acidifiers in standard commercial feed
with high excess of base, for adult cats, on digestibility of nutrients, fluid balance, urine pH and acid-base balance through venous blood gas for later correlation between urinary pH found with equations available in the literature to predict thereof.
MATERIAL AND METHODS
The study was conducted at the CENAC (Centro Experimental em Nutrição de Animais de Companhia / Experimental Center for Pet Nutrition), in the Department of Animal Science, from the Universidade Federal de Lavras, with approval by the Bioethics Committee for the Use of Animals (NINTEC / PRP-UFLA) in the institution (protocol 021 / 2009).
Twenty-four adult male and female SRD cats were used, with an average age of three and a half years, and average body weight of 3.50 ± 0.73 kg, distributed in a completely randomized design consisting of four experimental treatments, namely: control diet (CD); control diet with addition of 0.3% of urinary acidifiers (CD03); control diet with addition of 0.6% of urinary acidifiers (CD06); and control diet with addition of 0.9% of urinary acidifiers (CD09), totaling six animals per treatment. The control diet consisted of feed from the
sta nd a rd segment, as ranked by PIQ PET
(ASSOCIAÇÃO NACIONAL DOS FABRICANTES DE ALIMENTOS PARA ANIMAIS DE ESTIMAÇÃO-ANFAL PET, 2008), which had a predominance of
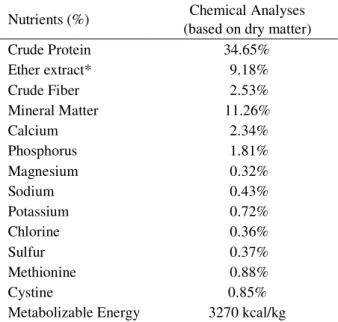
Table 1 – Composition and chemical analyses of control diet based on dry matter (DM), and macro-minerals composition of experimental diets.
Table 2 – Mineral composition of the urinary acidifier used in the present study.
Composition: poultry viscera meal, meat and bone meal, fish meal, whole corn ground, brown rice, wheat bran, corn gluten meal 60%, soybean oil, poultry oil, poultry hydrolyzed and / or byproducts, Yucca schid igera extract, taurine, sodium chloride, mannanoligosaccharides, minerals complex (Zn), vitamin mineral premix, antioxidants and antifungal.
*Results found by the acid hydrolysis ether extract technique.
Composition: citric acid; phosphoric acid, silicon oxide, citrate and water.
alkaline cations, which promoted the formation of alkaline urine. The basic composition as well as the chemical analyzes of the diet used in the study are shown in table 1.
The mineral composition of urinary acidifiers is presented in table 2.
The amount of feed supplied to the animals met the recommended by the National Research Council-NRC (2006) for adult cats in maintenance, through the formula: NEM = 100 x (body weight) 0.67. The total quantity of feed
for each animal was offered once daily at 8h00 am and remained available to the animals for 24 hours.
Calcium Magnesium Sodium Potassium Phosphorus Sulfur Chlorine
Urinary Acidifier
- - 0.2% - 18.02% 3.25% -
Nutrients (%) Chemical Analyses
(based on dry matter)
Crude Protein 34.65%
Ether extract* 9.18%
Crude Fiber 2.53%
Mineral Matter 11.26%
Calcium 2.34%
Phosphorus 1.81%
Magnesium 0.32%
Sodium 0.43%
Potassium 0.72%
Chlorine 0.36%
Sulfur 0.37%
Methionine 0.88%
Cystine 0.85%
and were maintained in premium feed, with the goal of evaluate the difference between the segments within the experimental groups, and possible modulation by levels of acidifiers. Therefore, urinary pH was measured by a digital pH meter (QUIMIS, Model Q400A, Diadema / SP), which was titled initial pH, and after that moment, the animals began to receive the experimental feed. To reevaluate the final pH, the adaptation consisted of twelve days and three days of collection. To capture and retain the urine in the collection phase, plastic bottles containing 0.1 g of thymol p.a. attached to funnels trays in the metabolic cages were used. After 24 hours, the bottles were removed and immediately urinary pH was measured.
Based on the base excess of the control diet were calculated pH values predicted by the equations of Kienzle and Wilms-Eilers (1994) and Yamka, Friesen and Schakenraad (2006), the calculation being based on the doses of acidifiers used in the study and in the basic composition thereof.
On the sixteenth experimental day, the acid-base balance of the animals was evaluated, by venous blood gas analysis, with samples being collected at 8h00 am, before the supply of feed and six hours after exposure to the diet. For certification of fasting, the animals’ feed was removed at 22h00 pm the previous day.
For collection of blood samples via the jugular vein only physical restraint was performed, 3mL syringes were used, previously heparinized, and gauge needles 25x7mm, to collect approximately 1mL of venous blood. Immediately after the collection, all the air that could be present in the syringe in contact with the blood was removed, and automatically the needle was sealed, using a rubber test tube cap where the needle was attached, thus avoiding the entry of atmospheric air therein. The syringes, properly identified and under cooling, were immediately sent to the Hemocell Laboratory of Clinical Analysis (Lavras / MG). On average within 20 minutes, the samples were processed by performing a blood gas by Potentiometric-ABL5 Radiometer as well as the determination of concentrations of sodium (mmol/L), potassium (mmol/L) and chloride (mmol/L) by flame photometry. The blood gas analysis determined the blood pH, carbon dioxide pressure (CO2p) in mmHg, bicarbonate concentration ([HCO3-]) in mmol/L,
total carbon dioxide (tCO2) in mmol/L, oxygen saturation (O2Sat) in %, oxygen partial pressure (O2p) in mmHg, and base excess (BE) in mmol/L.
The data were analyzed with Statistical Analysis System-Sas statistical package (2004). Given the statistics assumptions, normality and homogeneity of residues, the To determine the apparent digestibility coefficient,
fecal output, percentage of water in the feces, fecal score and water balance, the adaptation stage of animals to the experimental diets consisted of seven days, and collection phase of five days, in which animals remained throughout the period in metabolic cages.
In the collection stage, feces were collected, evaluated for fecal score (1 = watery – liquid that can be poured; 2 = soft, unformed – stool assumes shape of container; 3 = soft, formed, moist – softer stool that retains shape; 4 = hard, formed, dry stool – remains firm and soft; 5 = hard, dry pellets – small, hard mass), then they were weighted and packed in plastic bags, taken to the freezer at -20º C. After pre-drying, they were ground in a Thomas-Wiley hammer mill, using a 1 mm sieve and packed into plastic pots previously identified for subsequent chemical analyzes.
Diets and feces were analyzed for dry matter, crude protein, ether extract on acid hydrolysis, mineral matter, organic matter content calculated by difference, crude fiber and gross energy. The chemical analyzes were performed according to the methodology described by Association Of The Official Analitical Chemists-AOAC (1995). The determination of gross energy was performed in PARR adiabatic calorimeter bomb, according to the procedure described by Silva and Queiroz (2002) in Laboratory Animal Research at UFLA. The determinations of minerals (calcium, phosphorus, magnesium, sodium, potassium, chloride and sulfur) were performed at the Instituto Mineiro de Agricultura (Institute of Agriculture of Minas Gerais, Contagem / MG), since the determination of sulfur amino acids (methionine and cystine) were performed in the laboratory of the company M. Cassab (São Paulo / SP).
For the estimation of insensible loss, data on the percentage of water in the feces and urine was used, water and feed intake and amount of estimated metabolic water during the first three days of the collection period, according to the methodology described by Buffington and Chew (1999), wherein the total water intake (water in the feed, drink water and metabolic water, estimated by multiplying the digestible protein intake by 0.396, digestible carbohydrate by 0.566 and digestible fat by 1.071) was subtracted from the urinary and fecal excretion of water, which corresponds to the total sum of losses to maintain balance equal to zero.
data were evaluated by parametric statistics, except for the fecal score which was analyzed by the Kruskal-Wallis test, which is a non-parametric test. Urine pH was analyzed by repeated measures in time, the effect of time was compared by the T test at 5% significance. The other variables were analyzed by simple polynomial regression, however when it did not adjust to R2 that did not respond appropriately to
the behavior of the data, the means were compared by the SNK test. The data drinking water, feed water, urine volume and dry matter of urine was analyzed by Pearson correlation.
RESULTS AND DISCUSSION
The data regarding the average daily intake, fecal production, percentage of water in the feces and fecal score are shown in table 3.
It can be observed that there was no significant difference (p>0.05) among treatments in average daily
Table 3 – Averages and variance coefficients of average intake based on dry matter (DM), fecal output, percentage of water in feces and fecal score.
p*: significance p<0.05; CV: coefficient of variation. **Kruskal-Wallis
intake of dry matter, fecal production, percentage of water in the feces and fecal score. Thus, the inclusion of urinary acidifier at the doses used in this study did not affect feed intake and stool characteristics of adult cats.
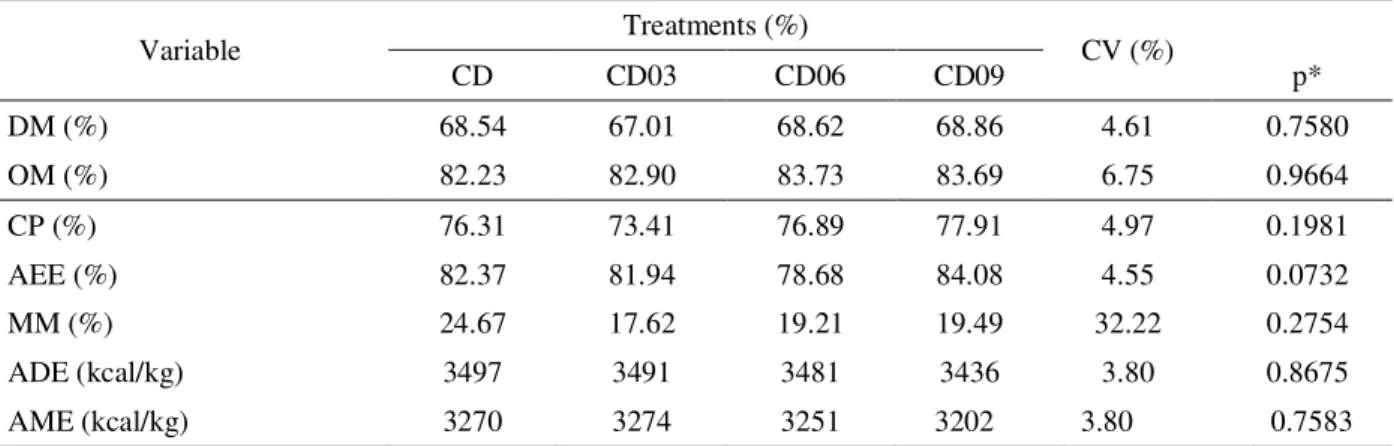
The digestibility coefficients of the experimental diets are presented in table 4.
It is verified that there was no significant difference (p>0.05) for the coefficients of apparent digestibility of nutrients, as well as digestible and metabolizable energy. However, it can be seen that diet showed low digestibility, which may be attributed to its composition.
The data for the water balance of the animals are shown in table 5.
It was observed that there was no significant difference (p>0.05) among treatments for the consumption of water in the feed and drinking water, urine output and insensible losses.
Table 4 – Averages and variance coefficients of apparent digestibility of dry matter (DM), organic matter (OM), crude protein (CP), acid hydrolysis ether extract (AEE), mineral matter (MM), apparent digestible energy (ADE) and apparent metabolizable energy (AME).
p*: significance p<0.05; CV: coefficient of variation.
Variable Treatments (%) CV (%)
CD CD03 CD06 CD09 p*
DM (%) 68.54 67.01 68.62 68.86 4.61 0.7580
OM (%) 82.23 82.90 83.73 83.69 6.75 0.9664
CP (%) 76.31 73.41 76.89 77.91 4.97 0.1981
AEE (%) 82.37 81.94 78.68 84.08 4.55 0.0732
MM (%) 24.67 17.62 19.21 19.49 32.22 0.2754
ADE (kcal/kg) 3497 3491 3481 3436 3.80 0.8675
AME (kcal/kg) 3270 3274 3251 3202 3.80 0.7583
Treatments
Variable CD CD03 CD06 CD09 CV (%) p*
DM Intake (g/day) 76.55 75.41 75.80 76.55 19.39 0.9989
Feces output (as-is) (g/day) 66.22 67.74 61.91 65.10 23.80 0.9381
% of water in feces 57.78 57.93 61.76 62.55 17.12 0.8071
The volume of water intake varies considerably depending on the condition of the animal, the environment and the type of diet, so the amplitude for intake is too large. Feldman and Nelson (2004) cite that cats that eat dry feed should eat between 20 to 70mL/kg/day. Whereas animals of this experiment showed average weight of 3.5kg, they should intake approximately 70 to 245ml of water per day.
The percentage of dry matter can be interpreted as the amount of solute present in urine, which may be composed of cells, bacteria, proteins, minerals and crystals. This variable showed a significant difference (p<0.05) between treatments, and the equation that fits best is the quadratic (R2 = 99.91%). It may be related to the increase in
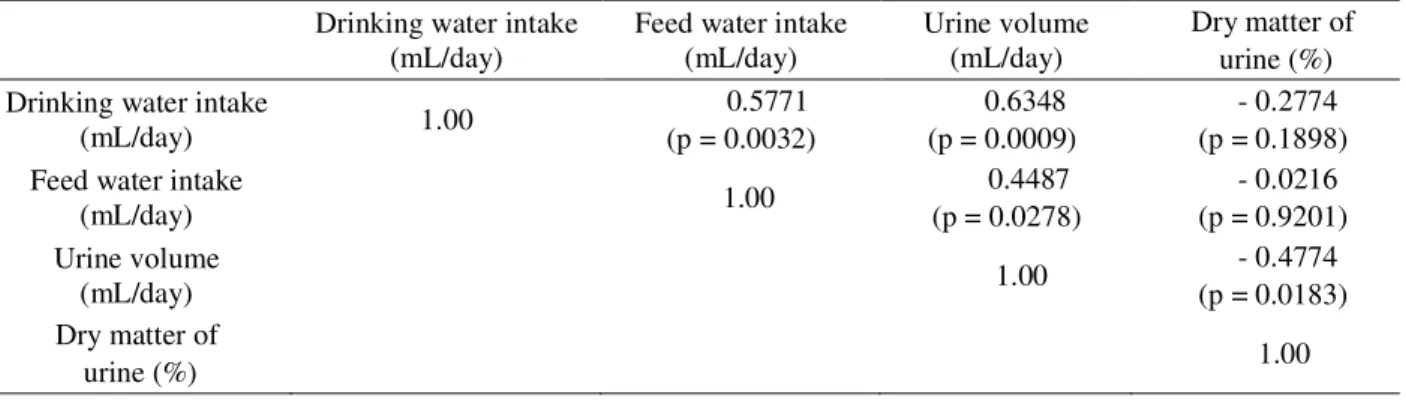
urine volume in CD03 treatment. Even though without statistical difference for this variable, it can be verified that there was a positive correlation between drinking water and urine volume (p<0,05, r = 0.6348) and a negative correlation between urine volume and dry matter of urine (p<0,05, r = - 0.4774) as shown in table 6. Therefore, the dry urine may have responded to the urine volume, as
Table 5 – Averages and variance coefficient of drinking water intake, feed water, urinary volume, dry matter in the urine and insensible losses.
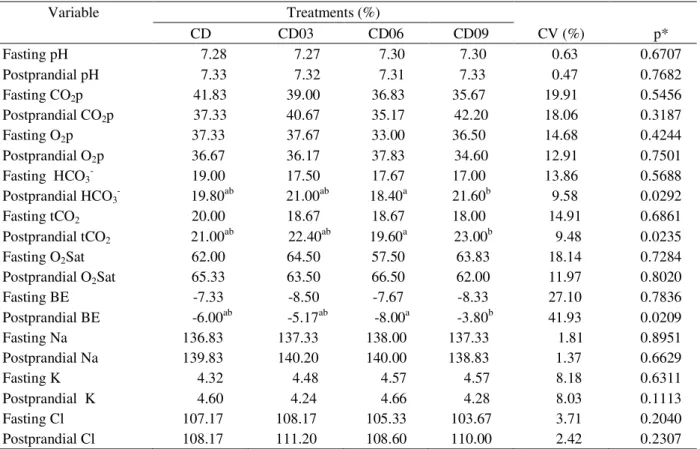
recommended by Markwell, Buffington and Smith (1998) for reducing the potential formation of uroliths in cats. The average values measured through blood gas examination, as well as the concentration of serum sodium, potassium and chloride are described in table 7.
The values of blood pH, carbon dioxide partial pressure (CO2p), oxygen partial pressure (O2p), and oxygen saturation (O2Sat) showed no significant difference (p>0.05) among treatments, in the periods when the animals were fasted and fed. The values for blood pH remained within the reference values for the species (7.27 – 7.40) (DIBARTOLA, 2011), indicating that the animals were in acid-base equilibrium, and that the content of acidifier added to the diet did not affect this variable.
The blood concentration of bicarbonate (HCO3-) is
a parameter related to metabolic alterations, and despite the animals in group CD09 showed higher concentration than the ones in the CD06 treatment, it was observed that the bicarbonate concentration (HCO3-) in the treatments
remained very nearly to the reference range for the species
p*: significance p<0.05; CV: coefficient of variation; 1y = 5.6508 + 0.7055x R2 = 50.06%; 2y = 9.5863 + 3.2299x + 0.7871x2 R2 = 99.91%.
p*: significance p<0.05.
Table 6 – Correlation between drinking water intake (mL/day), feed water intake (mL/day), urine volume (mL/day) and dry matter of urine (%).
Treatments (%) CV
(%) p* L Q
Variable CD CD03 CD06 CD09
Drinking water intake (mL/day) 122.64 132.69 117.65 119.82 17.51 0.6631 -
Feed water intake (mL/day) 5.45 6.60 5.92 5.98 19.74 0.4379 - -
Urine volume (mL/day) 36.38 51.73 36.22 37.54 36.22 0.1919 - -
Dry matter of urine (%) 7.16 6.23 7.02 9.24 24.66 0.0182 0.02041 0.02062
Insensible losses (mL/day) 216.84 210.19 208.63 213.41 22.76 0.8793 - -
Drinking water intake (mL/day)
Feed water intake (mL/day)
Urine volume (mL/day)
Dry matter of urine (%) Drinking water intake
(mL/day) 1.00
0.5771 (p = 0.0032)
0.6348 (p = 0.0009)
- 0.2774 (p = 0.1898) Feed water intake
(mL/day) 1.00
0.4487 (p = 0.0278)
- 0.0216 (p = 0.9201) Urine volume
(mL/day) 1.00
- 0.4774 (p = 0.0183) Dry matter of
Table 7 – Averages and variance coefficients of blood pH, carbon dioxide partial pressure (CO2p) (mmHg), oxygen partial pressure (O2p) (mmHg), bicarbonate concentration (HCO3-) (mmol/L), total carbon dioxide (tCO
2) (mmol/L),
oxygen saturation (O2Sat) (%), base excess (BE) (mmol/L), sodium (Na) (mmol/L), potassium (K) (mmol/L), and serum chlorine (Cl) (mmol/L) from the fasting and six hours form the feeding.
Averages followed by different letters in the lines differ statically in the SNK test. p*: significance p<0.05; CV: coefficient of variation. (18.0 – 23.2mmol/L) (DIBARTOLA, 2011), for the fasting
animals and within the reference range for the postprandial animals.
Regarding the excess of base in the blood, Ching et al. (1989) report that urinary acidifiers can cause metabolic acidosis, however, none of the treatments differed from the CD treatment and therefore it is no possible to infer that the acidifier has caused changes in the acid-base equilibrium on the animals. The EB values remained within the reference range species (-1 to -7) (LEE; DROBRAZ, 2003), except for the CD06 treatment which was slightly reduced.
Both for the EB to HCO3-, would expect a linear
effect, but had been observed reduction in CD06 compared to CD09. There seems no physiological explanation for that, but in a similar manner to that observed, Souza et al. (2002) in an increasing levels potassium chloride to chickens, has found hemogasometric difference in
response according to sex, in which females showed a linear effect for blood pH and BE, while in males these parameters showed quadratic behavior. In present study the animals were randomly distributed, and in all treatments were there animals of both sexes.
There was no significant difference (p>0.05) for serum electrolytes, however by the intervals suggested by Dibartola (2011) (sodium: 149 - 162mmol/L; potassium: 3.5 – 5.5mmol/L and chloride: 118 – 124mmol/L) we can see that in all treatments in both fasting and after feeding, the animals showed hyponatremia and hypochloremia.
For an effective evaluation of hyponatremia, it is necessary to evaluate the blood osmolality, however, this assessment was not performed in this study and therefore it is only possible to make inferences about it. Such a change occurs when the animal does not efficiently excrete the consumed water or when insensitive fluids or urine lost is associated with increased volume of fluid ingested or
Variable Treatments (%)
CD CD03 CD06 CD09 CV (%) p*
Fasting pH 7.28 7.27 7.30 7.30 0.63 0.6707
Postprandial pH 7.33 7.32 7.31 7.33 0.47 0.7682
Fasting CO2p 41.83 39.00 36.83 35.67 19.91 0.5456
Postprandial CO2p 37.33 40.67 35.17 42.20 18.06 0.3187
Fasting O2p 37.33 37.67 33.00 36.50 14.68 0.4244
Postprandial O2p 36.67 36.17 37.83 34.60 12.91 0.7501
Fasting HCO3- 19.00 17.50 17.67 17.00 13.86 0.5688
Postprandial HCO3- 19.80ab 21.00ab 18.40a 21.60b 9.58 0.0292
Fasting tCO2 20.00 18.67 18.67 18.00 14.91 0.6861
Postprandial tCO2 21.00ab 22.40ab 19.60a 23.00b 9.48 0.0235
Fasting O2Sat 62.00 64.50 57.50 63.83 18.14 0.7284
Postprandial O2Sat 65.33 63.50 66.50 62.00 11.97 0.8020
Fasting BE -7.33 -8.50 -7.67 -8.33 27.10 0.7836
Postprandial BE -6.00ab -5.17ab -8.00a -3.80b 41.93 0.0209
Fasting Na 136.83 137.33 138.00 137.33 1.81 0.8951
Postprandial Na 139.83 140.20 140.00 138.83 1.37 0.6629
Fasting K 4.32 4.48 4.57 4.57 8.18 0.6311
Postprandial K 4.60 4.24 4.66 4.28 8.03 0.1113
Fasting Cl 107.17 108.17 105.33 103.67 3.71 0.2040
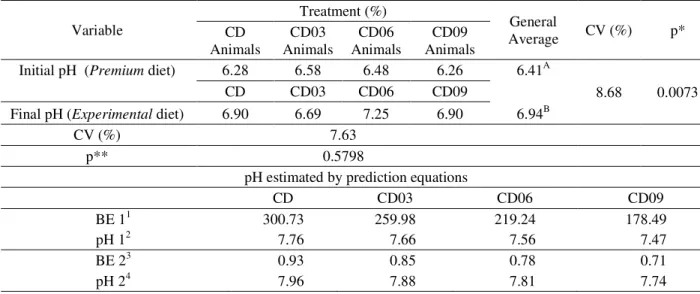
Table 8 – Averages and variance coefficients of urinary pH observed in the treatments in the initial and final stages and excess of base and pH estimated by the prediction equations.
p*: significance p<0.05 for period effect; p**: significance p<0,05 for treatment effects; CV: coefficient of variation. 1(mEq/Kg DM) = (49.9 x Ca) + (82.3 x Mg) + (43.5 x Na) + (25.6 x K) – (64.6 x P) – (62.4 x S) – (28.2 x Cl) 2pH = 7.1 + 0.0019 x BE1 + (9.7x10⁻⁷) x BE12 Kienzle and Wilms-Eilers (1994)
3(% DM) = Na + K + (0.89 x Ca) + (1.58 x Mg) – (0.93 x Cl) – (1.61 x S) – (1.04 x P) 4pH = 7.03 + BE2 Yamka, Friesen and Schakenraad (2006)
received by the parenteral route, which causes the sodium concentration to be smaller, or when there is no restriction on the intake of minerals (DIBARTOLA, 2011), however regarding the intake of sodium, it is found that the content present in the feed (present 0.43% per kg in CD) were above the minimum (0.2% per kg) recommended by the Association of American Feed Control Officals-AAFCO (2004) for cats maintenance.
The hypochloremia observed in animals may be related to the concentration of the mineral in the feed, which was close to the minimum level recommended by AFFCO (2004), 0.3% per kg. Regarding the composition of minerals in the diet, it is noteworthy that calcium, phosphorus and magnesium showed very high levels of assurance, higher than recommended by AAFCO (2004) for dogs and extended to cats.
Table 8 shows the values of urinary pH measured during the experimental trial, and the values of base excess and urinary pH estimated by prediction equations. Values showed as initial pH refer to dates based on providing a same diet of premium segment, while the values collected
with experimental diet in order to verify the urinary pH modulation by levels of acidifying this titled final pH.
It is possible to verify that there was no significant difference (p>0.05) for the initial pH of animals among treatments, thus, the animals were randomly distributed
Variable
Treatment (%)
General
Average CV (%) p*
CD Animals
CD03 Animals
CD06 Animals
CD09 Animals
Initial pH (Premium diet) 6.28 6.58 6.48 6.26 6.41A
8.68 0.0073
CD CD03 CD06 CD09
Final pH (Experimental diet) 6.90 6.69 7.25 6.90 6.94B
CV (%) 7.63
p** 0.5798
pH estimated by prediction equations
CD CD03 CD06 CD09
BE 11 300.73 259.98 219.24 178.49
pH 12 7.76 7.66 7.56 7.47
BE 23 0.93 0.85 0.78 0.71
pH 24 7.96 7.88 7.81 7.74
among treatments and were not influenced by the initial pH. Evaluating the final pH, there was also no significant difference between treatments (p>0.05). However the evaluation between the average of the initial and final period, a significant difference (p<0.05) was observed.
This difference measured between periods is explained by the effect of diet. The constituents of the feed influence urinary pH (MARKWELL; BUFFINGTON; SMITH, 1998), resulting effect from its nutrients and the acids derived thereof (ALLEN, KRUGER, 2000).
Despite the great heterogeneity among products in the segment, premium feeds tend to have cation-anion
balance that is appropriate to reflect on urinary pH in the ideal range for prevention of struvite uroliths and calcium oxalate. In the feed from the economic and standard
segment, the heterogeneity of products as well as the composition and digestibility of nutrients, has become even more pronounced since no fixed formulation is required and product has low added value, with high content of protein ingredients and mineral matter, especially calcium, a fact that contributes to the cation-anion imbalance and consequent formation of urine with alkaline character.
evaluate the effectiveness of different formulations of urinary acidifiers, since in the current study there was no significant difference in urinary pH, which ones were above the ideal range.
In this regard, the explanation for this finding is related to the diet composition as well as the inclusion of low acidifier, since from equation to determine the optimal dose found to values between 1.9 and 2.4% would be required for modulating urinary pH of the animals, but these values are rather high, and might be associated with metabolic disorders. Such disorders reported by Ching et al. (1989) in the chronic use of 1.5% ammonium chloride; Dow et al. (1990) in a diet restricted in potassium
and acidified with ammonium chloride; and Izquierdo and
Czarnecki-Maulden (1991) with ammonium chloride and calcium, but without any changes to the phosphoric acid in a dose of 0.68%.
When assess the effectiveness of phosphoric acid in a diet for cats, Spears, Grieshop and Fahey (2003) found quadratic effect for dose levels (0.4%, 0.6% and 0.8%), and Izquierdo and Czarnecki-Maulden (1991) observed that the level 0.17% was effective in maintaining urinary pH of animals within the ideal range of 6.4, without difference from this to other levels (0.34%; 0.51% and 0.68%). This is an important factor to be considered about the reduced doses of acidifiers used in this study. However both Izquierdo and Czarnecki-Maulden (1991) and Spears, Grieshop and Fahey (2003) showed no excess bases for the provided diets.
It is important to emphasize that in this study was chosen formulations usually applied in feed segment
standard and economic, in order to evaluate acidifier
inclusion in products which represents the largest market share.
The estimation of urinary pH through prediction formulas is an easy way to evaluate the effectiveness of diet in maintaining urinary pH in the ideal range. In this sense, there are the equations Kienzle and Wilms-Eilers (1994) and Yamka, Friesen and Schakenraad (2006). In determining the urinary pH of cats fed 12 different diets and correlate to those estimated by the equations proposed by Kienzle and Wilms-Eilers (1994) and Yamka, Friesen and Schakenraad (2006), Carciofi (2007) cites intermediate correlations, with r = 0.49 and r = 0.51, respectively.
However this work can be seen that the pH estimated by prediction equations overestimated, according to data presented in Table 8. One explanation for this finding was the high concentration of minerals in the diet. According to Santos et al. (2011), high mineral
content in the diet reflects in a reduction of its absorption by competition for the sites of absorption and complex formation between them. Thus, the consequence would be overestimated pH values to those predicted by equations based on feed composition.
Furthermore, it is important to highlight that the absorption of calcium and magnesium is relatively low, however, the absorption of associated anions can be high and influences the urinary pH. The uptake of not metabolized anions, in excess to their associated cations, produces acidifying effect, and the converse is true (Swenson; Reece, 1996), in this sense, cations associated with organic acids could generate divergent effects in the equivalent levels of cations, but from inorganic sources.
Finally, hypochloremia associated with hyponatremia may have influenced the urinary pH, contributing, so the estimated value by the equations proposed in the literature were not similar to those found in the assay.
CONCLUSIONS
The use of urin ar y acidifier s in th e concentrations studied did not affect the parameters evaluated, with the exception of dry matter of urine. The urine pH values when the animals received the experimental diet were high comparing the period in which were given the premium diet, failing to effective of the acidifying formulation, in tested doses, in diets with high base excess.
Highlights the importance of formulating of diet, regarding ingredients and optimal levels of urinary acidifier, as well as the necessity of in vivo tests to evaluate the effectiveness of feed in modulating urinary pH of the animals, since the prediction equations of this variable does not were effective in the present work.
REFERENCES
ALLEN, T.A.; KRUGER, J.M. Enfermedad Felina De Las Vias Urinarias. In: HAND, M.S. et al. Nutrición clinica en pequeños animales. Bogotá: Panamericana, 4. ed., p.811-845, 2000.
ASSOCIATION OF AMERICAN FEED CONTROL OFFICIALS - AAFCO. Dog and cat nutrient profile. Official Publication of the Association of American Feed Control Officials Incorporated. Oxford: AAFCO, 2004, 2076p.
ASSOCIATION OF THE OFFICIAL ANALITICAL CHEMISTS. – AOAC Official and tentative methods of analysis. AOAC: Washington, 16. ed., 1995, 474p. BUFFINGTON, C. A. T.; CHEW, D. J. Diet therapy in cats with lower urinary tract disorders. Veterinary Medicine, v.94, n.7, p.626, 630, jul,1999.
CARCIOFI, A. C. et al. Composição nutricional e avaliação de rótulo de rações secas para cães
comercializadas em Jaboticabal-SP. Arquivo Brasileiro de Medicina Veterinária e Zootecnia, Belo Horizonte, v.58, n.3, p.421-426, jun, 2006.
CARCIOFI, A. C. Métodos para estudo das respostas metabólicas de cães e gatos a diferentes alimentos. Revista Brasileira de Zootecnia, Viçosa, v.36, p.235-249, jul, 2007. Suplemento Especial.
CHING, S. V. et al. The effect of chronic dietary acidification using ammonium chloride on acid-base and mineral metabolism in the adult cat. Journal of Nutrition, Philadelphia, v.119, n.6, p.902-915, jun, 1989.
CONFER, A. W.; PANCIERA, R. J. Sistema urinário. In: CARLTON, W. W.; MCGAVIN, M. D. Patologia
veterinária especial de Thomson. Porto Alegre: Artmed, 1998, 2. ed., p.228-265.
DIBARTOLA, S. P. Fluid, electrolyte, and acid-base disorders in small animal practice In: ______. Fluid Therapy In Small Animal Practice. Philadelphia: W. B. Saunders, 2011, 4. ed., 760p.
DOW, S.W. et al. Effects of dietary acidification and potassium depletion on acid- base balance, mineral metabolism and renal function in adult cats. The Journal of Nutrition, Philadelphia, v.120, n.6, p.569-578, june, 1990.
FELDMAN, E. C.; NELSON, R. W. Canine Diabes Mellitus. In:______. Canine and feline endrocrinology
and reproduction. Philadelphia: W. B. Saunders, 2004, 3. ed., p. 580-615.
HOUSTON, D. M. et al. Feline urethral plugs and bladder uroliths: a review of 5484 submissions 1998-2003. The Canadian Veterinary Journal, Bethesda, v.44, n.12, p.974-977, dec, 2003.
IZQUIERDO, J. V.; CZARNECKI-MAULDEN, G. L. Effect of various acidifying agents on urine pH and acid-base balance in adult cats. The Journal of Nutrition, Philadelphia, v.121, n.1, p.89-90, jan, 1991.
KIENZLE, E.; WILMS-EILERS, S. Struvite diet in cats: effect of ammonium chloride and carbonates on acid balance of cats. The Journal of Nutrition, Philadelphia, v.124, n.12, p. 2652-2659, dec, 1994.
KRUGER, J. M.; ALLEN, T. A. Feline lower urinary tract disease. In: HAND, M. S. et al. Small animal clinical nutrition. Missouri: Mark Morris Institute, 2000, 4. ed., p. 689-724.
LEE, J. A.; DROBATZ, K. J. Characterization of the clinical characteristics, electrolytes, acid-base, and renal parameters in male cats with urethral
obstruction. Journal of Veterinary Emergency and Critical Care, San Antonio, v.13, n.4, p.227-233, dec, 2003.
MARKWELL, P.J. BUFFINGTON, C.T. SMITH, B.H.E. The effect of diet on lower urinary tract diseases in cats. Journal of Nutrition. Philadelphia v.128, n.12, p.2753s-2757s, dez, 1998.
NATIONAL RESEARCH COUNCIL-NRC. Nutrient requirements of dogs and cats. Washington: The National Academy, 2006, 398 p.
ROBERTSON, W. G et al. Predicting the crystallization of urine from cats and dogs with respect to calcium oxalate and magnesium ammonium phosphate (struvite). The Journal of Nutrition, Philadelphia, v.132, n.6, p.1637-1641, jun, 2002.
SILVA, D. J.; QUEIROZ, A. C. Análise de alimentos: métodos químicos e biológicos. Viçosa: UFV, 2002, 3. ed., 235 p. SOUZA, B. B. et al. Efeito da suplementação do coleto de potássio na dieta sobre o equilíbrio ácido-básico e o desempenho de frangos de corte durante o verão. Ciência e Agrotecnologia, Lavras, v.26, n.6, p.1297-1304, nov/dez, 2002. SPEARS, J.; GRIESHOP, C.; FAHEY, G.C. Evaluation of sodium bisulphate and phosphoric acid as urine acidifiers for cats. Archives of Animal Nutririon, London, v.57, n.5, p.389-398, sep, 2003.
STATISTICAL ANALYSIS SYSTEM-SAS. SAS User’s guide: statistics version 9.1.1. Cary, 2004.
SWENSON, M. J.; REECE, W. O. N. Dukes: Fisiologia dos animais domésticos. Rio de Janeiro: Ganabara Kogan, 1996, 11. ed., 856p.