www.scielo.br/aabc
Equity, quality and relevance in higher education in Brazil
SIMON SCHWARTZMAN*
Instituto de Estudos do Trabalho e Sociedade, 22210-030 Rio de Janeiro, RJ, Brasil
Manuscript received on September 9, 2003; accepted for publication on October 28, 2003.
ABSTRACT
Brazilian higher education has doubled its size in the 1990s, going from 1.5 million to more than 3 million students in the period. This expansion was mostly due to the growth of private education, which, in 2002, accounted for about two thirds of the enrollment. Is expansion making higher education more accessible to persons coming from the poorer segments of society? Is the quality of higher education suffering by the speed of this expansion? Is Brazil educating enough qualified persons to attend to the country’s needs to participate in the new, knowledge-intensive and global economy? What public policies should be implemented, in order to foster the values of social equity and relevance? What are the policy implications of these developments? This article looks at the available evidence, and suggests some answers to these questions.
Key words:higher education, human capital, equity, labor market, education policy.
INTRODUCTION
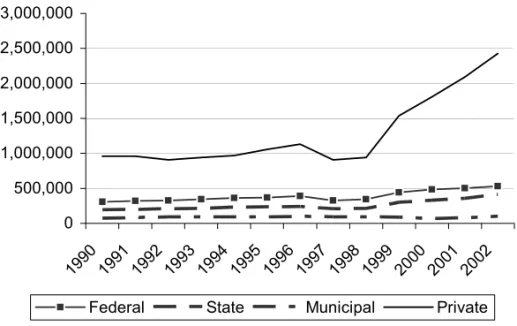
Brazilian higher education has doubled its size in the 1990s, going from 1.5 million to more than 3 million students in the period (Figure 1). This ex-pansion was mostly due to the growth of private ed-ucation, which, in 2002, accounted for about 70% of the enrollment. Is expansion making higher edu-cation more accessible to persons coming from the poorer segments of society? Is the quality of higher education suffering by the speed of this expansion? Is Brazil educating enough qualified persons to at-tend to the country’s needs to participate in the new, knowledge-intensive, global economy? What pub-lic popub-licies should be implemented, in order to foster the values of social equity and relevance? What are the policy implications of these developments? This article looks at the available evidence, and suggests some answers to these questions.
*Member of Academia Brasileira de Ciências E-mail: [email protected]
METHODS
0 500,000 1,000,000 1,500,000 2,000,000 2,500,000 3,000,000
199 0
199 1
199 2
199 3
199 4
199 5
199 6
199 7
199 8
199 9
200 0
2001 200 2
Federal State Municipal Private
Fig. 1 – Growth of enrollments in higher education, 1990-2002. Sources: INEP. Evolução da Educação Superior - Graduação. Anos: 1980 /1998. Brasília: Ministério da Educação, Instituto Nacional de Estudos e Pesquisas Educacionais 2002; Sinopse Estatística do En-sino Superior - Graduação (1999, 2000, 2001, 2002). Brasília: Ministério da Educação, Instituto Nacional de Estudos e Pesquisas Educacionais. October 2003.
the courses on a five-point scale are available at the course level. The other source of information is the yearly National Household Sample Surveys of the Brazilian Institute for Geography and Statistics, known as PNAD (IBGE 2003). The sample, for 2002, included about 130,000 households, with in-formation about 385,000 persons, and is representa-tive of the whole Brazilian population, except for the residents in the rural areas of the Northern region. The information is available as micro data, at the level of households and individuals. In this article, we use information from these sources, whether al-ready tabulated by the providers, or processed with commercial statistical software.
RESULTS
Access and Equity
Contrary to widespread assumptions, expansion in the 1990’s did not lead to significant changes in the social composition of the Brazilian higher education
student body, as shown in Table I1. Tem-year dif-ferences are not larger than five percentage points, like in the proportion of students coming from the upper income group, and, notably, the proportion classified as ‘‘white’’. One reason for this stability is that, in spite of recent expansion, higher education in Brazil is still very limited: it reaches only 9.8% of the population in the 18-24 age group, as com-pared with much higher levels in many Latin Ameri-can, European and Asian countries. This is the ‘‘net rate’’ which compares the total number of students in higher education in the age group with the age cohort. The usual figure in international compar-isons is the ‘‘gross rate’’, which considers the total number of students regardless of age. For Brazil in
TABLE I
Social characteristics of higher education students, 1992 and 2002.
1992 2002
Women 53.7% 57.8%
Head of households 17.5% 15.8%
Wives or husbands 11.6% 13.2%
Sons 64.7% 63.6%
Other relative in the household 4.8% 6.2%
White 80.1% 75.9%
Mean age 25.2 25.8
Relative household income (*) 260.3 267.1
Percentage coming from the top 10% household income group 43.9% 41.4% Percentage coming from the lower 50% household income group 8.6% 7.5%
Total students 1,433,206 3,842,488
(*) for national average = 100. Source: IBGE 1993 and 2003.
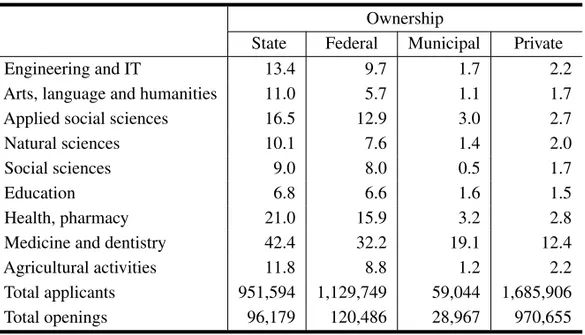
2002, including the students in post-graduate pro-grams, the rate was 16.6. The corresponding num-bers for some other countries in the year 2000 were Argentina, 47%; Chile, 34%; Korea, 66%; Portugal, 45%: Finland, 83% (Brunner and Elacqua 2003, ta-ble 7, p. 32). So, higher education grew by incorpo-rating persons from the same pool of candidates as before, instead of opening up to other social sectors. Historically, the main explanation for the lim-ited size of Brazilian higher education is the small number of students coming out of secondary educa-tion. This segment has been expanding very rapidly in the 1990s. Still, in 2002, only about 40% of the 15-17 age cohort was in secondary education, while another 38.5% were lagging behind in primary schools (Schwartzman 2003). Another explanation is that Brazil, differently from most other countries in Latin America, has establishednumerus clausus for enrollment in public higher education institu-tions, selecting students through entrance examina-tions. In some areas, like medicine and journalism, these exams are very competitive, with forty or more applicants per place. In 2001, there were 9.9 appli-cants per place in federal and 9.4 in state institutions, against 1.7 applicants per place in private
institu-tions. In state institutions, there were 59 applicants per place for medical schools, 33 for marketing, 28 for journalism, and 24 for law. In the private sector, there is significant competition only for medicine and dentistry (Table II). Otherwise, to be admitted, it is usually enough to have a secondary school de-gree and pay the fees. Finally, public expenditures per student in Brazil are the highest in Latin Amer-ica, at levels similar to that of European countries, because of the large number of full-time faculty en-joying civil-service benefits, and this placed another limitation in the expansion of the provision of public education.
TABLE II
Applicants per place for higher education institutions, 2001.
Ownership
State Federal Municipal Private
Engineering and IT 13.4 9.7 1.7 2.2
Arts, language and humanities 11.0 5.7 1.1 1.7
Applied social sciences 16.5 12.9 3.0 2.7
Natural sciences 10.1 7.6 1.4 2.0
Social sciences 9.0 8.0 0.5 1.7
Education 6.8 6.6 1.6 1.5
Health, pharmacy 21.0 15.9 3.2 2.8
Medicine and dentistry 42.4 32.2 19.1 12.4
Agricultural activities 11.8 8.8 1.2 2.2
Total applicants 951,594 1,129,749 59,044 1,685,906
Total openings 96,179 120,486 28,967 970,655
Source: Tabulated from the 2001 Higher Education Census, Ministério da Educação.
and free universities.
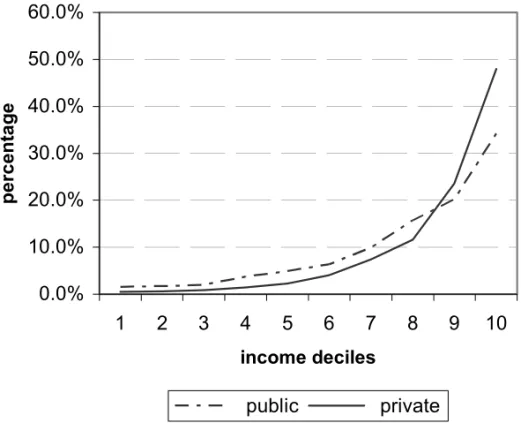
Information on private and public enrollments (available only since PNAD 2001), however, shows a more complex picture. In 2002, 48% of the stu-dents in private institutions belonged to the 10% richer segment of the population, with mean family income of 5,525reais2a month, while, in the public sector, only 34.2% of the students reached this level. At the other extreme, 13.7% of the students in the public sector came from families from the bottom half of the income ladder, as compared with 5.6% of those in private institutions (Figure 2). 75% of the students in the private sector defined themselves as ‘‘white’’ in the PNAD survey, as against 62% in the public one. The other main difference is that, in the public sector, 33% of the students do not work, com-pared with 21% in the private side. However, there is no age difference between the groups – a little above 26 on average for both. Overall, the social compo-sition of students in the public sector is slightly less skewed than that of the private sector, with a larger percentage of poorer and non-white students, and a smaller percentage of the richer ones. This
com-2The exchange rate in September 2002, when the survey was taken, was about 3 reais per US dollar.
bination of higher income and more work among students in private institutions, against less income and less work among those in the public sector, for populations of similar age, suggest important socio-logical differences these two groups of students, still to be explored.
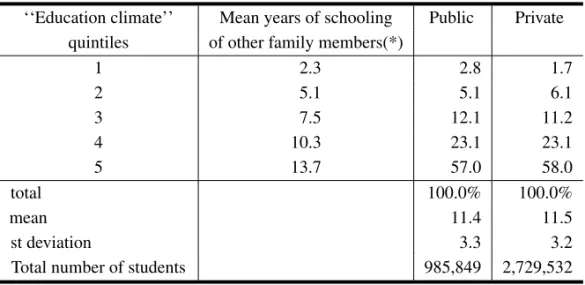
The higher quality of many course programs in the public sector, expressed both by their selec-tivity and their marks in the National Assessment of Courses (see below), suggest the hypothesis that, even if richer students are going to private educa-tion, students coming from the best educated fami-lies are still going to public institutions. To test this hypothesis, a measure of the student’s ‘‘cultural cap-ital’’ was developed, calculating the mean number of years of education of their family members with 18 years and more. However, Table III shows that, as a whole, the ‘‘cultural capital’’ of students in the public and private sectors is rigorously the same.
0.0%
10.0%
20.0%
30.0%
40.0%
50.0%
60.0%
1
2
3
4
5
6
7
8
9
10
income deciles
pe
rc
enta
g
e
public
private
Fig. 2 – Higher education students: public/private enrollment and family income, 2002. Source: IBGE 2003.
2010, forty percent of which in public institutions. This proportion was vetoed by President Fernando Henrique Cardoso in 2001, but under strong criti-cism from the opposition, which won the election in the following year (Presidência da República 2001). Several universities are experimenting with different types of quota systems and affirmative action. Thus, the state universities in Rio de Janeiro and Bahia have introduced quotas for non-whites and students coming from public secondary schools (Governo do Estado do Rio de Janeiro 2000, Universidade do Es-tado da Bahia 2002), and the Federal universities are being urged to expand enrollment and provide more evening courses. Racial quotas for higher education is a controversial policy (Fry 2000, Telles 2003), but affirmative action on behalf of students from poorer backgrounds is less so. A coherent policy of this kind, to be successful, would require special efforts to provide appropriate study programs to compen-sate for these students’ inadequate secondary edu-cation, and additional resources to implement them. So far, however, there are not examples of such
ef-forts, and a populist policy of expansion could re-duce the quality of the public sector and stimulate the growth of elite private higher education. In this sce-nario, public higher education would become more equitable, not by its virtues, but by its shortcomings.
Quality and Differentiation
Higher education in Brazil is very heterogeneous, both in the public and private sectors. The legis-lation distinguishes between universities, university centers, integrated, and isolated faculties of schools. They have different levels of autonomy, but the de-grees they provide are legally equivalent. The ex-pectation, written in the Constitution, is that all uni-versities should link research with teaching and ex-tension work, but this is the exception, rather than the rule, even among public universities.
mu-TABLE III
Enrollment in public and private higher education, by the family’s ‘‘education climate’’, 2002.
‘‘Education climate’’ Mean years of schooling Public Private quintiles of other family members(*)
1 2.3 2.8 1.7
2 5.1 5.1 6.1
3 7.5 12.1 11.2
4 10.3 23.1 23.1
5 13.7 57.0 58.0
total 100.0% 100.0%
mean 11.4 11.5
st deviation 3.3 3.2
Total number of students 985,849 2,729,532
(*) excludes students living alone. Source: IBGE 2003.
nicipal ones. The state universities of São Paulo provide most of Brazil’s doctoral degrees, and tend to be research intensive in many areas; in other state institutions, there are few or no advanced degree pro-grams, and very little research. In the private sector, there are several very large and many very small in-stitutions, teaching one or two evening courses in the social professions. Some of the largest private institutions are universities, but they lack signifi-cant graduate degree programs, and do very little research (Schwartzman and Schwartzman 2002).
The best information available on the quality of Brazilian higher education is the National As-sessment of Courses, a test required to all students graduating in most fields. This exam was estab-lished by the Ministry of Education under President Fernando Henrique Cardoso. Under President Luis Inácio da Silva, a Committee was established to re-vise the whole higher education quality assessment system in the country, and it suggested that the Na-tional Assessment of Courses should be abolished on its present form (Comissão Especial da Avali-ação da EducAvali-ação Superior 2003). At this writing (October 2003), the issue is still under discussion.
Individual scores in the National Exam are kept confidential, but the average results of each course
program are used to rank them along a scale from ‘‘A’’ to ‘‘E’’, according to their statistical distribu-tion within each field. In 2001, there were 12,155 course programs in Brazilian institutions; in 2002, 5,016 of them went through this procedure, in a se-lected number of fields. Together with this exam, the students are asked to respond to a socioeconomic questionnaire, which could be used to better under-stand their characteristics. This information, how-ever, is not in public domain.
With this instrument, it is not possible to com-pare the quality of different fields, since, by defini-tion, the mean score in each field is always ‘‘C’’. We can, however, calculate means and compare types of institutions and regions, converting the concepts of the ‘‘A’’ to ‘‘C’’ scale into a scale from 1 to 5 (Table IV).
TABLE IV
National Course Exam, mean scores of course programs, 2002.
Region Type of institution Total Number of
State Federal Municipal Private course programs
North 4.0 3.1 4.3 3.6 3.4 262
Northeast 3.4 2.7 3.9 3.4 3.2 882
Southeast 2.2 1.8 3.3 3.2 3.0 2,360
South 2.4 2.0 3.0 3.0 2.8 1,065
Center West 3.5 2.4 4.1 3.5 3.2 489
Total 3.0 2.4 3.5 3.2 3.0 5,058
Number of course programs 882 884 166 3,126 5,058
Source: tabulated from the National Course Exam data set, provided by the Ministério da Educação.
second it is 0.7. This observation is confirmed by analysis of variance (in both cases, between group differences are significant at .000 levels, with an ‘‘E-ta’’ coefficient of association of .263 for institutions, and .157 for regions).
Relevance
How important is education for society? The pre-vailing opinion among experts and laymen is that, the more education, the better. In economics, there is a vast literature demonstrating the importance of human capital for economic development and the re-duction of income inequality (Becker 1964, Schultz 1994), and a renewed concern for the need of ad-vanced competencies to face the knowledge require-ments of the new economy (Brunner and Elacqua 2003, De Ferranti et al. 2003). However, there is also a more skeptical view, particularly regarding the social benefits of uncontrolled expansion of higher education (Collins 1979, 2000, Schwartzman 2002a, Wolf 2002). In the past, it was believed that it would be possible to plan the growth of higher education according to a country’s needs, based on some tech-nical estimation of manpower requirements. More recently, this approach was abandoned, due to the rapid changes in the technology and the peculiar variations in the organization of the professions, and replaced by a more general concern with the devel-opment of broad competencies and skills (Fulton et
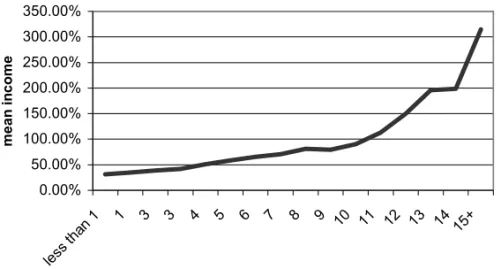
al. 1982, Serageldin and Li 1983, Stern et al. 2000). The individual, private benefits of higher ed-ucation are well documented. Figure 5 shows the distribution of monthly income according to years of education for persons between 25 and 40 years of age, in 2002. Incomes of persons with 15 years of more of schooling – that is, higher education – are about three times the income of those with 11 years of schooling – secondary education. Economists measure the ‘‘rates of return’’ of investments in edu-cation, and find that, in Latin America, the private re-turns of higher education are consistently very high (Leal and Werlang 1990, Psacharopoulos and Patri-nos 2002, Ueda and Hoffmann 2002). There are also attempts to measure the social benefits of education, but these results are more difficult to interpret and more subject to controversy.
0.0 10.0 20.0 30.0 40.0 50.0 60.0
State Federal Municipal Private
pe
rc
e
n
ta
ge
s
A B
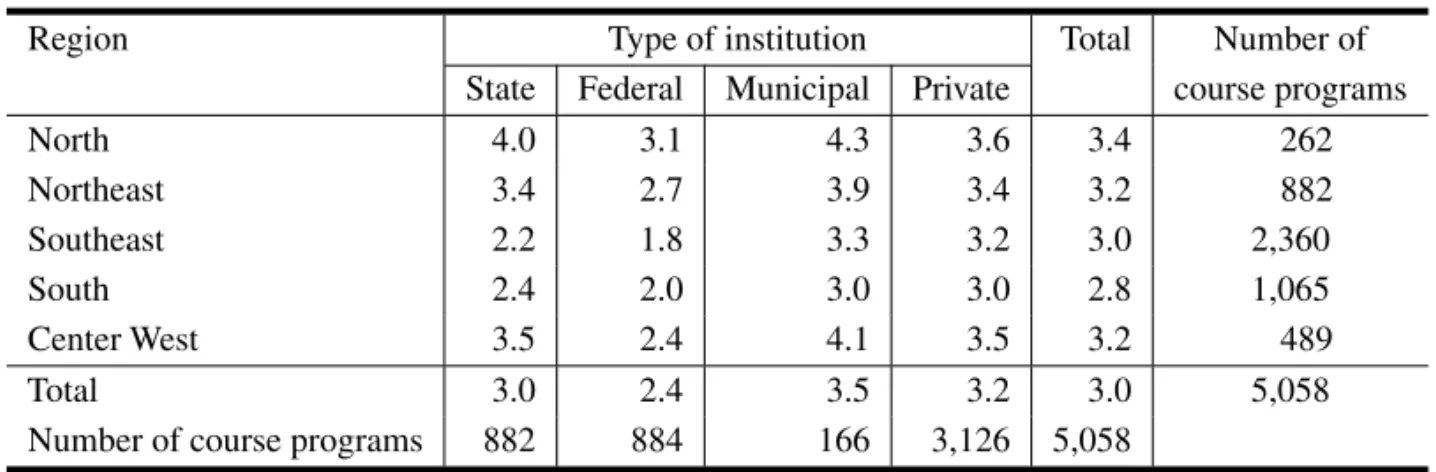
Fig. 3 – Percentage of A and B courses, by type of institution. Source: tabulated from the National Course Exam data set, provided by the Ministério da Educação.
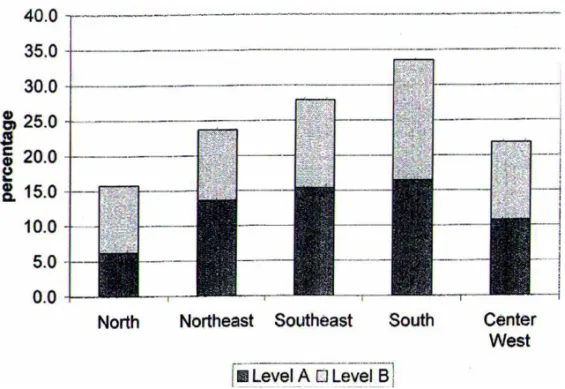
Fig. 4 – Percentage of A and B courses, by region. Source: tabulated from the National Course Exam data set, provided by the Ministério da Educação.
(including administration, economics, and similar subjects) where, except for law and accounting, the labor market is largely not organized along the es-tablished professions. The second largest group is
Ele-0.00% 50.00% 100.00% 150.00% 200.00% 250.00% 300.00% 350.00%
less tha
n 1 1 3 3 4 5 6 7 8 9 10 11 12 13 14 15+
years of schooling
mean
i
n
co
me
Fig. 5 – Mean income, by years of schooling (reais, October 2002). Source: IBGE 2003.
TABLE V
Enrollments in higher education by type of institution and field.
Percentages Total
Federal State Municipal Private Private Total for profit non-profit
Engineering, IT 20.8 15.4 16.7 15.9 18.9 17.8 478,247
Arts, language and humanities 4.8 3.4 1.5 1.4 1.2 2.2 59,163
applied social sciences, law 22.4 19.0 42.1 52.1 45.1 40.0 1,078,385
biological and physical sciences 7.8 4.3 0.9 1.6 1.9 3.2 85,020
social sciences 4.6 2.3 0.1 0.4 1.0 1.6 43,074
education 20.6 43.3 30.7 17.0 18.3 21.7 584,664
health and caring 6.7 4.9 4.1 7.7 8.5 7.4 198,543
medicine and dentistry 6.5 3.7 2.6 2.4 3.8 3.8 101,810
agriculture, natural products 5.8 3.8 1.4 1.4 1.2 2.4 65,339
100 100 100 100 100 100
Total 482,750 332,104 72,172 880,555 926,664 2,694,245
Source: tabulated from the 2000 higher education census, Ministério da Educação.
mentary and secondary education are the responsi-bility of states and municipalities, and this explains why most state and municipal institutions empha-size this field. Half the enrollment in the private sector, both in the for-profit and non-profit institu-tions (including the religious and community-based institutions), are in the applied social sciences. The pattern for federal universities is not very different, except that there is relatively more emphasis on
fields are more demanded by the labor market. The first two explanations are more likely to be true, and the question is whether the third is also valid.
Table VI helps to answer this question. Most jobs for persons with higher education are in services and the social professions (education, personal ser-vices, health care, administration, commerce). In the decade, the number of jobs for persons with higher education increased by 24%, reflecting the slow growth of higher education in the previous decade, and most of this increase also took place in the service and social professions. This could be interpreted as meaning that this is where the demand for higher education is stronger; however, the largest group, of ‘‘social activities and education’’, is also the segment with the lowest revenues. The proper interpretation, therefore, is that the job market is not creating well-qualified and well-paid job opportuni-ties, and the social professions are the main alter-native for the growing number of persons obtaining their higher education degrees.
Table VII makes use of a new classification of occupations introduced in the 2002 National House-hold Survey, and compares the occupation profiles of three generations of persons with higher educa-tion degrees. The differences may be a funceduca-tion of evolving career paths, related to seniority, and also to the changing work opportunities for each new gen-eration. Thus, about one fourth of the older genera-tion occupy top managerial posigenera-tions, and income is strongly related to age. In the younger generation, about 25% are in mid-level technical and adminis-trative positions, which may not require higher ed-ucation qualifications. It is possible that, on time, these persons would move to more qualified posi-tions; but, if the number of graduates increase, and the job market is not changing fast enough, the new generation may not have the chance to become like the old one. Almost half of the graduates work as professionals in sciences and arts, and this figures is stable among generations, suggesting that the ‘‘pro-letarization’’ of the educated, which is often pre-sented as a matter of fact, actually is not taking
happening. A better understanding of the current and future trends would require a much more de-tailed analysis of the effective contents of occupa-tions and professions and their change through time (like the work reported in Elias and Purcell 2003), which Brazil still lacks.
A society with better educated teachers, ad-ministrators, traders, health care and personal ser-vice providers should be a better place to live than a society without them. A country needs teachers to provide better education to children, and this is an important asset. At the same time, there is no evidence that the expansion of higher education in Brazil is having a direct impact on economic de-velopment. This is not surprising. On the short run, economic growth has more to do with macroe-conomic variables than with the availability of hu-man capital. (Sáinz and La Fuente 2001). On the long run, it seems clear that no sustained and well-balanced economic development can happen with-out an important pool of competent and well edu-cated professionals. However, there is a growing literature arguing that the expansion of higher edu-cation worldwide is more related to life styles and competition for scarce jobs than to functional re-quirements of the job markets (Wolf 2002). In the absence of demands for skills, continuous expansion of higher education may reinforce the tendency to make credentials more important than professional competence. This tendency can be costly to society, and thwart the ability of higher education institu-tions to develop the abilities and skills that could help to break the vicious circle of low economic de-velopment and the shortage well-qualified human capital.
Post-Graduate Education
TABLE VI
Occupations of persons with higher education, 1992-2001.
Occupations 1992 2001 change mean monthly
1992-2001 income, 2001(*)
Agriculture 2.0% 1.4% –0.6% 2,034.45
Industry 12.1% 9.2% –2.9% 2,525.28
Construction 2.2% 1.6% –0.6% 2,586.38
Other industrial activities 2.0% 1.3% –0.8% 2,326.33
Commerce 9.5% 11.2% 1.6% 1,812.59
Services to business 4.0% 6.1% 2.1% 1,380.19
Public administration 10.4% 14.2% 3.8% 2,369.89
Transportation and communications 2.6% 2.7% 0.2% 2,178.56
Social activities, education 33.8% 34.3% 0.5% 1,637.14
Public administration 13.1% 12.2% –0.9% 2,324.58
others 8.2% 5.8% –2.4% 2,266.40
Total econ. active 5,142,229 6,396,257 24% 1,989.96
(*) income from all kinds of work, reais of September 2001. Source: IBGE 1993 and 2002.
TABLE VII
Brazil, occupation of persons with higher education(*), by age groups, 2002.
Age groups Mean Number of
up to 35 36 to 50 more than 50 income(**) persons
Managers, executives 14.8 20.1 23.7 3,016.05 1,305,235
Professionals in sciences and arts 49.4 47.5 49.9 2,255.17 2,935,664
Middle-level technicians 13.8 13.0 10.9 1,621.45 974,950
Administrative workers 12.4 9.1 4.6 1,157.46 784,469
Service workers 1.8 2.4 2.0 1,206.55 195,646
Commerce 3.6 3.2 3.2 1,095.03 306,257
Agricultural activities 0.6 1.1 3.1 2,306.52 87,871
Manufacture and repairs 2.1 2.4 2.1 1,111.67 234,623
others, ill-defined 1.0 1.0 0.4 2,329.41 72,236
total 100% 100% 100%
mean income 1,568.59 2,284.93 2,822.01 2,108.88
number of persons 2,081,379 2,579,624 926,264
Post-graduate education is supported by the Ministry of Education, u the Ministry of Science and Technology and state institutions such as São Paulo’s Fundação de Amparo à Pequisa (FAPESP), under the assumption that this is the best way to form the high-level manpower needed to support Brazil’s science and technology. Thanks to this combined ef-fort, Brazil has the largest post-graduate education establishment in Latin America. In 2001, six thou-sand students received their doctoral degrees and 30 thousand their Masters’. This segment is heav-ily subsidized. Most courses are in public institu-tions, students do not have to pay tuition, and there are many opportunities for fellowships, particularly for doctoral students. According to one estimate, in 1999, public support for the post-graduate system consumed about 54% of the country’s public invest-ments in Research and Development (Ministério de Ciência e Tecnologia 1999, Balbachevsky 2004).
These figures refer only to degree programs, excluding the vast and unknown segment of non-degree programs, of which the new MBAs are a significant and growing portion. Follow-up stud-ies done on the professional careers of professional degree-holders show that most holders of master’s degrees work outside academia, such as in firms (mostly private), in public administration or as lib-eral professionals. Among Ph.D. holders, more than 60% work in academic institutions, either in public universities or in public research institutions. The proportion of academic employment is not signif-icantly diverse among doctors, whether in hard or soft sciences, or in fields professionally or academ-ically oriented. While 90% of all doctors in Physics and Biochemistry are in the academia, 86 per cent of those in Electrical Engineering hold faculty po-sitions or work at research institutes. While 60% of chemists and sociologists find employment in the academic marketplace, about three fourths of economists, civil and mechanical engineers, and psychologists, have the same kind of jobs (Velloso and Balbachevsky 2002, Balbachevsky 2004). The heavy concentration of doctor degree holders
in academic work is related to the fact that most scientific and technological research in Brazil takes place in universities, with less links with industry and public policy agencies than could be expected (Schwartzman 2002b).
The expansion of post-graduate education is having a clear impact on the growing number of degree holders in the staff of higher education insti-tutions, a legal requirement. Its impact in the econ-omy is less clear. For specialists in administration, engineering and in the medical profession, to have a master degree is a competitive advantage in the pro-fessional market. Ph.D. holders, on the other hand, may be too qualified for non-academic work, or may prefer to remain in the academic university. More information is needed to ascertain the effective im-pact of post-graduate education in the improvement of Brazil’s social and economic conditions. From what we know, however, the strong impression is that the private benefits of post-graduate education are much more tangible than the social ones.
DISCUSSION AND POLICY IMPLICATIONS
Higher education is expanding in Brazil as a con-sequence of the universal trend for young genera-tions to extend their student life, and the improved income opportunities for those with better educa-tion credentials. There are several assumpeduca-tions and common beliefs about this expansion which are not confirmed by the existing data and specialized liter-ature, and a revision of these assumptions can lead to significant changes in higher education policies.
ex-aminations to the public sector, and can only study in the evening. For these institutions, profits, not education, is the main concern. The main policy im-plications that follow from this view is that society should expand and subsidize higher education, but only in the public sector, where quality is preserved; and government should keep the private sector un-der close control and supervision, to minimize its shortcomings. On the long run, resources allowing, all higher education should be free and public, and organized along the Humdoldt ideals of integration among research, teaching and extension, as written in the Brazilian Constitution.
In our analysis, we find no evidence that the growth of higher education is a response to the de-mands of a changing labor market. Brazilian higher education doubled its size in the 1990’s, when the economy was largely stagnant. Perhaps because of the limitations of the available data, we do not see any clear trend in transforming the country’s grow-ing human capital (measured in years of schoolgrow-ing) into tangible social or economic benefits. Another finding is that the expansion of the last decade did not mean that the social basis of higher education is broadening.
Regarding the differences between the public and private sectors, we find that, although the pub-lic sector tends to have a higher proportion of good quality course programs, the similarities between the two sectors are large. Both have good and bad quality courses and institutions, and the social pro-file of the students are very similar, with a possible trend of the private sector to absorb more students from the upper income segments.
The main policy issues associated with this analysis are those of public subsidies, improvement of quality and competence, and equity. Higher ed-ucation, in all countries, is subsidized to a certain degree, and it is difficult to establish how far this public subsidy should go. In most countries outside Western Europe, which has a tradition of mostly public and fully subsidized higher education, stu-dents are asked to pay for their education, whether
in public or in private institutions. The distinction between ‘‘public’’ and ‘‘private’’ is less clear than it seems. In Brazil, public means ‘‘state-owned’’, while private includes for-profit, non-profit, charity, religious, community-based and other types of in-stitutions. In other countries, property may be less important than quality and education services pro-vided. The current situation in Brazil, where all public higher education is free, and all private educa-tion is fully charged to the students, is unwarranted in face of the similarities of the two systems, and should the adjusted, based on considerations of so-cial benefits and equity. Subsidies should go to the most deserving students and best study programs, regardless of their institutional location. Because of their long-term private benefits, students should be asked to share the costs of their higher education, with appropriate study loans for those who need it. Public expenditures in higher education should be balanced with the priority to improve public support to good quality basic education.
assess-ments, the dissociation between academic degrees and professional accreditation could go a long way in making higher education more flexible and plural-istic, while keeping standards in areas when it really matters.
Post-graduate education and university re-search are important assets, which should be sup-ported and improved. However, mass higher edu-cation systems require different institutions, some more oriented towards research and graduate edu-cation, others more oriented to teaching, or profes-sional education. The notion that all higher edu-cation institutions should do research, and that all post-graduate students should get free education and fellowships, leads to growing costs, unwarranted subsidies, and limited results. Research and ad-vanced post-graduate education should be supported according to strict criteria of quality and relevance, and this support needs to be substantial and sus-tained. Students doing post-graduate work in order to enhance their future career opportunities and rev-enues should be asked to share the costs of their education.
Any compensatory policy in higher education should be balanced with the observation that the most important problems of inequity are in basic ed-ucation, where a large proportion of students never complete their degrees, and remain functionally il-literate (OECD 2001, 2003). Once the student has a secondary degree, it is not difficult to enter higher education, although not necessarily in the field and institution of his choice. As secondary education expands, the demand for higher education will also increase, and it is necessary to develop policies to make sure that the best education does not remain re-stricted to students coming from high income, high education families and the richer regions, as it hap-pens predominantly today. Subsidies, loans, quotas, lax admission policies and regional redistribution of resources will not be sufficient achieve this objec-tive. To broaden the social basis, it is necessary to develop appropriate study programs for students coming from lower socioeconomic backgrounds,
in-cluding a significant expansion of shorter, vocation-ally oriented post-secondary education, which is still very limited in Brazil.
Proper policies for higher education should deal with the issues of equity, quality and relevance, and combine them with other considerations, related to changes in the regulatory framework, quality as-sessment, the reorganization of public institutions, and improved efficiency and efficacy in the use of public resources.
RESUMO
A educação superior brasileira duplicou de tamanho na década de 90, passando de 1.5 para mais de três mi-lhões de estudantes no período. Esta expansão ocorreu sobretudo pelo crescimento do setor privado, que, em 2002, respondia a 70% das matrículas. Será que esta ex-pansão está tornando a educação superior brasileira mais acessível a pessoas oriundas dos segmentos mais pobres da sociedade? Será que a qualidade da educação superior está caindo, por causa da velocidade desta expansão? Será que o Brasil está formando pessoas com as qualificações e em número adequado para permitir que o país participe da nova economia, globalizada e baseada no uso intensivo de conhecimentos? Que políticas devem ser implementadas, para maximizar os valores da equidade e da relevância so-cial? Este artigo examina a evidência disponível, e sugere algumas respostas para estas questões.
Palavras-chave: educação superior, capital humano, equidade, mercado de trabalho, política educacional.
REFERENCES
Balbachevsky E.Brazilian post-graduate education: emerging challenges to a successful policy. In: Schwartzman S and Brock C.(Ed.). The Chal-lenges of Education in Brazil. Oxford, UK: Triangle Journals, Ltd. (Oxford Studies in Comparative Edu-cation). 2004.
Becker GS.1964. Human Capital. NewYork: Columbia University Press.
CAPES.2003. Estatística da Pós-Graduação: Ministério da Educação, Coordenação de Aperfeiçoamento de Pessoal de Nível Superior.
Castro CDM and Levy DC.2000. Myth, reality, and reform: higher education policy in Latin America. Washington, DC: John Hopkins University Press for the IDB. 112 p.
Collins R.1979. The Credential Society. New York: Academic Press.
Collins R.2000. Comparative historical patterns of education. In: Hallinan M.(Ed.). Handbook of The Sociology of Education. New York: Kluwer Academic; Plenum Publishers, Comparative histori-cal patterns of education.
Comissão Especial da Avaliação da Educação Su-perior. 2003. Sistema Nacional de Avaliação da Educação Superior SINAES: Bases para uma nova proposta de avaliação da educação superior. Brasília: Ministério da Educação; Instituto Nacional de Estu-dos e Pesquisas Educacionais; Secretaria de Ensino Superior http://www.funadesp.org.br/downloads/ Nova Proposta.pdf
De Ferranti DM, Perry G, Gill IS, Guasch JL, Manoney WF, Sánchez-Páramo C and Schady N.2003. Closing the gap in education and technol-ogy. Washington, D.C.: World Bank. xii, 216 p. (World Bank Latin American and Caribbean studies).
Elias P and Purcell K.2003. Researching Graduate Careers Seven Years On. Research paper. Warwick, UK: A research project jointly funded by the Eco-nomic and Social Research Council and the Higher Education Careers Services Unit.
http://www2.warwick.ac.uk/fac/soc/ier/research/ glmf/researchpaper1.pdf.
Fry P.2002. Politics, nationality and the meanings of “race” in Brazil. Daedalus (Proceedings of the Amer-ican Academy of Arts and Sciences), 129(2): 83-118.
Fulton O, Gordon A and Williams G.1982. Higher education and manpower planning a comparative study of planned and market economies. Geneva: International Labour Office. 127 pp.
Governo do Estado do Rio de Janeiro. 2000. Lei n˚- 3524.
IBGE.1993. Pesquisa Nacional por Amostra de Domi-cílios (National Household Sample Survey) – PNAD
1992: Ministério do Planejamento, Orçamento e Gestão, Instituto Brasileiro de Geografia e Estatística.
IBGE.2002. Pesquisa Nacional por Amostra de Domi-cílios (National Household Sample Survey) – PNAD 2001: Ministério do Planejamento, Orçamento e Gestão, Instituto Brasileiro de Geografia e Estatística.
IBGE.2003. Pesquisa Nacional por Amostra de Domi-cílios (National Household Sample Survey) – PNAD 2002: Ministério do Planejamento, Orçamento e Gestão, Instituto Brasileiro de Geografia e Estatística.
INEP.2002. Censo do Ensino Superior: Ministério da Educação, Instituto Nacional de Estudos e Pesquisas Educacionais. November 2003.
http://www.inep.gov.br/superior/censosuperior/.
Leal CIS and Werlang SRDC.1990. Retornos em Educação no Brasil 1976-1986. Fundação Getúlio Vargas. Rio de Janeiro.
Ministério de Ciência e Tecnologia. 1999. Indi-cadores de ciência e tecnologia, esforços em ciência e tecnologia (C&T) e dispêndios em pesquisa e de-senvolvimento (P&D) – dados preliminares, 1999. 2003. http://www.mct.gov.br/estat/ascavpp/ portugues/2 Recursos Aplicados/ tabelas/tab2 5 1.htm.
OECD. 1999. Classifying educational programmes. Manual for ISCED-97 Implementation in OECD countries: Organization for Economic Cooperation and Development. http://www.staffs.ac.uk/ schools/graduate school/access/docs/ OECD-education-classifications.pdf.
OECD.2001. Knowledge and skills for life – first re-sults from PISA 2000 – Education and skills. Paris: OECD Programme for International Student Assess-ment.http://www.pisa.oecd.org/knowledge/ home/intro.htm.
OECD.2003. Knowledge and skills for life – further results from PISA 2000. Paris: OECD Programme for International Student Assessment.
http://www.pisa.oecd.org/literacy/download.htm.
Psacharopoulos G and Patrinos HA.2002. Returns to investment in education: a further update. World Bank Policy Research Working Paper. Washington, D.C.: The World Bank. 2881.
http://econ.world-bank.org/files/ 18081 wps2881.pdf.
Sáinz PG and La Fuente RM. 2001. Economic Growth, employment and income in Latin America a long term perspective. In: UNESCO-OREALC (Ed.). Analysis of Prospects of the Education in Latin America and the Caribbean. Santiago: Oficina Re-gional de Educación de la UNESCO para América Latina y el Caribe, Economic Growth, employment and income in Latin America a long term perspective, p. 88-108.
Schultz TP.1994. Human capital and economic de-velopment. Discussion paper: Yale University Eco-nomic Growth Center.
Schwartzman S.2002a. Higher education and the de-mands of the new economy in Latin America. Back-ground paper for the LAC Flagship Report. The World Bank. Washington, DC.
http://www.schwartzman.org.br/simon/flagship.pdf.
Schwartzman S.2002b. A pesquisa científica e o in-teresse público. Revista Brasileira de Inovação 1: 361-395. http://www.schwartzman.org.br/simon/ pesquisa cientifica interesse publico.pdf.
Schwartzman S.2003. The Challenges of Education in Brazil. Oxford: Oxford University, Centre for Brazilian Studies. http://www.brazil.ox.ac.uk/ Schwartzman38.pdf.
Schwartzman J and Schwartzman S.2002. O en-sino superior privado como setor econômico. Ensaio – Avaliação e Políticas Públicas em Educação v.10, n.37, out-dez, p. 411-440.
http://www.schwartzman.org.br/simon/suppriv.pdf.
Serageldin I and Li B.1983. Tools for manpower planning the World Bank models. World Bank staff working papers. TW Bank. Washington, DC: World Bank.
Stern S, Porter ME and Furman JL.2000. The deter-minants of national innovative capacity. Washington: National Bureau of Economic Research (Working Pa-per Series).
Telles EE.2003. Racismo à brasileira. Rio de Janeiro: Relume Dumará.
Ueda EM and Hoffmann R.2002. Estimando o retorno da educação no Brasil. Economia Aplicada 6: 209-238.
Universidade do Estado da Bahia.2002. Resolução 196/202. Salvador, BA. http://www.uneb.br/ consu consepe/Res.consu.quotas%20 para%20afro-descendentes.pdf.
Velloso J and Balbachevsky E.2002. Graduate Train-ing and employment in Brazil. International Higher Education 29: 19-20.