Communication
[Comunicação]
Influence of parity on concentrations of enzymes, proteins, and minerals
in the milk of cows
[Influência do número de parições nas concentrações de enzimas, proteínas e minerais no leite de vacas]
T.G. Rocha1, C. Franciosi1,R.P. Nociti2, P.C. Silva3, A.A.M. Sampaio3, J.J. Fagliari3*
1
Aluna de pós-graduação – Faculdade de Ciências Agrárias e Veterinárias UNESP Jaboticabal, SP
2
Médico veterinário autônomo
3
Faculdade de Ciências Agrárias e Veterinárias UNESP Jaboticabal, SP
The composition and physical properties of colostrum vary according to a number of factors such as the age of the animal, number of lactation cycles, breed, diet, vaccination, and diseases (Kume and Tanabe, 1993; Tsioulpas et al., 2007). For instance, it is well established that first lactation heifers produce significantly less colostrum than multiparous cows and that the quality of this colostrum is usually poor (Petrie et al., 1984). Also, dairy cows have more developed mammary glands that often produce a much higher amount of colostrum when compared to beef cows. Colostrum is also the main source of minerals for newborn calves. The concentrations of minerals such as calcium, phosphorus, and magnesium in bovine colostrum are higher at calving and decrease with time (Kume and Tanabe, 1993).
The aim of this study was to evaluate the influence of parity on some parameters of colostrum and milk whey of beef cows in the first 30 days of lactation.
The lacteal secretions of 35 Canchim cows were analyzed. Five groups comprising seven cows each were formed to evaluate whether the number of lactations influenced the content of proteins and the biochemical parameters of colostrum and milk whey. The groups consisted of: seven first lactation cows (Group 1), seven second lactation cows (Group 2), three third and four fourth lactation cows (Group 3), seven fifth
Recebido em 30 de abril de 2012
Aceito em 20 de agosto de 2013
*Autor para correspondência (corresponding author) E-mail: fagliari@fcav.unesp.br
lactation cows (Group 4) and seven sixth lactation cows (Group 5). Third and fourth lactation cows were included together in Group 3 because of the small number of animals available for the experiment. The samples of colostrum and milk were taken immediately after calving (day 0) and 1, 2, 7, 15 and 30 days thereafter. All cows were managed under similar conditions prior to and during sample collection. None of the animals used in this study exhibited any health problems during the experimental period. The experimental design was approved by the Ethics Committee on Animal Use at the School of Veterinary Medicine, UNESP at Jaboticabal, under protocol number 009793-08.
Analyzer, Roche Diagnostics, Mannheim, Germany). Whenever necessary, the samples were diluted in deionized water as follows: gamma-glutamyltransferase: 1:150 (day 0), 1:50 (day 1), 1:20 (days 2 to 30); total protein: 1:3 (day 0; no further dilutions in the subsequent time points); calcium, phosphorus, and magnesium: 1:5 (days 0 to 30); ionized calcium: 1:3 (days 0 to 30).
Electrophoretic protein separation was carried out in polyacrylamide gels using the technique described by Laemmli (1970).
The data were submitted to ANOVA and the differences among groups were analyzed with the Tukey’s test. Differences were considered significant at P<0.05 (Zar, 1999).
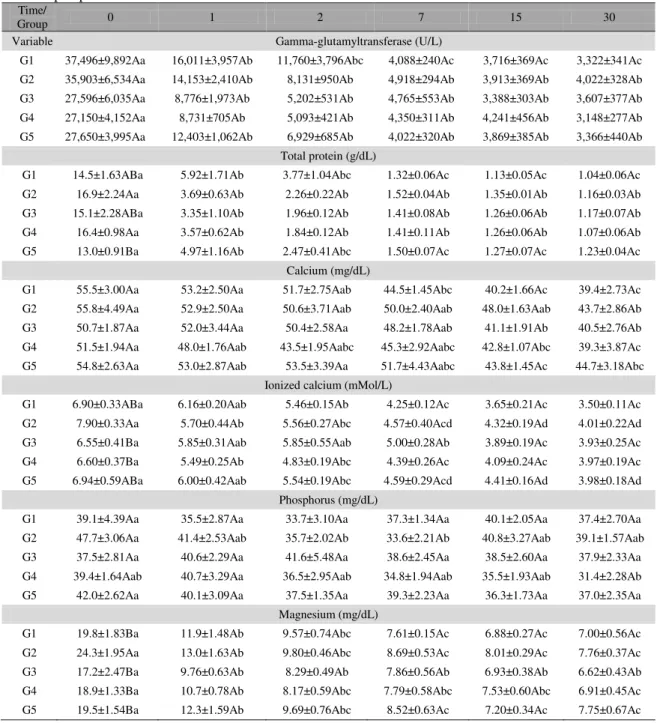
Even though gamma-glutamyltransferase (GGT) activity levels did not differ between groups, they were higher in colostrum whey of group 1 as compared to group 3 or later lactation cows (Table 1), which is probably due to concentration of this enzyme in a lower volume of colostrum. There was a decrease in GGT activities during the transition from colostrum to mature milk. Zanker et al. (2001) reported a GGT activity of 30,479 IU/L in colostrum whey of primiparous cows two hours after calving and, according to these authors, the activity of this enzyme is very high in colostrum soon after calving and gradually decreases as days go by.
Total protein concentrations were significantly higher in colostral whey of groups 2 and 4 and lower in group 5 (Table 1). Zarcula et al. (2010) reported that breed and parity influenced the chemical composition of first colostrum, and that protein content of whole colostrum was higher in cows from second and third lactation compared to those in fourth lactation, differing from the results of the present study.
Calcium concentrations in whey did not differ between groups and gradually decreased until the thirtieth day of lactation (Table 1). Contrary to the results of this study, Kume and Tanabe (1993) reported a higher concentration of calcium in colostrum of primiparous Holstein cows as compared to multiparous cows of the same breed. Ionized calcium concentration was
significantly higher in group 2 and lower in groups 3 and 4 (Table 1). Like total calcium levels, ionized calcium concentrations also gradually decreased until 30 days postpartum. In the present study, ionized calcium levels were higher than those reported by Tsioulpas et al. (2007).
The inorganic phosphorus content levels of colostrum whey did not differ between groups (Table 1). According to Kume and Tanabe (1993), inorganic phosphorus concentrations are higher in colostrum of primiparous Holstein cows as compared to multiparous cows and remain constant after the third lactation. These results differ from the findings of the present study most likely because colostrum whey instead of whole colostrum was analyzed.
The concentrations of calcium and inorganic phosphorus in cow colostrum described in literature are 3-4 times higher than those found in the present study (Tsioulpas et al., 2007). These differences are probably a consequence of the fact that casein binds calcium and inorganic phosphorus and is separated from whey by addition of rennet and centrifugation, which significantly reduces the amount of these two minerals in colostrum whey as compared to whole colostrum.
In addition, Klimes et al. (1986) failed to find a correlation between calcium and phosphorus content and protein concentration in bovine colostrum whey; this is in contrast with the results reported by Gaucheron (2005), who found a significant positive correlation between these parameters in whole milk. These findings lead to the conclusion that the correlation between calcium and inorganic phosphorus and protein fraction of colostrum and milk is due to the interactions between these minerals and casein.
Table 1. Mean ± standard error (SE) of biochemical parameters of colostral and milk whey of beef cows at first (G1), second (G2), third+fourth (G3), fifth (G4), and sixth (G5) lactations on days 0, 1, 2, 7, 15, and 30 postpartum
Time/
Group 0 1 2 7 15 30
Variable Gamma-glutamyltransferase (U/L)
G1 37,496±9,892Aa 16,011±3,957Ab 11,760±3,796Abc 4,088±240Ac 3,716±369Ac 3,322±341Ac
G2 35,903±6,534Aa 14,153±2,410Ab 8,131±950Ab 4,918±294Ab 3,913±369Ab 4,022±328Ab
G3 27,596±6,035Aa 8,776±1,973Ab 5,202±531Ab 4,765±553Ab 3,388±303Ab 3,607±377Ab
G4 27,150±4,152Aa 8,731±705Ab 5,093±421Ab 4,350±311Ab 4,241±456Ab 3,148±277Ab
G5 27,650±3,995Aa 12,403±1,062Ab 6,929±685Ab 4,022±320Ab 3,869±385Ab 3,366±440Ab
Total protein (g/dL)
G1 14.5±1.63ABa 5.92±1.71Ab 3.77±1.04Abc 1.32±0.06Ac 1.13±0.05Ac 1.04±0.06Ac
G2 16.9±2.24Aa 3.69±0.63Ab 2.26±0.22Ab 1.52±0.04Ab 1.35±0.01Ab 1.16±0.03Ab
G3 15.1±2.28ABa 3.35±1.10Ab 1.96±0.12Ab 1.41±0.08Ab 1.26±0.06Ab 1.17±0.07Ab
G4 16.4±0.98Aa 3.57±0.62Ab 1.84±0.12Ab 1.41±0.11Ab 1.26±0.06Ab 1.07±0.06Ab
G5 13.0±0.91Ba 4.97±1.16Ab 2.47±0.41Abc 1.50±0.07Ac 1.27±0.07Ac 1.23±0.04Ac
Calcium (mg/dL)
G1 55.5±3.00Aa 53.2±2.50Aa 51.7±2.75Aab 44.5±1.45Abc 40.2±1.66Ac 39.4±2.73Ac
G2 55.8±4.49Aa 52.9±2.50Aa 50.6±3.71Aab 50.0±2.40Aab 48.0±1.63Aab 43.7±2.86Ab
G3 50.7±1.87Aa 52.0±3.44Aa 50.4±2.58Aa 48.2±1.78Aab 41.1±1.91Ab 40.5±2.76Ab
G4 51.5±1.94Aa 48.0±1.76Aab 43.5±1.95Aabc 45.3±2.92Aabc 42.8±1.07Abc 39.3±3.87Ac
G5 54.8±2.63Aa 53.0±2.87Aab 53.5±3.39Aa 51.7±4.43Aabc 43.8±1.45Ac 44.7±3.18Abc
Ionized calcium (mMol/L)
G1 6.90±0.33ABa 6.16±0.20Aab 5.46±0.15Ab 4.25±0.12Ac 3.65±0.21Ac 3.50±0.11Ac
G2 7.90±0.33Aa 5.70±0.44Ab 5.56±0.27Abc 4.57±0.40Acd 4.32±0.19Ad 4.01±0.22Ad
G3 6.55±0.41Ba 5.85±0.31Aab 5.85±0.55Aab 5.00±0.28Ab 3.89±0.19Ac 3.93±0.25Ac
G4 6.60±0.37Ba 5.49±0.25Ab 4.83±0.19Abc 4.39±0.26Ac 4.09±0.24Ac 3.97±0.19Ac
G5 6.94±0.59ABa 6.00±0.42Aab 5.54±0.19Abc 4.59±0.29Acd 4.41±0.16Ad 3.98±0.18Ad
Phosphorus (mg/dL)
G1 39.1±4.39Aa 35.5±2.87Aa 33.7±3.10Aa 37.3±1.34Aa 40.1±2.05Aa 37.4±2.70Aa
G2 47.7±3.06Aa 41.4±2.53Aab 35.7±2.02Ab 33.6±2.21Ab 40.8±3.27Aab 39.1±1.57Aab
G3 37.5±2.81Aa 40.6±2.29Aa 41.6±5.48Aa 38.6±2.45Aa 38.5±2.60Aa 37.9±2.33Aa
G4 39.4±1.64Aab 40.7±3.29Aa 36.5±2.95Aab 34.8±1.94Aab 35.5±1.93Aab 31.4±2.28Ab
G5 42.0±2.62Aa 40.1±3.09Aa 37.5±1.35Aa 39.3±2.23Aa 36.3±1.73Aa 37.0±2.35Aa
Magnesium (mg/dL)
G1 19.8±1.83Ba 11.9±1.48Ab 9.57±0.74Abc 7.61±0.15Ac 6.88±0.27Ac 7.00±0.56Ac
G2 24.3±1.95Aa 13.0±1.63Ab 9.80±0.46Abc 8.69±0.53Ac 8.01±0.29Ac 7.76±0.37Ac
G3 17.2±2.47Ba 9.76±0.63Ab 8.29±0.49Ab 7.86±0.56Ab 6.93±0.38Ab 6.62±0.43Ab
G4 18.9±1.33Ba 10.7±0.78Ab 8.17±0.59Abc 7.79±0.58Abc 7.53±0.60Abc 6.91±0.45Ac
G5 19.5±1.54Ba 12.3±1.59Ab 9.69±0.76Abc 8.52±0.63Ac 7.20±0.34Ac 7.75±0.67Ac Means followed by different capital letters in the same column and lower case letters in the same row differ by
Tukey’s test (P<0.05).
As in the study of Klimes et al. (1986), the levels of constituents such as calcium, magnesium, and inorganic phosphorus were much higher at the first milking postpartum. Kume and Tanabe (1993) reported that the colostrum concentrations of calcium, phosphorus, and magnesium were
Interestingly, immunoglobulin A (IgA) levels in colostrum whey of group 1 were higher as compared to group 2 (Table 2). The highest concentration of this protein was observed on the day of calving and decreased after the onset of
lactation in all groups. Muller and Ellinger (1981) reported that first calf heifers produced a lower level of colostral IgA than third or later lactation cows; these findings differ from the results of the present study.
Table 2.Mean±standard error (SE) of proteinogram of colostral and milk whey in beef cows of first (G1), second (G2), third+fourth (G3), fifth (G4), and sixth (G5) lactations on days 0, 1, 2, 7, 15, and 30 postpartum
Time/
Group 0 1 2 7 15 30
Variable Gamma-glutamyltransferase (U/L)
G1 765±175Aa 144±54.6Ab 242±96.6Ab 9.48±2.30Ab 8.03±3.40Ab 1.55±1.02Ab
G2 465±89.1Ba 205±68.1Aab 81.1±24.3Ab 11.0±1.24Ab 5.96±1.64Ab 4.87±3.04Ab
G3 563±188ABa 213±148Ab 41.3±11.4Ab 7.90±3.06Ab 4.35±1.41Ab 3.62±1.48Ab
G4 661±105ABa 182±51.2Ab 40.1±11.5Ab 7.94±4.56Ab 9.16±4.86Ab 4.56±3.04Ab
G5 546±91.1ABa 235±46.6Ab 104±36.5Ab 7.37±2.16Ab 6.72±3.03Ab 3.59±1.18Ab
Lactoferrin (mg/dL)
G1 414±72.7Ba 153±51.9Ab 88.5±41.2Ab 17.8±4.00Ab 13.1±4.68Ab 21.9±7.44Ab
G2 731±150Aa 102±28.6Ab 48.5±11.3Ab 40.5±12.3Ab 40.7±14.3Ab 14.9±3.24Ab
G3 559±153ABa 73.1±41.9Ab 29.8±7.05Ab 21.8±7.71Ab 15.1±2.50Ab 14.3±2.24Ab
G4 621±122ABa 67.1±12.3Ab 26.7±4.46Ab 62.9±51.5Ab 13.4±6.73Ab 17.0±4.31Ab
G5 470±83.4Ba 151±60.7Ab 45.4±11.0Ab 27.2±8.55Ab 20.3±6.71Ab 12.9±2.99Ab
Heavy chain immunoglobulin G (mg/dL)
G1 4,057±813Aa 763±245Ab 1,033±378Ab 21.7±6.29Ab 11.1±6.47Ab 10.5±5.63Ab
G2 3,597±609Aa 1,094±304Ab 494±111Ab 103±15.4Ab 65.5±9.13Ab 27.7±5.35Ab
G3 3,506±573Aa 759±391Ab 228±49.0Ab 65.3±25.1Ab 31.4±13.0Ab 21.5±6.45Ab
G4 3,953±629Aa 981±289Ab 220±54.4Ab 64.5±31.5Ab 43.4±18.3Ab 19.6±8.87Ab
G5 3,343±381Aa 1,312±341Ab 541±207Abc 72.0±20.1Ac 36.9±9.95Ac 19.9±5.28Ac
Light chain immunoglobulin G (mg/dL)
G1 4,276±631Aa 1,151±402Ab 645±253Ab 28.2±6.08Ab 12.0±6.01Ab 17.5±10.1Ab
G2 4,477±916Aa 601±158Ab 242±58.8Ab 38.3±5.37Ab 23.1±4.98Ab 7.16±4.01Ab
G3 4,464±856Aa 539±326Ab 129±25.9Ab 27.9±9.23Ab 10.5±6.09Ab 11.4±4.77Ab
G4 4,782±362Aa 578±168Ab 128±28.7Ab 29.6±14.9Ab 17.0±11.1Ab 8.66±4.82Ab
G5 3,767±337Aa 1,124±418Ab 294±113Ab 37.3±7.98Ab 18.1±3.90Ab 3.53±3.53Ab β-Lactoglobulin (mg/dL)
G1 4,080±843Ba 3,134±1,268Aa 1,326±229Ab 973±55.7Ab 847±46.8Ab 720±81.9Ab
G2 5,788±1,048Aa 1,224±136Bb 1,030±53.1Ab 1,061±49.3Ab 959±32.8Ab 873±35.8Ab
G3 4,967±1,056AB
a 1,342±159Bb 1,217±65.6Ab 1,048±43.7Ab 958±37.3Ab 891±48.1Ab G4 5,144±478ABa 1,334±121Bb 1,092±64.9Ab 986±38.7Ab 943±28.5Ab 824±42.3Ab
G5 3,847±429Ba 1,578±267ABb 1,107±54.2Ab 1,069±61.8Ab 915±56.7Ab 929±55.7Ab α-Lactalbumin (mg/dL)
G1 241±78.2Bab 336±41.7Aa 268±32.9Aab 198±27,3Aab 193±28.1Aab 156±28.6Ab
G2 582±156Aa 232±35.4Ab 259±17.6Ab 200±14.2Ab 181±18.1Ab 162±12.3Ab
G3 354±88.1Ba 297±28.6Aab 251±39.4Aab 187±24.7Aab 188±19.5Aab 174±14.4Ab
G4 418±83.3ABa 273±22.9Aab 261±13.5Aab 196±17.4Ab 182±8.05Ab 151±6.33Ab
G5 346±66.4Ba 280±13.2Aa 276±29.5Aa 227±21.5Aa 204±20.5Aa 212±18.9Aa
Means followed by different capital letters in the same column and lower case letters in the same row differ by Tukey’s test
Lactoferrin concentrations in whey from both colostrum and milk were lower in groups 1 and 5 and higher in group 2 (Table 2). The concentrations of this protein also decreased after the onset of lactation in all groups. Tsuji et al. (1990) found no significant differences regarding lactoferrin levels between colostrum of primiparous and multiparous beef cows, which differ from the results of the present. In dairy cows, however, these authors observed a lower lactoferrin content in colostrum of first lactation cows as compared to multiparous cows, which is in agreement with the results of the present study. These authors also reported the presence of significantly higher lactoferrin content in the colostrum produced by dairy cows than in that produced by beef cows.
Heavy chain immunoglobulin G (IgG) concentrations did not differ between groups; they were higher on the day of calving and decreased after the onset of lactation (Table 2). Light chain IgG concentrations exhibited the same trend during the experimental period. Sant’ana (2004) reported intermediate immunoglobulin concentrations in first lactation heifers, lower values in second and third lactation cows, and higher values in fourth or later lactation cows.
Colostral beta-lactoglobulin (β-LG) concentrations were lower in group 1 and 5 and higher in group 2 (Table 2). There was also a difference between groups on the first day after calving, when the
highest concentration of this protein was observed in group 1. Differently from the present study, Sant’ana (2004) observed a higher concentration of β-LG in colostrum whey of primiparous cows compared with cows in the fourth or later lactations.
Alpha-lactalbumin (α-LA) concentration in colostrum whey was higher in group 2 and lower in groups 1, 3, and 5 (Table 2). A small decrease in the concentration of this protein was observed in the first thirty days of lactation. Sant’ana (2004) observed the highest concentrations of α-lactalbumin in primiparous cows, which is in contrast with the findings of the present study.
The number of cows used in this study was small and it is likely that grouping these animals as primiparous versus multiparous would have yielded different results; therefore, further research with larger numbers of cows are warranted.
The concentrations of GGT , immunoglobulin G (both heavy and light chains), calcium, and phosphorus were not influenced by parity in Canchim cows. Concentrations of total protein, lactoferrin, β-lactoglobulin, α-lactalbumin, ionized calcium, and magnesium were higher in multiparous cows, whilst immunoglobulin A concentration was higher in primiparous cows.
Keywords: beef cows, biochemistry, parity, colostrum, milk
RESUMO
Avaliou-se a influência do número de parições nos valores de alguns parâmetros bioquímicos e do perfil eletroforético do soro lácteo de vacas de corte. Trinta e cinco vacas da raça Canchim foram alocadas em cinco grupos: vacas de primeira lactação, segunda lactação, terceira e quarta lactações, quinta lactação e sexta lactação. As amostras de secreção láctea foram coletadas imediatamente após (dia 0) e 1, 2, 7, 15 e 30 dias após o parto. As concentrações de gamaglutamiltranferase (GGT), proteína total, cálcio, fósforo, magnésio e cálcio ionizado foram avaliadas. A separação eletroforética das proteínas foi realizada em matriz de gel de poliacrilamida (SDS-PAGE). A atividade de GGT e as concentrações de imunoglobulina G, cálcio e fósforo não foram influenciadas pelo número de parições. As concentrações de proteína total, cálcio ionizado, magnésio imunoglobulina A, lactoferrina, β-lactoglobulina e α -lactoalbumina, foram influenciadas pelo número de partos das vacas. À exceção dos teores de fósforo e
α-lactoalbumina em poucos grupos, a concentração das demais características decresceu no decorrer do período de lactação.
ACKNOWLEDGEMENTS
The authors thank Fundação de Amparo à Pesquisa do Estado de São Paulo (FAPESP) for the financial support and scholarships.
REFERENCES
GAUCHERON, F. The minerals of milk. Reprod. Nutr. Dev., v.45, p.473-483, 2005.
KLIMES, J.; JAGOS, P.; HOUDA, J. et al. Basic qualitative parameters of cow colostrum and their dependence on season and postpartum time. Acta Vet. Brno, v.55, p.23-29, 1986.
KUME, S.; TANABE, S. Effect of parity on colostral mineral concentrations of Holstein cows and value of colostrum as a mineral source for newborn calves. J. Dairy Sci., v.76, p.1654-1660, 1993.
LAEMMLI, U.K. Cleavage of structural proteins during the assembly of the head of bacteriophage T4. Nature, v.227, p.680-685, 1970.
MULLER, L.D.; ELLINGER, D.K. Colostral immunoglobulin concentrations among breeds of dairy cattle. J. Dairy Sci., v.64, p.1727-1730, 1981.
PETRIE, L.; ACRES, S.D.; McCARTNEY, D.H. The yield of colostrum and colostral gammaglobulins in beef cows and the absorption of colostral gammaglobulins by beef calves. Can. Vet. J., v.25, p.273-279, 1984.
SANT’ANA, V.A.C. Proteinograma do leite de vacas: padrões e variabilidade. 2004. 161f. Tese (Doutorado em Medicina Veterinária) – Universidade de São Paulo, São Paulo, 2004.
TSIOULPAS, A.; GRANDISON, A.S.; LEWIS, M.J. Changes in physical properties of bovine milk from the colostrum period to early lactation. J. Dairy Sci., v.90, p.5012-5017, 2007.
TSUJI, S.; HIRATA, Y.; MUKAI, F. et al. Comparison of lactoferrin content in colostrum between different cattle breeds. J. Dairy Sci., v.73, p.125-128, 1990.
ZANKER, I.A.; HAMMON, H.M.; BLUM, J.W. Activities of γ-glutamyltransferase, alkaline phosphatase and aspartate-aminotransferase in colostrum, milk and blood plasma of calves fed first colostrum at 0-2, 6-7, 12-13 and 24-25 h after birth. J. Vet. Med. A, v.48, p.179-185, 2001.
ZAR, J.H. Biostatistical analysis. 4.ed. New Jersey: Prentice Hall, 1999. 663p.