Vol.56, n.3: pp. 439-446, May-June 2013
ISSN 1516-8913 Printed in Brazil BRAZILIAN ARCHIVES OF
BIOLOGY AND TECHNOLOGY
A N I N T E R N A T I O N A L J O U R N A L
Multivariate Analysis of the Spectroscopic Profile of the
Sugar Fraction of Apple Pomace
Luciana Sutil Gabriel
1, Rosilene Aparecida Prestes
2*, Luís Antonio Pinheiro
1, Andersson
Barison
3and Gilvan Wosiacki
11Universidade Estadual de Ponta Grossa; Av.Carlos Cavalcanti, 4748; 84030-900; Ponta Grossa – PR – Brasil.
2Universidade Tecnológica Federal do Paraná; Campus de Ponta Grossa; Av. Monteiro Lobato, s/n - Km 04;
84016-210, Ponta Grossa - PR - Brasil. 3Universidade Federal do Paraná; 81531-990; Curitiba - PR - Brasil
ABSTRACT
Pomace, the main by-product of apple juice processing, contains all the fruit’s compounds such as minerals, sugars, fibers, enzymes and secondary metabolites after bioprocessing. Dried pomace from four apple varieties (Gala, Fuji, Catarina and Joaquina) was used to extract fructose, glucose, and sucrose, the main soluble sugars contained in apple pomace, to verify the possible use of the sugar fractions. The concentrated sugars were characterized by NMR and FTIR. The partial least squares method (PLS) applied to the NMR and FTIR spectra revealed large amounts of fructose, glucose, and sucrose, without the presence of others compounds. Principal component analysis (PCA) discriminated the studied apple varieties, with a 99% level of significance, as function of the amount of each sugar in the respective extracts.
Key words: Apple pomace, NMR, FTIR, multivariate analysis
*Author for correspondence: [email protected]
INTRODUCTION
The main components of apple pomace are water, sugars and malic acid, which give apple products their predominantly sweet and sour flavors. Trace amounts of phenolic compounds suffice to give apple-derived products their distinctive sourness and astringency, which usually enhance their flavor, such as that of cider (Downing 1989; Devrajan et al. 2004). Apple pomace represents 20 to 40% of the raw material and it is the by-product of apple juice processing. Pomace usually contains 80% of moisture, a high level of sugar and a low pH (3-4), which explains its chemical and biological instability and the environmental impact it causes when discarded without prior treatment (Wang et al. 2007). Due to its composition, several uses have been proposed for pomace, including
bioprocessing for ethanol production, physical processing for fiber extraction, and aroma extraction. The sugar content, which may represent 30 to 40% of dried pomace, may be extracted and characterized according to its simple sugars: fructose, glucose and sucrose, which, converted into inverted sugar, has high sweetening value and a low glycemic index. The functional appeal of the sweetener would be its fructose-rich fraction.
Association of Official Analytical Chemists (AOAC), is by polarimetry of sucrose. However, this method is fairly restricted due to the interference caused by the optical activity of many other substances that are potentially present (Meade, Chen 1977).
Most of the classical methods of sugar quantification are based on the Fehling reaction in alkaline media. Some authors also use the reaction with phenol in a strongly acid medium to produce chromogenic compounds for spectrophotometric monitoring. These methods involve titrimetry (EDTA, Lane-Enyon, Luff-Schoorl), gravimetry
(Musson-Walker), and spectrophotometry
(Carbazole, DNS, Antron sulfuric acid, phenol-sulfuric acid, Somogyi-Nelson). Among the physical methods, the one most commonly used for the analysis is refractometry (Brix scale) due to its ability to quantify the amount of total soluble solids indiscriminately in a sample (Neto, 2006). Chromatographic methods are used to identify and quantify the compounds after the hydrolysis. Sugars, organic acids and phenolic compounds can also be analyzed nondestructively by the Nuclear Magnetic Resonance (NMR) spectroscopy. In fact, this type of instrumental analysis has become increasingly popular due to its high selectivity and its ability to simultaneously detect numerous chemical compounds in a single spectrum. NMR spectroscopy coupled with principal component analysis (PCA) has been used to identify the origin of wines (Košir and Kidriˇ 2002), discriminate different kinds of beer (Duarte et al. 2002), determine the amount of fatty acids in the whole seeds (Prestes et al. 2007), detect adulteration in olive oil (Šmejkalová and Piccolo 2010), determine vegetable quality standards (Hills and Clark 2003), infer plant disease levels (Prestes et al. 2009), determine the total soluble solids in the fruits (Keener et al. 1997), and to study food (Košir and Kidri 2002) and fruit juice (Eads and
Bryant 1986) compositions in general.
Additionally, it is a very interesting tool for comparing the natural and synthetic samples. Recent studies have used NMR coupled with chemometric techniques to characterize and classify the products according to their origin, quality or variety (Fragaki et al. 2005).
Today, near-infrared and mid-infrared
spectroscopy (NIRS and MIRS, respectively) are widely employed in the quantitative and qualitative analyses of the fruits. NIRS has been used to evaluate the quality of apples in terms of
fiNMRess, soluble solids content (Peirs et al. 2001), and variety (Leemans et al. 2003), and to detect the bruising (Xing et al. 2003). MIRS coupled to Fourier transform infrared spectroscopy (FTIR) is a very important tool for determining acid and sugar in apple juice, and can be used to detect the adulterants. FTIR has been used successfully to detect the organic acids, sugar and soluble solids and to determine the fruit fiNMRess (Lammertyn et al. 1998). Similar studies have been performed with the Attenuated Total Reflectance (ATR) infrared spectroscopy. NMR and IR methods are analytical tools that allow for the simultaneous and nondestructive measurement of multiple parameters, enabling multiple analyses of the same sample.
A current practice is to combine the data obtained through the spectroscopic analyses using multivariate tools, enabling the evaluation of numerous properties, taking into account their correlations and allowing for interferences to be made from the dataset at a known level of significance (Nascimento 2007). In this work, the natural sugar fractions obtained from the pomace of four apple cultivars were characterized by the NMR and FTIR and analyzed using the multivariate tools, i.e., principal component analysis (PCA) and partial least squares (PLS) regression.
MATERIALS
The materials used here were the samples of Gala, Fuji, Joaquina and Catarina apple cultivars from the 2007-2008 crop, Dowex and Amberlite ion
exchange resins, and enzymes for the
quantification of sucrose, fructose and glucose.
METHODS
Extraction of the sugar fraction
twice through the filter paper to separate the solids. The extract was cooled and the water-soluble polysaccharides were removed by filtration after cold precipitation (-18oC) with 66% ethanol
(1 vol. extract/2 vols. ethanol). This mixture was held at this temperature for 2 h to stabilize and flocculate the pectic substances, which were then removed by filtration and centrifugation. The resulting filtrate containing the soluble sugars was reduced to a small volume by low-temperature, low-pressure evaporation, eliminating all the added alcohol. The sugar fraction was then chromatographically purified in ion exchange columns, 26 cm length x 2.5 cm i.d., using Dowex 50WX8 and Amberlite IRA 420 ion-exchange resins. The purified sugar solution was concentrated to approximately 70º Brix under low pressure and temperature (45oC).
Nuclear Magnetic Resonance (NMR)
The 1H NMR spectra were obtained using a
high-resolution Bruker AVANCE-400 MHz NMR
spectrometer operating at 9.4 T, frequency of 400 MHz for 1H. Analysis were done in a 5.0 mm coil
with 90º pulse, acquisition points at 64 K and a spectral window of 10 ppm, performing 16 cumulative scans. The 90º pulse width was 7.5 µs, acquisition time was 7.5 s and recycle delay were 10 s long, totalizing 17.5 s. These conditions was used in other work (Prestes et al. 2012). For the in vitro analysis, the sugar fraction was dissolved in
D2O (600 µL), containing dimethyl-d6 sulfoxide
(DMSO-d6) as internal standard and 2,2,3,3-D4-sodium trimethylsilylpropionate tetra deuterated (TMSP-d4) as chemical shift reference. DMSO was left in a dissecator for 24 h prior to analysis in order to remove the excess of water. The solution was prepared in a volumetric flask by diluting both the standards and the samples and adding 60 µL of
DMSO-d6, 0.03 mg of TMSP-d4, and D2O
excipient to complete 10 mL.
To obtain the 1H NMR spectra, 300 µL of the
sugar fractions from all the four varieties were used, and the samples and standards were previously dissolved in 600 µL of the solutions. The spectra were processed by the spectrometer’s software by adjusting the phase and baseline of each spectrum. NMR chemical shifts were adjusted by using TMSP-d4 peak as reference. The sugar standards and samples were analyzed quantitatively using the same program, by merging two duplets according to α and β glucose (5.21 and 4.63 ppm, respectively), setting boundaries at
5.24 to 5.19 ppm and at 4.66 to 4.60 ppm, respectively. For sucrose, the boundaries were 5.42 and 5.38 ppm for the duplet at 5.39 ppm; for fructose, the boundaries were 4.01 to 3.96 ppm.
Fourier Transform Infrared (FTIR)
The infrared spectra were recorded by a Nicolet 4700 spectrophotometer and each sample was subjected to 32 scans for sugar quantification, using a resolution of 2 cm-1 within a range of
4000-400 cm-1. The sugar fraction was prepared in solid pellet form, using 40 mg of KBr and 0.03 mg of sample obtained from each apple cultivar. Standard sugar pellets were added in proportions of 1.00; 1.50; 2.00 and 2.50% with KBr, and their spectra were used to establish the calibration curve for the quantification of each sugar in the samples’ sugar fractions.
Multivariate Analysis
The four varieties were correlated by PCA with their respective concentrations of each sugar, and quantified by integrating the peaks in NMR and the relative absorbance in FTIR. This procedure evaluates the similarity between the different varieties and the effect of each sugar in the sugar fraction sample. InfoMetrix Pirouette 4.0 software was used for the preliminary program, autoscale processing, and data processing.
Calibration graphs using the partial least squares (PLS) were established with the data obtained from the FTIR spectra of the three standard sugars (glucose, fructose and sucrose) at known concentrations. The model’s calibration and prediction performance was validated by a crossed design of internal and preliminary mean-centered processing. The NMR and FTIR data correlations were analyzed by the matrix determined by the quantitative information of the NMR–measured spectra of the sugars in the range specified as dependent, and that of FTIR as the independent variable. Modeling was also performed with Infometrix Pirouette 4.0 software. Each matrix was analyzed and some spectral regions containing little or no information were excluded.
RESULTS AND DISCUSSION
Analysis of the sugar fraction by high resolution NMR
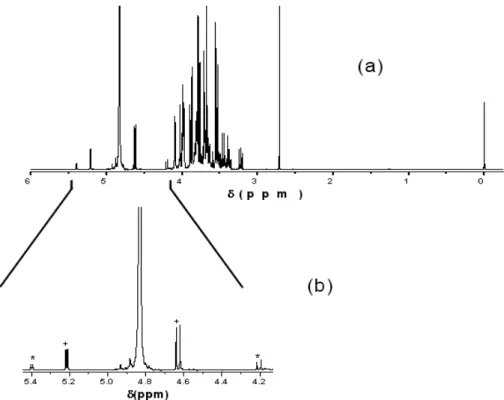
high-resolution NMR spectroscopy. Figure 1(a) shows the spectrum of the sugar fraction from cv. Gala. When the 5.44 to 4.13 ppm region was expanded (Fig. 1 b), a pair of duplets became visible at 5.21 and 4.63 ppm, corresponding to
hydrogen in position 1 from α and β; glucose. Another pair of duplets is visible at 5.39 and 4.20 ppm, which was attributed to hydrogen in position 1 from unities of glucose and 2 of fructose from the structure of a sucrose molecule.
Figure 1 – (a) 1H NMR spectrum in D2O (400 MHz) of the sugar fraction in Gala cv. (b) Expansion
of spectrum (a) in the region of 5.44 to 4.13 ppm, showing glucose (+) and sucrose (*) signals.
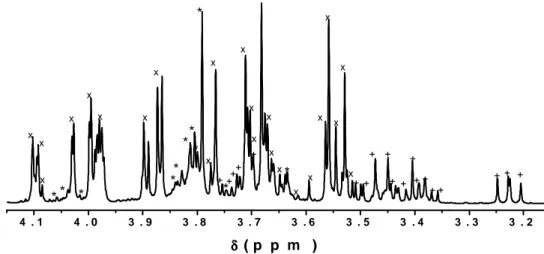
Figure 2 showed the profile of the Gala cultivar spectrum from 4.15 to 3.16 ppm, whose peaks corresponded to the soluble sugars glucose, fructose and sucrose. This spectrum showed glucose signals at 3.75, 3.73, 3.72, and 3.71 ppm and from 3.51 to 3.19 ppm. Fructose signals were in the intervals of 4.11 to 4.08, 4.01 to 3.85, 3.78 to 3.75, 3.72 to 3.69, 3.68 to 3.65, and 3.62 to 3.51 ppm, and the peaks were located at 3.77 and 3.76 ppm. Sucrose showed the peaks at 4.05, 4.03, 4.01, 3.74 and 3.63 ppm, as well as signals from 3.85 to 3.78 ppm. The peak intensities indicated that the highest concentration of sugar found in this specific apple variety was fructose. The three peaks corresponding to all the sugars from 3.2 to 5.4 ppm have already been found in cider (Berregi et al. 2003).
Among the three main sugars, fructose showed the highest content in the sugar fraction of all the samples. In addition, no signals corresponding to
sorbitol, organic acids, and phenolic compounds were detected, leading to the inference that they were either completely absent from the pomace extracts or in such low concentrations that they were undetectable by the NMR. Assuming the presence of only the three main sugars, the NMR spectra were used to determine their contents in the fraction samples, integrating their respective peaks: 3.20 ppm for glucose, 3.89 ppm for fructose and 4.19 ppm for sucrose. The same methodology was used by Eads and Ni (Eads and Ni 1993) in the fruits and Moitrier and Rinke (Moitrier, Rinke, 2007) in orange juice.
Table 1 shows the amounts quantified by 1H NMR
semi-quantitatives as the samples were not replicated. The four varieties contained similar proportions of glucose, fructose and sucrose, but the Gala cultivar showed more desirable features, such as a sweeter flavor, low caloric value, unquestionable bioactivity and low glycemic index, consistently showing the highest quantity of sugars. Glucose ranked second in terms of simple
sugar concentration, especially in the Catarina cv. The characteristics of these sugars and their specific positions in the NMR spectrum have already been reported by Eads and Bryant (1986), who stated that these sugars existed in different concentrations depending on the variety, processing, and maturation level.
4 . 1 4 . 0 3 . 9 3 . 8 3 . 7 3 . 6 3 . 5 3 . 4 3 . 3 3 . 2
+ x
+ + x
x x
x
x x
*
x x x x
+ x x
x
++
*+
+ x
x
*
* **
**
x
x x
x
x x
* * *
x
x
+
+ + + +
+ +
+ ++ +
δδδδ( p p m )
Figure 2 –Expansion of the 4.15 to 3.16 ppm region with the peaks corresponding to glucose (+),
fructose (x) and sucrose (*).
Table 1 – Relative concentrations of simple sugar fractions (glucose, fructose, and sucrose) in the Gala, Fuji,
Catarina and Joaquina cultivars quantified by NMR.
Variety Glucose (%) Fructose (%) Sucrose (%)
Catarina 30.5 66.6 2.9
Joaquina 27.4 69.5 3.0
Fuji 29.5 67.5 3.0
Gala 24.1 72.9 3.0
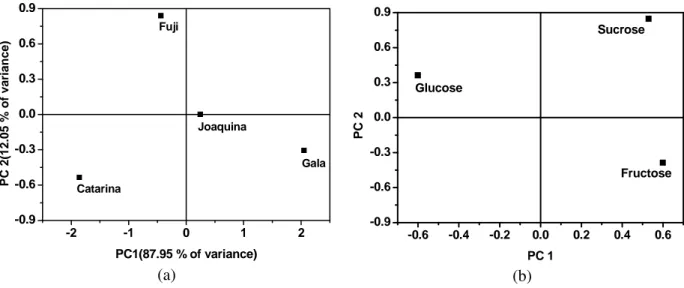
NMR Principal Component Analysis (PCA) Figure 3 shows the PCA results for the sugars in the four samples quantified by the NMR and listed in Table 1. Figure 3a showed the scores and Figure 3b showed the loads, with 99.99% of the variance explained and the continuous and categorical variables shown separately. Figure 3b shows the distributions of the three standard sugars with good separation and comparable load values. A comparison of the loadings and score plots indicated that the Fuji variety behaved differently from the other varieties, presenting a higher influence from glucose and sucrose. The Catarina cultivar had highest glucose content, whereas the Joaquina and Gala varieties contained highest amounts of fructose.
These results clearly demonstrated that any specific sugar concentration was strongly dependent on the apple variety. This analysis is important because it enables the choice of a suitable apple variety based on the desired sugar fraction.
FTIR analysis
-2 -1 0 1 2 -0.9
-0.6 -0.3 0.0 0.3 0.6 0.9
Catarina
Gala Joaquina
P
C
2
(1
2
.0
5
%
o
f
v
a
ri
a
n
c
e
)
PC1(87.95 % of variance)
Fuji
(a)
-0.6 -0.4 -0.2 0.0 0.2 0.4 0.6 -0.9
-0.6 -0.3 0.0 0.3 0.6 0.9
Fructose Sucrose
P
C
2
PC 1 Glucose
(b)
Figure 3 –PCA of the NMR data of the categorical and continuous variables: (a) Scores, (b) loads.
4000 3000 2000 1000
(d) (c)
(b)
(a)
Wavenumber (cm-1)
A
b
so
rb
a
n
ce
4000 3000 2000 1000
(d) (c)
(b)
(a)
Wavenumber (cm-1)
A
b
so
rb
a
n
ce
Figure 4 – FTIR spectrum of sugar fraction obtained from the apple varieties: (a) Gala, (b) Joaquina,
(c) Fuji, and (d) Catarina.
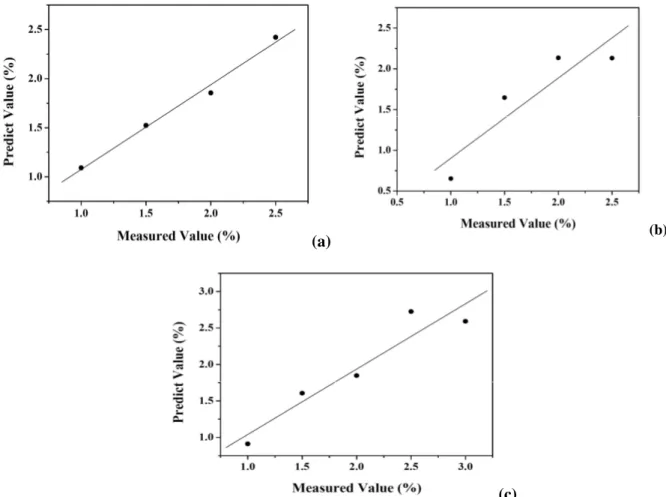
FTIR Partial Least Squares (PLS) Regression Associating the evaluation of peak distributions in some fragments of the IR spectra with chemometric tools is essential to understand all the information yielded by the experiment (Cocchi et al. 2005; Hopke 2003; Kateman and Buydens 1993). Thus, due to the need to identify the characteristic peaks for each sugar, the spectra were obtained from patterns at different concentrations in order to provide a standard curve for each sugar. Because the standard curve for sucrose in four concentrations was still unsatisfactory, two more dots were added. The spectra of the standard sugars were also used to quantify the sugars found by the PLS in the
sugar fraction of the four cultivars in order to design the calibration models for each sugar (Fig. 5). It showed strong correlation between the FTIR data of glucose (Fig. 5a), rval= 0.99, fructose (Fig.
5b), rval= 0.91 and sucrose (Fig. 5c), rval=0.95.
(a) (b)
(c)
Figure 5 –PLS correlation between the measured and predicted values of glucose (a), fructose (b) and
sucrose (c), used to predict the concentration of sugar in the samples.
CONCLUSIONS
The simple sugar fractions of apple pomace were quantified and qualified by the NMR and FTIR spectroscopy associated with the multivariate statistical procedures of PCA and PLS. Instrumental analysis was used to confirm the absence of phenolic compounds and organic acids. The simple sugars extracted could be potentially used as a natural sweetener with a functional appeal due to its high levels of fructose. This use of apple pomace could represent a potentially valuable source of income for the juice processing plants, provided the required chemical and microbiological standards and quality were met.
ACKNOWLEDGEMENTS
The authors acknowledge the Brazilian research funding agencies CAPES and CNPq for the
financial support of this work. We are also indebted to Ponta Grossa State University – UEPG for making its scientific infrastructure available to us.
REFERENCES
BerregiI, Santos JI, Del Campo G, Mirand JI, Aizpuru JM. Quantitation determination of chlorogenic acid in cider apple juices by 1H NMR spectrometry.
Anal Chim Acta.
2003; 486:269-274.
Blanco-Gomis D, Herrero-Sanchez I, Mangas JJ. Characterisation of apple cider cultivars by chemometric techniques using data from high-performance liquid chromatography and flow-injection analysis. Analyst.
1998; 123(6):1187-1191.
Cocchi M, Foca G, Manfredini M, Manzini D, Marchetti A, Sighinolfi S, et al. Use of multivariate analysis of MIR spectra to study bread staling. Annali di Chimica.
Devrajan A, Joshi VK, Gupta K, Sheikher C, Lal BB. Evaluation of apple pomace based reconstituted feed in rats after solid state fermentation and ethanol recovery.
Braz Arch Biol Technol. 2004; 47(1):93-106.
Downing DL. Processed Apple Products. New York: Van Nostrand Reinhold; 1989.
Duarte I, Barros, Belton PS, Righelato R, Spraul M, Humpfer E, et al. High-Resolution Nuclear Magnetic Resonance Spectroscopy and Multivariate Analysis for the Characterization of Beer. J Agric Food Chem. 2002;
50:2475-2481.
Eads TM, Ni QW. Liquid-phase composition of intact fruit tissue measured by high-resolution proton NMR. J Agric
Food Chem. 1993; 41:1026–1034.
Eads TM, Bryant RG. High-resolution proton NMR spectroscopy of milk, orange juice, and apple juice with efficient suppression of the water peak. J Agric Food Chem. 1986; 34:834-837.
Fragaki G, Spyros A, Siragakis G, Salivaras E, Dais P. Detection of extra virgin olive oil adulteration with lampante olive oil and refined olive oil using nuclear magnetic resonance spectroscopy and multivariate statistical analysis. J Agric Food Chem. 2005;
53:2810-2816.
Fuleki T, Pelayo E, Palabay R. Carboxilic acid composition of varietal juices produced from fresh and stored apples. J Agric Food Chem. 1995; 43:598-607.
Hills BP, Clark CJ. Quality assessment of horticultural products by NMR. Annual Reports on NMR
Spectroscopy 2003;50:75-120.
Hopke PK. The evolution of chemometrics. Anal Chim Acta. 2003; 500:365-377.
Lammertyn J, Nicolai BM, De Smedt V, De Baerdemaeker J. Nondestructive measurement of acidity, soluble solids and firmness of Jonagold apples using NIR-spectroscopy. Transactions of the ASAE. 1998;
41:1089-1094.
Leemans V, Destain M-F, Kleynen O. Selection of the most efficient wavelength bands for 'jonagold' apple sorting. Postharvest Biol Technol. 2003; 30(3):221-232.
Keener KM, Stroshine RL, Nyenhuis JA. Proton magnetic resonance measurements of self difusion coefficient of water in sucrose solutions, citric acid solutions, fruit juices, and apple juice. Transactions of the ASAE. 1997;
40:1633–1641.
Kennedy M, List D, Lu Y, Foo LY, Newman RH, Sims IM, et al. Apple pomace and products derived from apple pomace: uses, composition and analysis. In: Linskens HF, Jackson JF. Modern methods of plant analyses: Analysis of plant waste materials. Berlim: Springer Verlag; 1989. 75-119.
Kateman G, Buydens L. Quality Control in Analytical Chemistry: A Series of Monographs on Analytical Chemistry and Its Applications. New York: Wiley; 1993.
Košir IJ, KidriˇC. Use of modern nuclear magnetic resonance spectroscopy in wine analysis: determination of minor compounds. Anal Chim Acta. 2002;
458(1):77-84.
Meade GP, Chen JCP. Cane Sugar Handbook. New york: John Wiley & Sons; 1977.
Moitrier S, Rinke P. An 1H-NMR-Technique For High Throughput Screening In Quality and Authenticity Control Of Fruit Juice And Fruit Juice Raw Materials – SGF-Profiling. Fruit Proces. 2007; 17(1):10-18.
Nascimento ESP. Ésteres em aguardente de cana: seu perfil [Dissertation]. São Carlos: Instituto de Química de São Carlos, Universidade de São Paulo; 2007.
Neto AIS. Ultra-Som Para a Determinação Indireta de Açúcares Redutores Empregando Análise Por Injeção Seqüencial [Dissertation]. Salvador: Universidade Federal da Bahia; 2006.
Peirs A, Lammertyn J, Ooms K, Nicolai BM. Prediction of the optimal picking date of different apple cultivars by means of VIS/NIR-spectroscopy. Postharvest Biol
Technol. 2001; 21:189-199.
Prestes RA, Colnago LA, Forato LA, Vizzotto L, Novotny EH, Carrilho E. A rapid and automated low resolution NMR method to analyze oil quality in intact oilseeds.
Anal Chim Acta. 2007; 596:325-329.
Prestes RA, Colnago LA, Forato LA, Carrilho E, Bassanezi RB, Wulff NA. Nuclear magnetic resonance characterization of metabolite disorder in orange trees caused by citrus sudden death disease. Molec Plant
Pathol. 2009; 10:51-57.
Prestes RA, Almeida DM, Barison A, Pinheiro LA, Wosiacki G. Caracterização por ressonância magnética nuclear de sucos de maçã obtidos por preparações enzimáticas. Quím Nova 2012; 35:1141-1145.
Price KR, Prosser T, Richetin AMF; Rhodes MJC. A comparison of the flavonol content and composition in dessert, cooking and cider-making apples; distribution within the fruit and effect of juicing. Food Chem. 1999;
66:489-494.
Queji MD. Determinação de açúcares simples, ácido málico e compostos fenólicos totais em bagaço de maçã por espectroscopia no infravermelho e método de calibração multivariada [Dissertation]. Ponta Grossa: Universidade Estadual de Ponta Grossa; 2008.
Šmejkalová D, Piccolo A. High-power gradient diffusion NMR spectroscopy for the rapid assessment of extra-virgin olive oil adulteration. Food Chem. 2010;
118:153-158.
Tozetto A, Demiate IM, Nagata N. Exploratory analysis of commercial sugar fractions by infrared spectroscopy (FTIR) and principal component analysis (PCA). Ciênc
Tecnol Alimen. 2007; 27(4):723-728.
Wang Z, Sun J, Liao X, Chen F, Zhao G, Hu X. Mathematical modeling on hot air drying of thin layer apple pomace. Food Res Intern. 2007;40:39-46.
Xing J, Landahl S, Lammertyn J, Vrindts E, De Baerdemaeker J. Effects of bruise type on discrimination of bruised and nonbruised ‘Golden Delicious’ apples by VIS/NIR. Postharvest Biol Technol. 2003;
30(3):249-258.