Soil moisture and soybean physiology affected by
drought in an integrated crop‑livestock system
Amanda Posselt Martins(1), Sérgio Ely Valadão Gigante de Andrade Costa(1), Ibanor Anghinoni(1), Taise Robinson Kunrath(1), Diego Cecagno(1), José Miguel Reichert(2), Fabrício Balerini(1),
Lúcia Rebello Dillenburg(1) and Paulo César de Faccio Carvalho(1)
(1)Universidade Federal do Rio Grande do Sul, Faculdade de Agronomia, Avenida Bento Gonçalves, no 7.712, CEP 91540‑000 Porto Alegre, RS, Brazil. E‑mail: [email protected], [email protected], [email protected], [email protected], [email protected], [email protected], [email protected], [email protected] (2)Universidade Federal de Santa Maria, Centro de Ciências Rurais, Departamento de Solos, Avenida Roraima, no 1.000, Cidade Universitária, Camobi, CEP 97105‑900 Santa Maria, RS, Brazil. E‑mail: [email protected]
Abstract – The objective of this work was to evaluate the impact of grazing intensities after 11 years of an integrated crop-livestock system, under no-tillage, on soil moisture and soybean physiological parameters during a summer season affected by drought. The experiment was established in 2001 on a Rhodic Hapludox. Treatments consisted in the succession of soybean (summer) and a mixed pasture of black oat + Italian ryegrass (winter), under different beef-cattle grazing intensities: intensive grazing, with 0.10-m pasture height; moderate grazing, with 0.20-m pasture height; and no grazing. During the soybean cycle, in the 2011/2012 crop season, rainfall was 40% of the climatological normal. The soil moisture was within the limits of available water both under moderate grazing and no grazing, at 0.00–0.50-m soil depth, but, under intensive grazing, it was below the permanent wilting point, especially up to the grazing height of 0.20 m. Intensive grazing affected negatively the plant physiology parameters, reaching peaks of -2.5 MPa and +6°C for leaf water potential and leaf-air temperature difference, respectively. Moderate grazing or the absence of grazing, during the winter season, results in similar physiological responses, contributing to soybean plant homeostasis.
Index terms: Glycine max, leaf temperature, leaf water potential, water availability.
Umidade do solo e fisiologia da soja afetados por estiagem
em sistema de integração lavoura‑pecuária
Resumo ‒ O objetivo deste trabalho foi avaliar o impacto de intensidades de pastejo após 11 anos de um sistema de integração lavoura‑pecuária, em plantio direto, na umidade do solo e em parâmetros fisiológicos
da soja durante uma safra de verão afetada por seca. O experimento foi iniciado em 2001, em um Latossolo Vermelho. Os tratamentos consistiram na sucessão de soja (verão) e pastagem mista de aveia-preta + azevém (inverno), com diferentes intensidades de pastejo por bovino de corte: pastejo intensivo, com altura de pastejo de 0,10 m; pastejo moderado, com altura de pastejo de 0,20 m; e sem pastejo. No ciclo da soja, na safra
2011/2012, a precipitação foi de 40% da normal climatológica. A umidade do solo ficou dentro dos limites de
água disponível, tanto em pastejo moderado quanto sem pastejo, na camada de 0,00–0,50 m, mas, em pastejo intensivo, a umidade do solo foi menor que o ponto de murcha permanente, especialmente até 0,20 m de altura
de pastejo. O pastejo intensivo afetou negativamente os parâmetros fisiológicos da soja, que atingiu picos de
-2.5 MPa e +6°C para potencial de água na folha e diferença entre temperatura do ar e da folha, respectivamente.
O pastejo moderado ou a ausência de pastejo, durante o inverno, acarreta respostas fisiológicas similares, o que
contribui para a homeostase da soja.
Termos para indexação: Glycine max, temperatura da folha, potencial de água na folha, disponibilidade de água.
Introduction
Land use efficiency in tropical and subtropical
areas, which in some periods of the year remain only
with cover crops, may be increased by the adoption of integrated crop-livestock (ICL) systems. Including ruminant animals to explore the forage capacity of cover
for producers (Sulc &Tracy, 2007; Moraes et al., 2014)
and also increase nutrient use efficiency (Costa et al.,
2014; Martins et al., 2014b), soil biodiversity (Chávez et al., 2011) and economic performance (Oliveira et al., 2014). However, farmers resist adopting ICL systems, since they believe that grazing impacts negatively the cash crop development.
In areas where livestock needs to be integrated with crops, that is, where traditional grain cropping is adopted without livestock exploration (Anghinoni et al., 2013), the impacts of winter grazing on summer crop performance are not clearly established, especially for soybean. According to Martins et al. (2014a), the yield differences between areas with and without grazing occur mainly in summer seasons affected by drought, with rainfall above the climatological normal, when grazed areas result in lower yields. A plausible explanation for this behavior might be found in soil and plant water-related properties and in soybean physiology, since a poor crop establishment and a higher weed pressure were observed in areas where intensive grazing was performed before soybean sowing (Kunrath et al., 2015). However, due
to the difficulty in measuring plant water status in
the soil-plant-atmosphere continuum (Whitmore & Whalley, 2009), this kind of approach is still scarce, particularly regarding ICL systems.
The use of plant physiological parameters, such as the difference between air and leaf temperatures,
besides the leaf water potential (ΨLW), is important
in assessing plant response under variable water conditions. Due to iso- and anisohydric water behavior – decreasing or constant water availability during the hottest hours of the day (Bergonci et al., 2000) –, leaf water potential should be evaluated at two periods:
in the afternoon (ΨLWN) and before sunrise (ΨLWB).
Leaf temperature is also a good indicator of the water status of plants, since it represents energy balance
in plants and depends on the water vapor flow at the
canopy-atmosphere interface (Zia-Khan et al., 2015). When leaf and air temperature are in equilibrium (equilibrium evaporation) (Jones, 2014), the leaf-air
temperature difference (ΔT) may indicate plant water
status (González-Dugo et al., 2006). In this sense, the relevant approaches for the study of water dynamics in food production systems should be transdisciplinary and integrate knowledge of crop physiology, agrometeorology, and soils (Pieruschka et al., 2010).
When monitoring soil moisture content, ΔT and ΨLW together may be extremely useful in evaluating
water stress, considering the changes in biochemical, physiological, and cell-membrane structure processes (Yordanov et al., 2000).
In this context, understanding how winter grazing and its intensity impact soybean physiological parameters and soil water availability, during a drought
season, may help to perform modifications in the
management of areas under ICL systems, avoiding lower grain yields in these systems when compared with pure agricultural systems.
The objective of this work was to evaluate the impact of grazing intensities after 11 years of an integrated crop-livestock system, under no-tillage, on soil moisture and soybean physiological parameters during a summer season affected by drought.
Materials and Methods
A long-term ICL system was conducted since 2001 at the Espinilho farm, belonging to Agropecuária Cerro Coroado, located in the municipality of São Miguel das Missões, in the state of Rio Grande do Sul, in the South region of Brazil (28°57'23"S, 54°21'22"W, at an altitude of 465 m above sea level). The experimental area of approximately 22 ha is in the Brazilian subtropics, which has a warm, humid summer climate, Cfa, according to the Köppen-Geiger
classification. The average temperature is 19°C, and
yearly average rainfall is 1,850 mm (Matzenauer et al., 2013). The area is characterized by slopes of 0.02 to 0.10 m m-1, and the soil is classified as a Latossolo
Vermelho distroferric, i.e., a Rhodic Hapludox (Soil Survey Staff, 1999), which is deep, well-drained, and dark-red, with a clayey texture (540, 270, and 190 g kg-1 of clay, silt, and sand, respectively).
Kaolinite and hematite are the predominant minerals in the clay fraction (Cecagno et al., 2016). Prior to the establishment of the experiment, the area had been managed under a no-tillage system since 1993. In November 2000, soil was sampled and analyzed for chemical characterization at the 0.00–0.05, 0.05–0.10, 0.10–0.15, and 0.15–0.20-m soil layers, according to Tedesco et al. (1995). The obtained values ranged from: 42 to 26 g kg-1 for soil organic matter; 4.9 to 4.6 for pH;
13.4 to 3.7 mg kg-1 for available P; 240 to 55 mg kg-1
Ca; 22 to 11 mmolc kg-1 for exchangeable Mg; 7 to
1 mmolc kg-1 for exchangeable Al; 48 to 34% for base
saturation; and 17 to 4% for aluminum saturation. Grazing by beef cattle began in June 2001 in a pasture system with mixed species: 'Iapar 61' black oat (Avena strigosa Schreb.) + Italian ryegrass (“common” Lolium multiflorum Lam.). The soybean/beef cattle integration consisted of grazing cycles from May to November, in the winter season, and of soybean cropping [Glycine max (L.) Merr.] – with the cultivars
Iguaçu in the first three seasons and Nidera RR in the
remaining ones – from November to May, in the summer season. A total of 45 kg ha-1 black oat was seeded each
year, and Italian ryegrass was established by natural reseeding. At the end of the winter season, existing plant coverage was desiccated, and, in December of each year, soybean was seeded in rows spaced 0.45 m apart at a density of 45 seeds per square meter. Seed inoculation was performed as recommended for
the crop, using Masterfix peat inoculant, whereas
agronomic management (herbicide, insecticide, and fungicide use) was conducted according to technical recommendations. Soybean was harvested every March or April.
Treatments consisted of grazing intensities during winter, which were determined by the following grazing pasture heights, in a randomized complete block design, with three replicates: intensive grazing, with 0.10-m pasture height; moderate grazing, with 0.20-m pasture height; and no grazing, as a reference treatment. The bovine stocking rates for intensive and moderate grazing treatments were 1,306±138 and 931±84 kg ha-1 of liveweight, representing an average
of ten years, from 2001 to 2011.
Neutered male steers (crossbred Angus, Hereford, and Nellore), approximately 12 months old and weighing about 200 kg, began grazing in a cattle
fattening or finishing system. During the grazing
cycle, cattle feed was forage-based with mineral salt supply. A continuous grazing system was adopted with a minimum of three remaining steers (test steers), and grazing began when forage height reached approximately 0.25 m. Therefore, each grazing cycle
was carried out from the first half of July to the first
half of November. Pasture height was controlled every 14 days by the sward-stick method. Approximately 100 randomized readings (points) were taken in each plot. Average pasture height resulted from managing
grazing intensity (stocks) by adding or removing steers from each plot as required.
Plant and soil evaluations for the present study started after the 2011 grazing season, which began on 11/1/2011 and went until soybean harvest on 3/31/2012, named 2011/2012 growing season. The soybean cultivar Nidera 6411 was seeded in November 16, with 0.45-m row spacing and a seed density of 16 seeds per square meter. This cultivar is characterized by a determined growth cycle of 1,150–130 degree-days and belongs to the semi-early maturity group. Fertilization consisted of 240 kg ha-1 of the formula N-P
2O5-K2O 0-25-25 that
was broadcast applied, according to soil analysis and to the recommendation of Tedesco et al. (2004) for 4 Mg ha-1 yield.
A Nexus wireless weather station model TFA 35.1075.1 (TFA Dostmann GmbH & Co., Wertheim, Deutschland) was installed within the experimental area. The station provided data on rainfall events, air relative humidity, and air temperature. From these data, distribution of rainfall, air temperature, and air relative humidity throughout the soybean season and evaluation dates were obtained (Figures 1 and 2). Crop growth stages were determined from
field observations, since the crop development cycle
accelerated due to the low rainfall.
Disturbed soil samples were collected from
4:00 a.m. to 6:30 a.m., to obtain ΨLWB and leaf
temperature before sunrise (LTB), and from 11:30 a.m.
to 1:30 p.m., to determine ΨLWN and leaf temperature
in the afternoon (LTN), at 24–26, 69–73, 82–86, and
117–119 days after sowing (DAS), which corresponds
to the vegetative, blooming, bean‑filling, and maturity
stages, respectively. The evaluated soil layers were: 0.00–0.05, 0.05–0.10, 0.10–0.20, 0.20–0.30, and 0.30– 0.50 m, in order to determine gravimetric moisture and, by correcting for soil bulk density, volumetric
moisture (θv). The limits of available water, namely
field capacity (θFC) and permanent wilting point (θPWP),
were used, according to Cecagno et al. (2016).
The leaf water potential (ΨLW) and leaf temperature
and a 2.8º field of view. Plant leaf temperature values
were measured approximately at 0.15 m from the center of the adaxial leaf surface. Evaluations were only performed in leaves of the upper third part of the plants that received solar radiation, ensuring uniform measurements. This method is noninvasive and more appropriate for evaluating leaf temperature
than the use of thermocouple sensors. Plant ΨLW was
measured after obtaining leaf temperature in the field,
using a Scholander pressure chamber to determine soil
moisture. The ΔT was calculated by subtracting air
temperature from leaf temperature.
Due to the large plot size (1.8 ha in average),
samplings were performed only in the first experimental
block, since plant (leaf temperatures and leaf water potential) and soil (moisture monitoring) evaluations needed to be carried out simultaneously (Jones, 2014). Performing these assessments in the entire experimental area would lead to large, unacceptable time intervals between samplings and analyses. Since only one experimental block was evaluated, the results of the present study were analyzed as a completely randomized design, considering the sample units taken randomly within each treatment as replicates (pseudoreplicates) (Ferreira et al., 2012).
The results were subjected to analysis of variance
and, when significant, means were compared by the
t test, at 5% probability. All statistical analyses were performed with the SAS software, version 9.4 (SAS Institute Inc., Cary, NC, USA), using the sources of variation “soil layer” or “sampling date” as a repeated measure over time (test with different covariance matrices, choosing the one with the lowest values for the Akaike information criterion and Bayesian information criterion), through the Proc Mixed procedure.
Results and Discussion
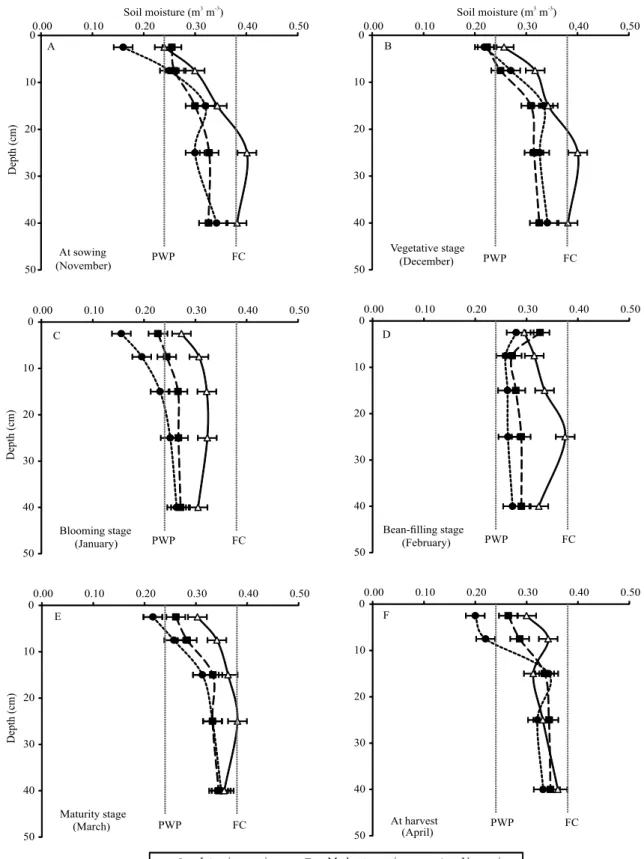
Soybean season was affected by severe drought (Figure 1), which greatly affected air relative humidity and temperature (Figure 2), as well as soil moisture (Figure 3). Since no differences were observed
between available water, θFC, and θPWP, before sunrise
and in the afternoon, the presented results are the average of both evaluation periods (Figure 3). Soil
θv increased with depth regardless of the treatment
and remained within the available water range below 0.20-m depth. In general, moderate grazing and no
grazing conditions maintained θv within the available
water range in the entire soil profile measured at
0.00–0.50 m. However, independently of its intensity, grazing contributed less than no grazing in maintaining soil moisture content during the periods of critical demand by the crop, i.e., during the blooming and
bean‑filling stages. In addition, under grazing, lower
moisture was observed in the top soil layer, whereas, under no grazing, there was higher moisture virtually everywhere. Under intensive grazing conditions, soil
θv remained below θPWP at surface layers from sowing
until the crop’s blooming stage in January and again
at soybean harvest. In the bean‑filling stage, a period
with higher rainfall intensity, there was increased
θv in the surface layers, that is, at 0.00–0.05 and
0.05–0.10-m depths. However, in the maturity stage, only no grazing showed moisture similar to that registered in the previous month.
Changes observed in the soil profile throughout the
soybean cycle can be explained by the complexity in the soil water extraction process due to the simultaneous occurrence of water evaporation and redistribution processes in the soil, besides the effect of drying time. It is still unclear why there was greater soil surface moisture oscillation at 0.00–0.05 and 0.05–0.10-m depths, under grazing treatments, during the higher crop water demand months, i.e., the blooming and
bean‑filling stages (Figure 3). This can be attributed to the absence or inefficiency of the hydraulic
redistribution process (capillary rise), which depends on which water potential there is a crossover of the unsaturated water conductivity curves to structured and more-compacted soil. Regarding intensive grazing conditions, the water loss is higher mainly on soil surface, due to the low amount of residues remaining from the grazing season, which results in increasing soil temperature and water evaporation. Quantity of
forage offered also changes the soil water infiltration
rate and water availability (Bertol et al., 2000). Furthermore, water availability at soybean sowing directly affects crop stand (Thomas & Costa, 2010),
increasing the need for efficient water cycling during
the system’s productive cycle. Lower soil moisture on the surface layer under intensive grazing conditions shows low water buffering of this management under the ICL system.
Despite the long‑term benefits observed under
moderate grazing in the ICL system (Moraes et al., 2014), the used succession (pasture-soybean)
may minimize the benefits of partitioning water
use (Mekonnen et al., 2011). Since the 2011/2012 soybean crop season developed under critical water stress conditions (Figure 1), the low water use in the
soil profile is an indicator of the vulnerability of the
ICL system with crop succession in rainfed systems, regardless of the adopted production system. From sowing to harvest, approximately 45% of soil water
in the profile remained stored below 0.30‑m depth
(Figure 3). Most studies considering soil water distribution and physicochemical properties focus on soil surface layers, since most of the impacts of soil management affect these depths until 0.30 m (Gubiani et al., 2013).
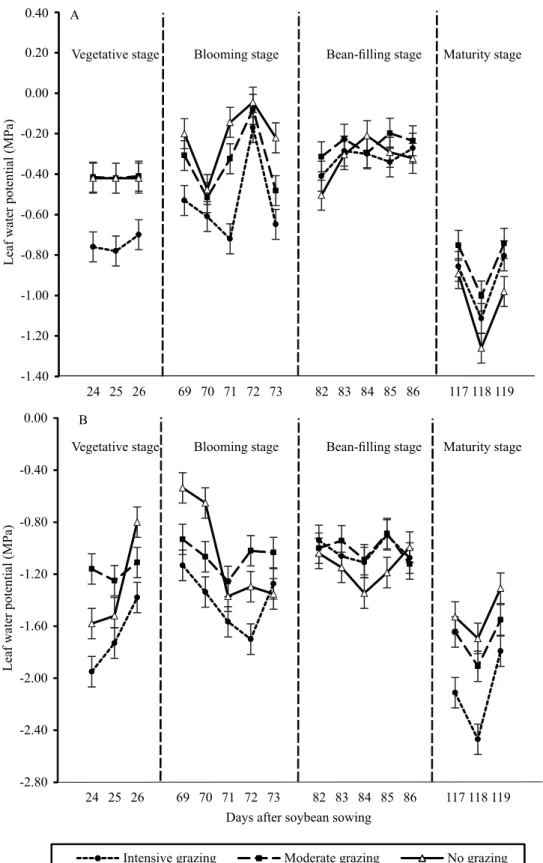
The effects of the grazing intensities on soybean water status during crop development were observed
regarding plant ΨLW values (Figure 4). Plant ΨLWB
values ranged from 0 to ‑1.3 MPa, whereas ΨLWN values
ranged from -0.5 to -2.5 MPa, being within the range obtained for soybean crop under water stress conditions
in the field (Rawson et al., 1978). This range shows
the indispensability of measurements before sunrise due to the anisotropic water behavior of the soybean crop (Bergonci et al., 2000). Therefore, the values for
ΨLWB were higher, whereas those for ΨLWN were lower
because of the accentuated decrease that occurs during the hottest hours of the day.
Under intensive grazing conditions, plant ΨLWN
reached mean values of -1.6 and peaks of -2.2 MPa (Figure 4). In contrast, moderate grazing presented
similar ΨLWB values to no grazing at the vegetative
stage, from 24 to 26 DAS, despite the lower soil moisture. Before sunrise and stomatal opening, when plants tend to enter in equilibrium with soil, the
behavior of ΨLWB at the blooming stage, from 69 to
73 DAS, was similar to that observed in the previously evaluated period, from 24 to 26 DAS, when intensive grazing areas exhibited higher degree of water stress in comparison with no grazing and moderate grazing. The same occurred during the plant water stress
peak, in which the ΨLW behavior, at blooming, in the
afternoon (ΨLWN) was similar to the one verified in
the vegetative stage. Although there were alternating
ΨLW values between no grazing and moderate grazing,
both treatments, overall, showed higher values when compared with intensive grazing.
When soybeans were at the bean‑filling stage,
from 82 to 86 DAS, in general, treatments presented
similar ΨLWB values (Figure 4). However, during the
diurnal period of the critical crop stress, that is, in the
afternoon, ΨLWN under no grazing was lower during
Figure 3. Soil volumetric moisture of a Latossolo Vermelho-Escuro argiloso (Rhodic Hapludox) at sowing (A), throughout different soybean (Glycine max) growth stages (B, vegetative; C, blooming; D, bean‑filling; and E, maturity), and at harvest (F), in a no-tillage, integrated crop-livestock (soybean and beef cattle) system under different grazing intensities in South
Figure 4. Soybean (Glycine max) leaf water potential before sunrise (A) and in the afternoon (B), in different growth stages, in a no-tillage, integrated crop-livestock (soybean and beef cattle) system under different grazing intensities in South Brazil.
Vertical bars represent the least significant difference of the t test, at 5% probability. Intersecting bars represent no significant
treatment. At the maturity stage, from 117 to 119 DAS,
the same occurred for ΨLWB, and the highest values
were observed under moderate grazing. However, no grazing and moderate grazing presented higher values under afternoon stress conditions, whereas intensive grazing values were very low, oscillating from -2.0 to -2.5 MPa.
The value of ΨLWN (Figure 4) under intensive grazing
conditions has a key role, considering that, according to Oosterhuis et al. (1985), the leaf reorientation process in soybean plants starts from -1.4 MPa, representing the critical value for this cash crop. Even
under equilibrium conditions (ΨLWB), values lower
than -0.4 MPa were found. Such value is considered the threshold for the onset of leaf growth inhibition, even more important when compared with the negative effects on photosynthesis; moreover, values below -1.1 MPa result in a reduced soybean photosynthetic rate (Boyer, 1970). Rawson et al. (1978) pointed out
that, during the soil drying process, soybean ΨLW
can reach values below -2.7 MPa, and reduced leaf conductivity and photosynthesis occur from values below -1.5 MPa.
Otherwise, moderate grazing contributed to soybean water status in a positive manner, such that, in the
vegetative stage, ΨLWB values were similar to those
observed for no grazing (Figure 4), despite the lower
soil moisture (Figure 3). The many benefits in the
soil-plant-atmosphere system promoted by adequate grazing, i.e., moderate grazing, according to Anghinoni
et al. (2013), may explain the higher ΨLWN values in
comparison with no grazing. This corroborates the results obtained by Moraes et al. (2014), who showed that the adequate management of ICL systems in the long term promotes improvements to the system as a whole, including the soil’s capacity to promote adequate conditions for plant development even under abiotic stress, such as the drought that occurred in the evaluated season.
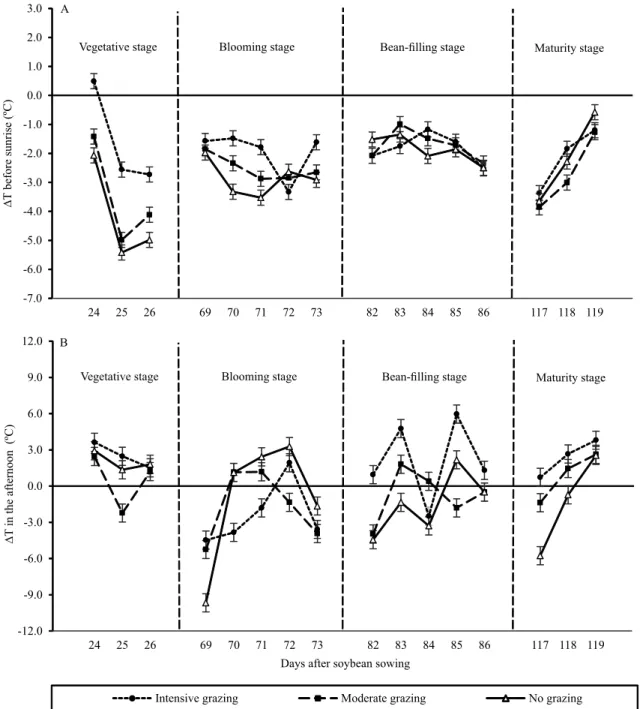
Leaf temperature is a representative physiological parameter of plant water status and its behavior in relation to air temperature is essential under a systemic
analysis (Yu et al., 2015). The ΔT values were consistent
with the water stress conditions in which soybean
developed (Figures 1 and 3): the lower the ΔT value,
the higher the degree of plant cooling and the lower the plant water stress (Figure 5). Overall, independently of
the soil management system, negative ΔTB values were
observed, representing lower leaf temperature, when compared with that of air, and, consequently, lower
water stress conditions. ΔTB values ranged from -5.5 to
0.5°C, and ΔTN values, from -10 to 6°C.
In the vegetative stage, in which measurements were performed from 24 to 26 DAS, LTB exhibited lower
differences in comparison with air under intensive grazing, followed by moderate and no grazing (Figure 5). The same conditions were observed for
ΔTN; however, moderate grazing showed lower values
than no grazing. The ΔTB behavior during the blooming
stage, from 69 to 73 DAS, was similar to that observed in the vegetative stage, with lower values for no grazing, followed by moderate and intensive grazing.
In contrast, except for the first day of evaluation, grazing systems showed lower ΔTN in this month, in
comparison with no grazing.
At the bean‑filling stage, from 82 to 86 DAS, ΔT values presented higher range, from 6 to ‑4°C
(Figure 5), regardless of the adopted management system. However, a change in the effect of management
systems in ΔTB was observed, with high variations
among treatments and evaluation days. Despite the lack of rainfall during the soybean cycle (Figure 1), rainfall was higher in the current period than in the other ones, with 75 of the total 235 mm (32%). Rainfall before the experimental period alters the magnitude of soybean response to soil water and atmospheric
conditions. During the first two days, grazing systems showed lower ΔTB values, whereas an inverse behavior
was verified during the following days, with grazing
systems reaching the highest values. At the end of this evaluation period, at 86 DAS, no differences were observed among treatments. Despite these results, all
management systems had ΔTN >-10°C between January
and February, i.e., the flowering and bean‑filling stages. Comparing ΔTN in February, the values were higher
under intensive grazing than under moderate and no grazing.
At the maturity stage, from 117 to 119 DAS, the last assessed period, moderate grazing exhibited lower
ΔTB values than no grazing, which, in turn, on the
last evaluation day, presented higher values than the intensive and moderate grazing systems (Figure 5).
A similar behavior was found for ΨLWB in the same
month (Figure 4). In contrast, soybean showed higher stress under the intensive grazing system, with higher
Overall, positive ΔTN values were found for grazing
conditions, despite grazing intensity, whereas no grazing resulted in negative values. Crop conditions
are better characterized by ΔT than by soil moisture
(Yu et al., 2015). When soybean plants had grains close to maturation and during harvest, from 117 to
119 DAS, intensive grazing still contributed to high
ΔTN values, following the trend observed throughout
the soybean cycle. This result shows how water stress
is a cumulative process. Positive values were verified in no grazing, indicating that this is a more efficient
system regarding soybean homeostasis.
Figure 5. Difference between soybean (Glycine max) leaf and air temperature (ΔT) before sunrise (A) and in the afternoon (B), in different growth stages, in a no-tillage, integrated crop-livestock (soybean and beef cattle) system under different
The dynamics of soybean water status, resulting from crop development under open-system conditions, demands a complex understanding, suggesting the need for separating individual (plant) from canopy (crop) behavior in further studies. In these studies, deep soil layers, above 0.30 m, must be considered, because, as shown, much of the soil moisture content under drought events is maintained in these layers, which could contribute to the water rise process.
Conclusions
1. In a summer season affected by drought, the crop-livestock system under intensive winter grazing, with pasture height up to 0.20 m, results in lower soil moisture, when compared with no grazing areas.
2. Soybean (Glycine max) physiological parameters, i.e., leaf water potential and leaf temperature, are severely and negatively affected by intensive grazing.
3. Moderate grazing or the absence of grazing during the winter season results in similar physiological responses in soybean, contributing to plant homeostasis.
Acknowledgments
To Coordenação de Aperfeiçoamento de Pessoal de Nível Superior (Capes) and to Conselho Nacional de
Desenvolvimento Científico e Tecnológico (CNPq,
project No. 479877/2011-4), for scholarship grant and
financial support; to Adão Luis Ramos dos Santos,
for the support provided in laboratorial analyses and
in field activities; and to Cabanha Cerro Coroado, for
providing the experimental area, animals, machinery,
and field support.
References
ANGHINONI, I.; CARVALHO, P.C. de F.; COSTA, S.E.V.G. de A. Abordagem sistêmica do solo em sistemas integrados de produção
agrícola e pecuária no subtrópico brasileiro. Tópicos em Ciência do Solo, v.8, p.325-380, 2013.
BERGONCI, J.I.; BERGAMASCHI, H.; BERLATO, M.A.; SANTOS, A.O. Potencial da água na folha como um indicador de
déficit hídrico em milho. Pesquisa Agropecuária Brasileira, v.35, p.1531-1540, 2000. DOI: 10.1590/S0100-204X2000000800005.
BERTOL, I.; ALMEIDA, J.A. de; ALMEIDA, E.X. de; KURTZ, C. Propriedades físicas do solo relacionadas a diferentes níveis de oferta de forragem de capim-elefante-anão cv. Mott. Pesquisa Agropecuária Brasileira, v.35, p.1047-1054, 2000. DOI: 10.1590/ S0100-204X2000000500024.
BOYER, J.S. Leaf enlargement and metabolic rates in corn,
soybean, and sunflower at various leaf water potentials. Plant Physiology, v.46, p.233-235, 1970. DOI: 10.1104/pp.46.2.233.
CECAGNO, D.; COSTA, S.E.V.G. de A.; ANGHINONI, I.; KUNRATH, T.R.; MARTINS, A.P.; REICHERT, J.M.; GUBIANI, P.I.; BALERINI, F.; FINK, J.R.; CARVALHO, P.C. de F. Least limiting water range and soybean yield in a long-term, no-till, integrated crop-livestock system under different grazing intensities. Soil and Tillage Research, v.156, p.54-62, 2016. DOI: 10.1016/j. still.2015.10.005.
CHÁVEZ, L.F.; ESCOBAR, L.F.; ANGHINONI, I.; CARVALHO,
P.C. de F.; MEURER, E.J. Diversidade metabólica e atividade
microbiana no solo em sistema de integração lavoura-pecuária sob intensidades de pastejo. Pesquisa Agropecuária Brasileira, v.46, p.1254-1261, 2011. DOI: 10.1590/S0100-204X2011001000020.
COSTA, S.E.V.G.A.; SOUZA, E.D.; ANGHINONI, I.; CARVALHO, P.C.F.; MARTINS, A.P.; KUNRATH, T.R.; CECAGNO, D.; BALERINI, F. Impact of an integrated no-till crop-livestock system on phosphorus distribution, availability and stock.Agriculture, Ecosystems and Environment, v.190, p. 43-51, 2014.
FERREIRA, D.F.; FILHO, A.C.; LÚCIO, A.D. Procedimentos estatísticos em planejamentos experimentais com restrição na casualização. Boletim Informativo da Sociedade Brasileira de Ciência do Solo, v.37, p.16-19, 2012.
GONZÁLEZ-DUGO, M.P.; MORAN, M.S.; MATEOS, L.; BRYANT, R. Canopy temperature variability as an indicator of crop water stress severity. Irrigation Science, v.24, p.233-240, 2006. DOI: 10.1007/s00271-005-0022-8.
GUBIANI, P.I.; REICHERT, J.M.; REINERT, D.J. Indicadores hídrico-mecânicos de compactação do solo e crescimento de plantas. Revista Brasileira de Ciência do Solo, v.37, p.1-10, 2013. DOI: 10.1590/S0100-06832013000100001.
JONES, H.G. Plants and microclimate: a quantitative approach to environmental plant physiology. 3rd ed. Cambridge: Cambridge
University Press, 2014. 423p.
KUNRATH, T.R.; CARVALHO, P.C. de F.; CADENAZZI, M.; BREDEMEIER, C.; ANGHINONI, I. Grazing management in an integrated crop-livestock system: soybean development and grain yield. Revista Ciência Agronômica, v.46, p.645-653, 2015. DOI: 10.5935/1806-6690.20150049.
MARTINS, A.P.; ANGHINONI, I.; COSTA, S.E.V.G. de A.; CARLOS, F.S.; NICHEL, G. de H.; SILVA, R.A.P.; CARVALHO, P.C. de F. Amelioration of soil acidity and soybean yield after surface lime reapplication to a long-term no-till integrated crop-livestock system under varying grazing intensities. Soil and Tillage Research, v.144, p.141-149, 2014a. DOI: 10.1016/j. still.2014.07.019.
MARTINS, A.P.; COSTA, S.E.V.G. de A.; ANGHINONI, I.; KUNRATH, T.R.; BALERINI, F.; CECAGNO, D.; CARVALHO,
P.C. de F. Soil acidification and basic cation use efficiency in an
MATZENAUER, R.; RADIN, B.; ALMEIDA, I.R. de (Ed.). Atlas climático do Rio Grande do Sul. [Porto Alegre]: CEMETRS, 2013. Available at: <http://www.r3pb.com.br/AtlasCemetRS>. Accessed on: May 27 2013.
MEKONNEN, S.; DESCHEEMAEKER, K.; TOLERA, A.; AMEDE, T. Livestock water productivity in a water stressed environment in northern Ethiopia. Experimental Agriculture, v.47, p.85-98, 2011. Supplement 1. DOI: 10.1017/S0014479710000852.
MORAES, A. de; CARVALHO, P.C. de F.; ANGHINONI, I.; LUSTOSA, S.B.C.; COSTA, S.E.V.G. de A.; KUNRATH, T.R. Integrated crop-livestock systems in the Brazilian subtropics. European Journal of Agronomy, v.57, p.4-9, 2014. DOI: 10.1016/j.eja.2013.10.004.
OLIVEIRA, C.A.O. de; BREMM, C.; ANGHINONI, I.; MORAES, A. de; KUNRATH, T.R.; CARVALHO, P.C. de F. Comparison of an integrated crop-livestock system with soybean only: economic and production responses in southern Brazil. Renewable Agriculture and Food Systems, v.29, p.230-238, 2014. DOI: 10.1017/ S1742170513000410.
OOSTERHUIS, D.M.; WALKER, S.; EASTHAM, J.
Soybean leaflet movements as an indicator of crop water
stress. Crop Science, v.25, p.1101-1106, 1985. DOI: 10.2135/ cropsci1985.0011183X002500060048x.
PIERUSCHKA, R.; HUBER, G.; BERRY, J.A. Control of transpiration by radiation. Proceedings of the National Academy of Sciences, v.107, p.13372-13377, 2010. DOI: 10.1073/ pnas.0913177107.
RAWSON, H.M.; TURNER, N.C.; BEGG, J.E. Agronomic and physiological responses of soybean and sorghum crops to water
deficits. IV. Photosynthesis, transpiration and water use efficiency
in leaves. Australian Journal of Plant Physiology, v.5, p.195-209, 1978. DOI: 10.1071/PP9780195.
SOIL SURVEY STAFF. Soil taxonomy: a basic system of soil
classification for making and interpreting soil surveys. 2nd ed.
Washington: USDA, 1999. (Agriculture Handbook n° 436).
SULC, R.M.; TRACY, B.F. Integrated crop-livestock systems in the U.S. corn belt. Agronomy Journal, v.99, p.335-345, 2007. DOI: 10.2134/agronj2006.0086.
TEDESCO, M.J.; GIANELLO, C.; BISSANI, C.A.A.; BOHNEN, H.; VOLKWEISS, S.J. Análises de solo, plantas e outros materiais. 2.ed. rev. e ampl. Porto Alegre: UFRGS, Departamento de Solos, 1995. 174p. (UFGRS. Boletim técnico, 5).
TEDESCO, M.J.; GIANELLO, C.; ANGHINONI, I.; BISSANI, C.A.; CAMARGO, F.A.O.; WIETHÖLTER, S. (Ed.). Manual de adubação e de calagem para os estados do Rio Grande do Sul e Santa Catarina. Porto Alegre: Sociedade Brasileira de Ciência do Solo, Núcleo Regional Sul, 2004. 400p.
THOMAS, A.L.; COSTA, J.A. (Org.). Soja: manejo para alta produtividade de grãos. Porto Alegre: Evangraf, 2010. 248p.
WHITMORE, A.P.; WHALLEY, W.R. Physical effects of soil drying on roots and crop growth. Journal of Experimental Botany, v.60, p.2845-2857, 2009. DOI: 10.1093/jxb/erp200.
YORDANOV, I.; VELIKOVA, V.; TSONEV, T. Plant responses to drought, acclimation, and stress tolerance. Photosynthetica, v.38, p.171-186, 2000. DOI: 10.1023/A:1007201411474.
YU, M.-H.; DING, G.-D.; GAO, G.-L.; SUN, B.-P.; ZHAO, Y.-Y.; WAN, L.; WANG, D.-Y.; GUI, Z.-Y. How the plant temperature links to the air temperature in the desert plant Artemisia
ordosica. PLoS One, v.10, p.1-14, 2015. DOI: 10.1371/journal.
pone.0135452.
ZIA-KHAN, S.; SPREER, W.; PENGNIAN, Y.; ZHAO, X.; OTHMANLI, H.; HE, X.; MÜLLER, J. Effect of dust deposition on stomatal conductance and leaf temperature of cotton in Northwest China. Water, v.7, p.116-131, 2015. DOI: 10.3390/w7010116.