http://dx.doi.org/10.1590/1806-9061-2015-0060
on Broiler Performance and Economic Parameters
Author(s)
Sayehban PI
Seidavi AI
Dadashbeiki MII
Ghorbani AIII
Araújo WAGIV
Albino LFTV
I Department of Animal Science, Rasht
Branch, Islamic Azad University, Rasht, 49147-39975, Iran. E-mail: p.sayeh@ yahoo.com, [email protected]. Iran corresponding authors.
II Department of Veterinary Science, Rasht
Branch, Islamic Azad University, Rasht, 49147-39975, Iran.
III Agricultural and Natural Resources
Research Center of Guilan, Rasht, 49147-39975, Iran.
IV Federal Institute of Education, Science
and Technology of Northern Minas Gerais, 39480-000, Brazil. E-mail: aziszoo@yahoo. com.br. Brazil corresponding author.
V Department of Animal Science, Federal
University of Viçosa, 36570-000, Brazil.
Mail Address
Corresponding author e-mail address Alireza Seidavi
Department of Animal Science, Rasht Branch, Islamic Azad University, Rasht, 49147-39975, Iran.
Tel: (+98)2147911
Email: [email protected]
Keywords
Feedstuffs, byproducts, poultry, processing.
Submitted: November/2015 Approved: February/2016
ABSTRACT
The effects of the dietary inclusion of olive pulp (OP) and supplementation birds with a commercial enzyme blend (ENZ) on the performance of broilers were evaluated. Six hundred one-day-old male Ross 308 broilers were divided according to a completely randomized design into 10 treatments in a 2×2×2+2 factorial arrangement, consisting of two olive pulp levels (50 and 100 g/kg diet), two pulp categories (processed and non-processed), the inclusion or not of an enzyme blend supplement, and two control treatments without OP and the inclusion or not of the enzyme blend in the diet. Feed intake (FI), weight gain (WG), feed efficiency (FE), energy intake (EI), energy efficiency (EE), protein intake (PI), protein efficiency (PE), feed cost per kg live weight (FC/kg), and production index (IP) were determined. There was no significant difference (p>0.05) between broilers fed the OP diets and the control diets for all parameters. Processed OP improved FE (p≤0.019 from 1-21 days; p≤0.005 from 22-42 days; and
p≤0.008 from 1-42 days of age) and EE (p≤0.012 from 1-21 days;
p≤0.012 from 22-42 days; and p≤0.002 from 1-42 days of age). The enzyme blend supplementation did not influence (p>0.05) any of the studied variables. The inclusion of OP in the diets at levels up to 100g/ kg would does not have deleterious effects on broiler production performance.
INTRODUCTION
Feed accounts for up to 70% of total production costs, and therefore, agricultural and industrial byproducts have been evaluated as feed ingredients to reduce those costs. The advantages include less dependence of livestock production on grains that are consumed by humans and reduction of waste management costs (Zangeneh and Torki, 2011). The utilization of crop residues and byproducts in the past as alternatives to soybean meal in feeds was not successful, mainly due to their high fiber content and poor digestibility. Some exogenous enzymes may be added to broiler diets containing these byproducts to aid fiber digestion (carbohydrases) or to solubilize phytic phosphorus (phytase), thereby reducing their negative effects on broiler production parameters (Choct, 2006).
cobalt, the nutritional value of OP is poor due its low energy, digestible protein, and mineral content, and high lignin content. It is also poor in phosphorus, magnesium, and sodium, but has fair levels of manganese and zinc (Afsari et al., 2013).
The presence of xyloglucans in OP cell walls, which are non-starch polysaccharides (NSP) that have antinutritional effects on non-ruminants, was reported by several authors (Al-Harthi, 2014). In addition, Reis et al. (2002) extracted glucuronoxylans with a xylose/glucose ratio of 7:1 from OP samples, confirming the high content of these antinutritional factors in the feedstuff. However, OP contains oleuropeoside beneficial compounds, such as oleuropein and verbascoside; flavonoid compounds, such as luteolin, luteolin-7-glucoside, apigenin-7-glucoside, diosmetin, diosmetin-apigenin-7-glucoside, and rutin; as well as flavanols, such as catechins; and simple phenolic compounds, such as tyrosol, hydroxytyrosol, vanillin, vanillic acid, and caffeic acid (Ryan et al., 2002). Additionally, the ripening stage at harvest interferes with pectic polysaccharides found in the olive pulp cell walls, due to the presence of calcium chelating dimers, there by changing the nutritional value of this by product (Cardoso et al., 2007).
There are few studies on the inclusion olive byproducts in broiler diets. Feeding OC to broilers up to the level of 150g/kg did not affect performance parameters (El Hachemi et al., 2007). Zarei et al. (2011) reported that the inclusion of up to 86g/kg of olive pulp in the diet of laying hens had no negative effects on production parameters.
Other researchers found positive effects of the nutritional use of olive pulp. Abo Omar (2000) reported an increase in broiler feed intake (and decreased feed efficiency) with the inclusion of about 60g of olive pulp/kg diet. This author related this high feed intake to the fiber content and the consequent increase in passage rate in the gastrointestinal tract. Inclusion levels above 75g/kg of OP has a negative effect on weight gain, according to Rabayaa et al. (2001). On the other hand, the feasibility of including olive pulp up to the level of 160g/kg in broiler diets was reported (Abo Omar et al., 2003). The use of enzymes to improve the nutritional value of olive pulp was studied in laying hens, but no positive effects were observed on production or egg quality parameters (Afsari et al., 2013).
Studies evaluating diets including olive pulp and supplemented with enzymes fed to commercial broilers are scarce. The objective of this experiment was to determine the effects of different dietary levels of processed and non-processed olive pulp and of enzyme supplementation on the performance of broilers.
MATERIAL AND METHODS
Six hundred one- day-old Ross 308 male broilers were housed in cages measuring 1.25 × 1.25 m, which provided a floor area of 0.15 m2 per bird. Cages were located in a poultry house with thermostatically-controlled side curtains. The cage floor was covered with paper roll litter. Broilers remained in the cages for the duration of the experiment, which ended when broilers were 42 days of age. Each cage of 10 chickens was assigned to a specific dietary treatment group.
House temperature was maintained using supplemental heat provided by thermostatically-controlled gasoline stoves, and humidity was added via a water spray in order to maintain the relative humidity between 55-65%. House temperature was maintained at 32°C at the beginning of the experiment and was gradually reduced to 24°C when broilers were 3 weeks of age, after which it was maintained at 24°C until the end of the experiment. Lighting was provided by 23-watt fluorescent tubes in ceiling fixtures. Constant light was provided on day 1, for 21 hours per day from day 2 until the end of the study. Air circulation and tunnel ventilation within the poultry house were provided by three wall-mounted 60-cm diameter fans on one end of the barn, and 160-cm diameter wall-mounted fans on the other end of the barn.
A two-phase feeding program was applied, consisting of a starter feed fed on days 1-21 days and a grower feed supplied on days 22-42. The composition of the starter and grower diets are shown Tables 1 and 2. The diets met or exceeded the recommendations of the Ross 308 manual (Aviagen, 2009).
(anti-oxidant) and an anti-fungal toxin-binder (adsorbent) were added to the OC. The OC was then dried at 70°C using hot air, resulting in OP. Processing of the OP consisted in passing the fruits through a sieve (1.5-mm mesh diameter). During this process, part of the stones (seeds) was removed to produce “partially destoned OP” or processed OP.
Dried OP (processed = partly destoned, dried OP; non-processed = dried OP) was added to the basal starter and grower diets at levels of 50 and 100 g/kg, respectively, which were supplemented or not with an enzyme blend (50 or 0 mg/kg diet). The enzyme (Natuzyme P50®, Australia) contained,
per g of product, 1000,000 IU phytase, 700 IU
β-glucanase, 700 IU α-amylase, 6,000 UI cellulase, 700 IU pectinase, 10,000 IU xylanase, 30 IU lipase, and 3,000 IU protease.
The composition of the dried olive pulp (processed and non-processed) was determined according to the procedures 950.15, 942.05, 954.05, 954.39, 978.10, 927.02, 964.06, 973.18, 974.06 and 920.40 of the AOAC (1990) and is given in Table 3. Ash-free neutral detergent fiber content (aNDF) was determined using the method of Van Soest et al. (1991).
A total of 600 one-day-old male Ross 308 (Aviagen, New Bridge, Scotland, UK) were distributed according to a completely randomized design in a 2×2×2 factorial arrangement, consisting of two olive pulp levels (50 and 100 g/kg diet), two pulp types (processed and non-processed), and two enzyme inclusion levels (0 and 50 mg/kg diet). In addition, two control treatments, as described below, were evaluated. Therefore, 10 treatments with six replicates of 10 birds each were applied. The treatments were as follows:
• 50 p: inclusion of 50 g processed olive pulp/kg of diet and no enzyme supplementation;
• 50 p + ENZ: inclusion of 50 g processed olive pulp/kg of diet and enzyme supplementation (50 mg/kg);
• 100 p: inclusion of 100 g processed olive pulp/kg of diet and no enzyme supplementation;
• 100 p + ENZ: inclusion of 100 g processed olive pulp/kg of diet and enzyme supplementation (50 mg/kg);
• 50 u: inclusion of 50 g non-processed olive pulp/ kg of diet and no enzyme supplementation;
• 50 u + ENZ: inclusion of 50 g non-processed olive pulp/kg of diet and enzyme supplementation (50 mg/kg);
• 100 u: inclusion of 100 g non-processed olive pulp/kg of diet and no enzyme supplementation;
• 100 u + ENZ: inclusion of 100 g non-processed olive pulp/kg of diet and enzyme supplementation (50 mg/kg);
• Ctrl: control diet containing no olive pulp and not supplemented with the enzyme blend;
• Ctrl + ENZ: control diet containing no olive pulp and supplemented with the enzyme blend (50 mg/kg).
The birds and feeds were weighed at the beginning and at the end of the rearing phases (1, 21, and 42 days) in order to calculate weight gain (WG), feed intake (FI), feed efficiency (FE = WG/FI), energy intake (EI = kcal intake/day), energy efficiency (EE = kcal/g WG), protein intake (PI = g of protein intake/day), and protein efficiency (PE = g of protein intake/g WG). The economic viability of the inclusion of OP and ENZ was determined by calculating feed cost (FC) per kg of live weight (FC/kg = Rial/kg WG). Mortality was recorded to allow for the correction of performance data. The production efficiency index (PEI) of 42-day-old birds was calculated according to the following equation: PEI = [(ABW * livability)/MA * FCR]*100, where ABW = average body weight at slaughter, MA = market age, and FCR = feed conversion ratio (FCR = 1/FE).
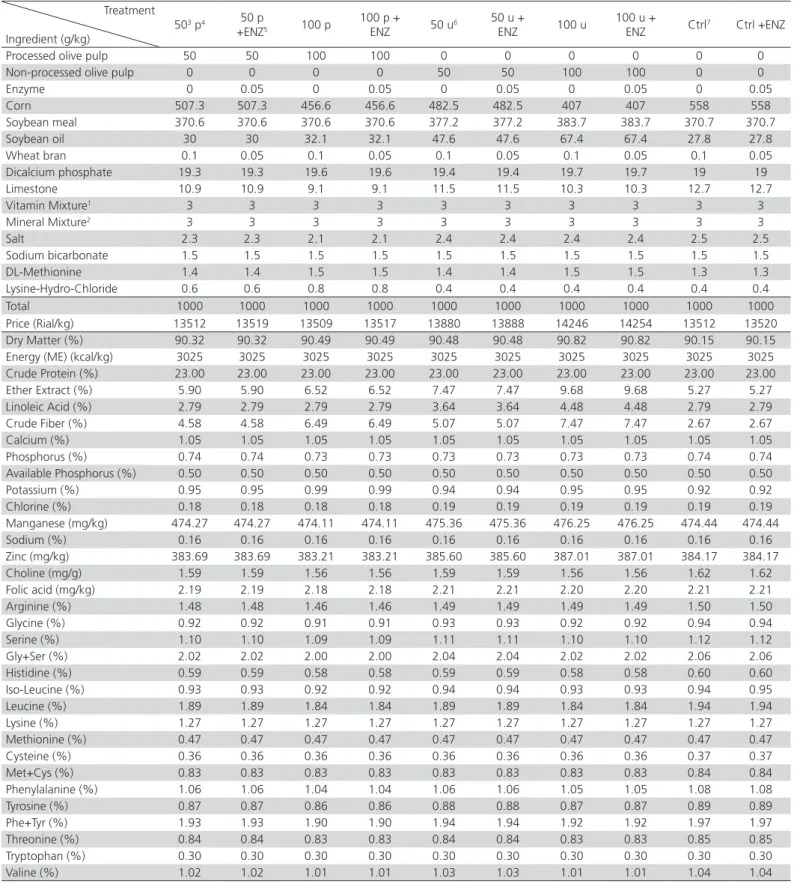
Table 1 – Feed ingredients and analyzed chemical composition of diets used during the starter period (1-21 days of age).
Treatment
Ingredient (g/kg)
503 p4 50 p
+ENZ5 100 p
100 p +
ENZ 50 u6
50 u +
ENZ 100 u
100 u +
ENZ Ctrl7 Ctrl +ENZ
Processed olive pulp 50 50 100 100 0 0 0 0 0 0
Non-processed olive pulp 0 0 0 0 50 50 100 100 0 0
Enzyme 0 0.05 0 0.05 0 0.05 0 0.05 0 0.05
Corn 507.3 507.3 456.6 456.6 482.5 482.5 407 407 558 558 Soybean meal 370.6 370.6 370.6 370.6 377.2 377.2 383.7 383.7 370.7 370.7 Soybean oil 30 30 32.1 32.1 47.6 47.6 67.4 67.4 27.8 27.8 Wheat bran 0.1 0.05 0.1 0.05 0.1 0.05 0.1 0.05 0.1 0.05 Dicalcium phosphate 19.3 19.3 19.6 19.6 19.4 19.4 19.7 19.7 19 19 Limestone 10.9 10.9 9.1 9.1 11.5 11.5 10.3 10.3 12.7 12.7
Vitamin Mixture1 3 3 3 3 3 3 3 3 3 3
Mineral Mixture2 3 3 3 3 3 3 3 3 3 3
Salt 2.3 2.3 2.1 2.1 2.4 2.4 2.4 2.4 2.5 2.5
Sodium bicarbonate 1.5 1.5 1.5 1.5 1.5 1.5 1.5 1.5 1.5 1.5 DL-Methionine 1.4 1.4 1.5 1.5 1.4 1.4 1.5 1.5 1.3 1.3 Lysine-Hydro-Chloride 0.6 0.6 0.8 0.8 0.4 0.4 0.4 0.4 0.4 0.4 Total 1000 1000 1000 1000 1000 1000 1000 1000 1000 1000 Price (Rial/kg) 13512 13519 13509 13517 13880 13888 14246 14254 13512 13520 Dry Matter (%) 90.32 90.32 90.49 90.49 90.48 90.48 90.82 90.82 90.15 90.15 Energy (ME) (kcal/kg) 3025 3025 3025 3025 3025 3025 3025 3025 3025 3025 Crude Protein (%) 23.00 23.00 23.00 23.00 23.00 23.00 23.00 23.00 23.00 23.00 Ether Extract (%) 5.90 5.90 6.52 6.52 7.47 7.47 9.68 9.68 5.27 5.27 Linoleic Acid (%) 2.79 2.79 2.79 2.79 3.64 3.64 4.48 4.48 2.79 2.79 Crude Fiber (%) 4.58 4.58 6.49 6.49 5.07 5.07 7.47 7.47 2.67 2.67 Calcium (%) 1.05 1.05 1.05 1.05 1.05 1.05 1.05 1.05 1.05 1.05 Phosphorus (%) 0.74 0.74 0.73 0.73 0.73 0.73 0.73 0.73 0.74 0.74 Available Phosphorus (%) 0.50 0.50 0.50 0.50 0.50 0.50 0.50 0.50 0.50 0.50 Potassium (%) 0.95 0.95 0.99 0.99 0.94 0.94 0.95 0.95 0.92 0.92 Chlorine (%) 0.18 0.18 0.18 0.18 0.19 0.19 0.19 0.19 0.19 0.19 Manganese (mg/kg) 474.27 474.27 474.11 474.11 475.36 475.36 476.25 476.25 474.44 474.44 Sodium (%) 0.16 0.16 0.16 0.16 0.16 0.16 0.16 0.16 0.16 0.16 Zinc (mg/kg) 383.69 383.69 383.21 383.21 385.60 385.60 387.01 387.01 384.17 384.17 Choline (mg/g) 1.59 1.59 1.56 1.56 1.59 1.59 1.56 1.56 1.62 1.62 Folic acid (mg/kg) 2.19 2.19 2.18 2.18 2.21 2.21 2.20 2.20 2.21 2.21 Arginine (%) 1.48 1.48 1.46 1.46 1.49 1.49 1.49 1.49 1.50 1.50 Glycine (%) 0.92 0.92 0.91 0.91 0.93 0.93 0.92 0.92 0.94 0.94 Serine (%) 1.10 1.10 1.09 1.09 1.11 1.11 1.10 1.10 1.12 1.12 Gly+Ser (%) 2.02 2.02 2.00 2.00 2.04 2.04 2.02 2.02 2.06 2.06 Histidine (%) 0.59 0.59 0.58 0.58 0.59 0.59 0.58 0.58 0.60 0.60 Iso-Leucine (%) 0.93 0.93 0.92 0.92 0.94 0.94 0.93 0.93 0.94 0.95 Leucine (%) 1.89 1.89 1.84 1.84 1.89 1.89 1.84 1.84 1.94 1.94 Lysine (%) 1.27 1.27 1.27 1.27 1.27 1.27 1.27 1.27 1.27 1.27 Methionine (%) 0.47 0.47 0.47 0.47 0.47 0.47 0.47 0.47 0.47 0.47 Cysteine (%) 0.36 0.36 0.36 0.36 0.36 0.36 0.36 0.36 0.37 0.37 Met+Cys (%) 0.83 0.83 0.83 0.83 0.83 0.83 0.83 0.83 0.84 0.84 Phenylalanine (%) 1.06 1.06 1.04 1.04 1.06 1.06 1.05 1.05 1.08 1.08 Tyrosine (%) 0.87 0.87 0.86 0.86 0.88 0.88 0.87 0.87 0.89 0.89 Phe+Tyr (%) 1.93 1.93 1.90 1.90 1.94 1.94 1.92 1.92 1.97 1.97 Threonine (%) 0.84 0.84 0.83 0.83 0.84 0.84 0.83 0.83 0.85 0.85 Tryptophan (%) 0.30 0.30 0.30 0.30 0.30 0.30 0.30 0.30 0.30 0.30 Valine (%) 1.02 1.02 1.01 1.01 1.03 1.03 1.01 1.01 1.04 1.04
1 Vitamin A: 3,600,000 IU/kg; Vitamin D
3: 800,000 IU/kg; Vitamin E: 7,200IU/kg; Vitamin K3: 800 mg/kg; Vitamin B1: 720 mg/kg; Vitamin B2: 2,640 mg/kg; Vitamin B3 (Calcium
Panto-thenate): 4,000 mg/kg; Vitamin B5 (Niacin):12,000 mg/kg; Vitamin B6: 1,200 mg/kg; Vitamin B9 (Folic acid): 400 mg/kg; Vitamin B12: 6 mg/kg; Vitamin H2 (Biotin): 40 mg/kg; Choline: 100,000 mg/kg; Antioxidant: 40,000 mg/kg and 1mg/kg Excepient.
2Mn: 39,680 mg/kg; Fe: 20,000 mg/kg; Zn: 33,880 mg/kg; Cu: 4,000 mg/kg; I: 400 mg/kg; Se: 80 mg/kg; Choline: 100,000 mg/kg and 1 mg/kg Excepient. 3 50 g/kg olive pulp inclusion.
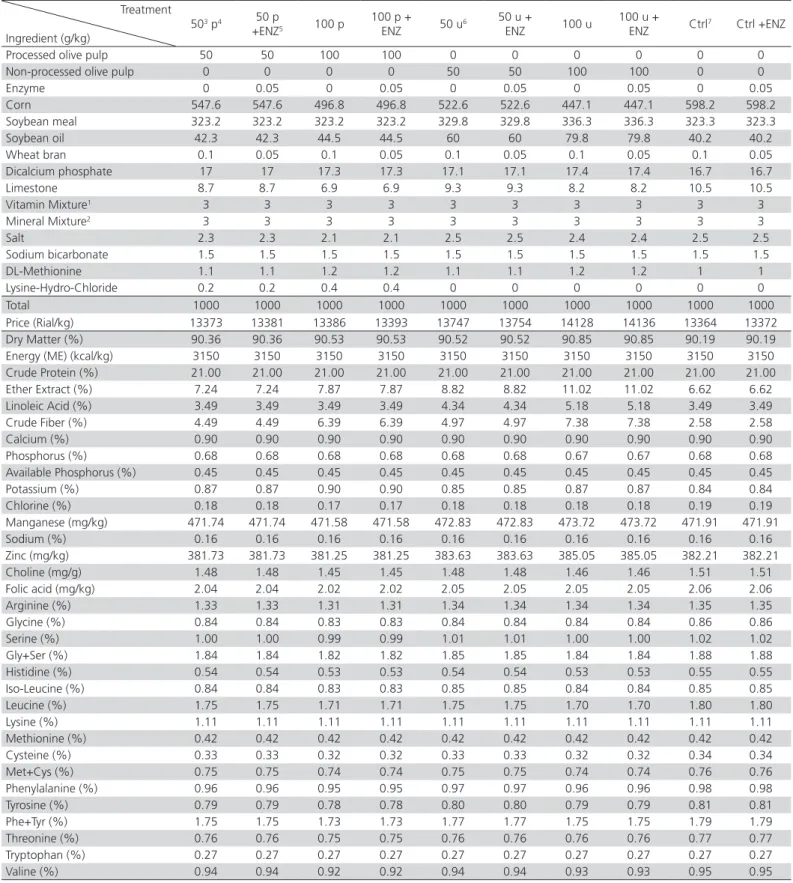
Table 2 – Feed ingredients and analyzed chemical composition of diets used during the finishing period (22-42 days of age).
Treatment
Ingredient (g/kg)
503 p4 50 p
+ENZ5 100 p
100 p +
ENZ 50 u6
50 u +
ENZ 100 u
100 u +
ENZ Ctrl7 Ctrl +ENZ
Processed olive pulp 50 50 100 100 0 0 0 0 0 0
Non-processed olive pulp 0 0 0 0 50 50 100 100 0 0
Enzyme 0 0.05 0 0.05 0 0.05 0 0.05 0 0.05
Corn 547.6 547.6 496.8 496.8 522.6 522.6 447.1 447.1 598.2 598.2 Soybean meal 323.2 323.2 323.2 323.2 329.8 329.8 336.3 336.3 323.3 323.3 Soybean oil 42.3 42.3 44.5 44.5 60 60 79.8 79.8 40.2 40.2 Wheat bran 0.1 0.05 0.1 0.05 0.1 0.05 0.1 0.05 0.1 0.05 Dicalcium phosphate 17 17 17.3 17.3 17.1 17.1 17.4 17.4 16.7 16.7
Limestone 8.7 8.7 6.9 6.9 9.3 9.3 8.2 8.2 10.5 10.5
Vitamin Mixture1 3 3 3 3 3 3 3 3 3 3
Mineral Mixture2 3 3 3 3 3 3 3 3 3 3
Salt 2.3 2.3 2.1 2.1 2.5 2.5 2.4 2.4 2.5 2.5
Sodium bicarbonate 1.5 1.5 1.5 1.5 1.5 1.5 1.5 1.5 1.5 1.5
DL-Methionine 1.1 1.1 1.2 1.2 1.1 1.1 1.2 1.2 1 1
Lysine-Hydro-Chloride 0.2 0.2 0.4 0.4 0 0 0 0 0 0
Total 1000 1000 1000 1000 1000 1000 1000 1000 1000 1000 Price (Rial/kg) 13373 13381 13386 13393 13747 13754 14128 14136 13364 13372 Dry Matter (%) 90.36 90.36 90.53 90.53 90.52 90.52 90.85 90.85 90.19 90.19 Energy (ME) (kcal/kg) 3150 3150 3150 3150 3150 3150 3150 3150 3150 3150 Crude Protein (%) 21.00 21.00 21.00 21.00 21.00 21.00 21.00 21.00 21.00 21.00 Ether Extract (%) 7.24 7.24 7.87 7.87 8.82 8.82 11.02 11.02 6.62 6.62 Linoleic Acid (%) 3.49 3.49 3.49 3.49 4.34 4.34 5.18 5.18 3.49 3.49 Crude Fiber (%) 4.49 4.49 6.39 6.39 4.97 4.97 7.38 7.38 2.58 2.58 Calcium (%) 0.90 0.90 0.90 0.90 0.90 0.90 0.90 0.90 0.90 0.90 Phosphorus (%) 0.68 0.68 0.68 0.68 0.68 0.68 0.67 0.67 0.68 0.68 Available Phosphorus (%) 0.45 0.45 0.45 0.45 0.45 0.45 0.45 0.45 0.45 0.45 Potassium (%) 0.87 0.87 0.90 0.90 0.85 0.85 0.87 0.87 0.84 0.84 Chlorine (%) 0.18 0.18 0.17 0.17 0.18 0.18 0.18 0.18 0.19 0.19 Manganese (mg/kg) 471.74 471.74 471.58 471.58 472.83 472.83 473.72 473.72 471.91 471.91 Sodium (%) 0.16 0.16 0.16 0.16 0.16 0.16 0.16 0.16 0.16 0.16 Zinc (mg/kg) 381.73 381.73 381.25 381.25 383.63 383.63 385.05 385.05 382.21 382.21 Choline (mg/g) 1.48 1.48 1.45 1.45 1.48 1.48 1.46 1.46 1.51 1.51 Folic acid (mg/kg) 2.04 2.04 2.02 2.02 2.05 2.05 2.05 2.05 2.06 2.06 Arginine (%) 1.33 1.33 1.31 1.31 1.34 1.34 1.34 1.34 1.35 1.35 Glycine (%) 0.84 0.84 0.83 0.83 0.84 0.84 0.84 0.84 0.86 0.86 Serine (%) 1.00 1.00 0.99 0.99 1.01 1.01 1.00 1.00 1.02 1.02 Gly+Ser (%) 1.84 1.84 1.82 1.82 1.85 1.85 1.84 1.84 1.88 1.88 Histidine (%) 0.54 0.54 0.53 0.53 0.54 0.54 0.53 0.53 0.55 0.55 Iso-Leucine (%) 0.84 0.84 0.83 0.83 0.85 0.85 0.84 0.84 0.85 0.85 Leucine (%) 1.75 1.75 1.71 1.71 1.75 1.75 1.70 1.70 1.80 1.80 Lysine (%) 1.11 1.11 1.11 1.11 1.11 1.11 1.11 1.11 1.11 1.11 Methionine (%) 0.42 0.42 0.42 0.42 0.42 0.42 0.42 0.42 0.42 0.42 Cysteine (%) 0.33 0.33 0.32 0.32 0.33 0.33 0.32 0.32 0.34 0.34 Met+Cys (%) 0.75 0.75 0.74 0.74 0.75 0.75 0.74 0.74 0.76 0.76 Phenylalanine (%) 0.96 0.96 0.95 0.95 0.97 0.97 0.96 0.96 0.98 0.98 Tyrosine (%) 0.79 0.79 0.78 0.78 0.80 0.80 0.79 0.79 0.81 0.81 Phe+Tyr (%) 1.75 1.75 1.73 1.73 1.77 1.77 1.75 1.75 1.79 1.79 Threonine (%) 0.76 0.76 0.75 0.75 0.76 0.76 0.76 0.76 0.77 0.77 Tryptophan (%) 0.27 0.27 0.27 0.27 0.27 0.27 0.27 0.27 0.27 0.27 Valine (%) 0.94 0.94 0.92 0.92 0.94 0.94 0.93 0.93 0.95 0.95
1 Vitamin A: 3,600,000 IU/kg; Vitamin D
3: 800,000 IU/kg; Vitamin E: 7,200IU/kg; Vitamin K3: 800 mg/kg; Vitamin B1: 720 mg/kg; Vitamin B2: 2,640 mg/kg; Vitamin B3 (Calcium
Panto-thenate): 4,000 mg/kg; Vitamin B5 (Niacin):12,000 mg/kg; Vitamin B6: 1,200 mg/kg; Vitamin B9 (Folic acid): 400 mg/kg; Vitamin B12: 6 mg/kg; Vitamin H2 (Biotin): 40 mg/kg; Choline: 100,000 mg/kg; Antioxidant: 40,000 mg/kg and 1mg/kg Excepient.
2Mn: 39,680 mg/kg; Fe: 20,000 mg/kg; Zn: 33,880 mg/kg; Cu: 4,000 mg/kg; I: 400 mg/kg; Se: 80 mg/kg; Choline: 100,000 mg/kg and 1 mg/kg Excepient. 3 50 g/kg olive pulp inclusion.
Table 3 – Chemical composition of two types of olive meal used in the experiment
Types of olive pulp
(g/kg dry matter)
Processed (partially destoned and dried) olive pulp
Non-processed olive pulp (original dried) Dry matter 934.5 935.7 Energy (ME) (kcal/kg) 2980 1250 Crude protein 107.3 71.1 Crude fiber 256.0 350.0 Neutral detergent fiber (α-amylase) 716.0 744.0 Acid detergent fiber 550.0 584.0
Ash 85.0 62.0
Crude fat 130.0 85.0
Calcium 8.2 06.1
Phosphorus 0.7 0.6
Soluble sugars 1.7 1.4
Starch 9.7 10.5
Total polyphenols 3.7 1.9 Total tannins 22.9 17.9
RESULTS AND DISCUSSION
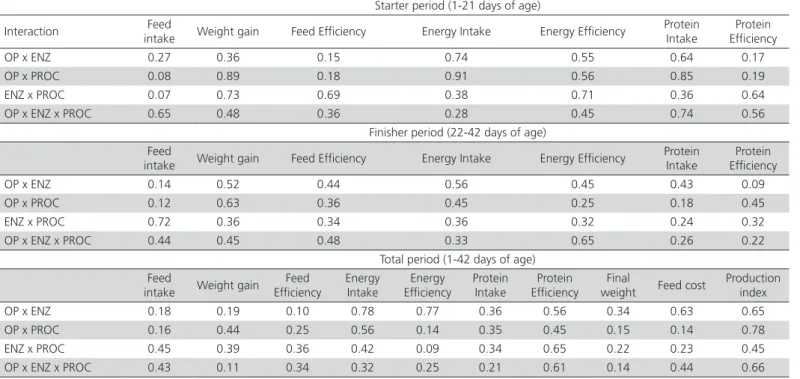
No significant interaction (p>0.05, Table 8) was observed between olive pulp (OP) levels and enzyme supplementation, OP levels and pulp processing, enzyme supplementation and pulp processing, or between OP levels, enzyme supplementation and pulp processing for the studied variables. Levels of OP did not influence (p>0.05, Tables 4, 5, 6 and 7) FI, WG, FE, EI, EE, PI, or PE at any rearing phase. The dietary supplementation of the ENZ did not influence (p>0.05, Tables 4, 5, 6 and 7) any of the studied performance parameters (FI, WG, FE, EI, EE, PI, and PE). OP processing has no effect on FI, PI, or EI (p>0.05, Tables 4, 5, 6 and 7). The dietary inclusion of processed OP promoted higher WG (p≤0.001 in the period of 1-21 days of age; and p≤ 0.005 in the period of 1-42 days of age), FE (p≤0.019 the period of 1-21 days of age; p≤0.005 in the period of 22-42 days of age; and p≤0.008 in the period of 1-42 days of age), EE (p≤0.012 the period of 1-21 days of age; p≤0.012 in the period of 22-42 days of age; and p≤0.002 in the period of 1-42 days of age), and PE (p≤0.035 the period of 1-21 days of age; p≤0.017 in the period of 22-42 days of age; and
p≤0.018 in the period of 1-42 days of age) compared with non-processed OP (Tables 4, 5, 6 and 7).
These results indicate that OP can be included the level of up to 100g/kg in the feed with no adverse effects on broiler performance. Broiler performance was not impaired when olive cake (OC) was included in the diet at 150g/kg (El Hachemi et al., 2007). Olive cake is a byproduct of the olive industry derived from wet extraction (without posterior drying). The presence
of water in the feed greatly reduces its nutritional value due to the dilution. Therefore, the nutritional value of OP considerably increases after drying, allowing a greater level of inclusion in the diets without impairing broiler performance. Another important fact is that feed rapidly deteriorates when feedstuffs with high moisture content are included, as they promote the development of fermentative bacteria and fungi, which can harm bird health.
A study reported that an OP inclusion level of up to 86g/kg in a layer feed did not impair laying percentage or other performance parameters (Zarei et al., 2011). Afsari et al. (2013), working with layers, also obtained similar results when including 90g/kg of OP in the diet. Other papers report much higher OP inclusion levels. For instance, Abo Omar et al. (2003) included 160g/kg of OP in broiler diets and did not observe any influence on FI, WG, or FE. Differently from the present study, other authors were not as successful when adding high OP levels (up to 100g/kg) in the diets for non-ruminants. Abo Omar (2000) reported an increase in feed intake (and reduced feed efficiency) associated with broiler diets with the inclusion up to 60g/kg of olive pulp. Rabayaa et al. (2001) utilized a maximum OP level of 75g/kg diet without reduction in broiler WG. These authors argue that the observed performance losses are related to the high fiber content of this byproduct. Despite these arguments, the inclusion of OP at the level of 100g/kg in the present experiment did not cause any performance losses no problems. This supports the hypothesis that in regions where there is a large supply of this byproduct, it may be used as raw material in poultry diets.
The xyloglucan content of OP did not affect the performance of the broilers fed 100g/kg of OP, as its level was within the safe limits for diets based on corn and soybean meal. The presence of other antinutritional factors in OP, such as pectic polysaccharides (Cardoso
et al., 2007), did not negatively affect the performance
at this level of inclusion.
et al., 2012). Therefore, at this level of OP addition, the levels of these substances may too low or they may have been inactivated by the crushing process (Clodoveo, 2012).
Afsari et al. (2013) added enzymes to diets containing 100g/kg of OP and did not find any performance gains in laying hens. Zangeneh and Torki (2011) did not observe any improvements in egg production, egg mass, or FE when adding
β-mannanase to diets containing up to 90g/kg OP. The use of commercial exogenous enzymes in poultry diets as digestibility enhancers of various substrates is now a common practice (Choct, 2006). Experimental designs that include enzymes generally focus on the addition of enzymes while discounting their nutritional value in the diets (Choct, 2006). The experimental diet met all nutritional requirements of the evaluated broiler strain, independently of the ENZ inclusion. Therefore, the nutrients provided by enzymes exceeded the requirements of the birds. Araújo et al. (2014), studying other fibrous byproducts of the oil industry such as sunflower meal, found a positive interaction between the inclusion of an enzyme blend and increasing levels of this feedstuff. In his experimental design, the nutritional values that would have been provided by increasing the digestibility of that feedstuff due to the inclusion of the enzyme belnd were discounted. Due to the experimental design that was used in the present experiment, it was not possible to observe any benefits of the addition of ENZ at levels of up to 100g/ kg OP in terms of improvement of the nutritional value of the diets.
Behnke and Beyer (2002) evaluated the benefits of processing feed for the performance of broilers. Feed processing increases nutrient levels, particularly energy (Moritz et al., 2005). Olive seeds are highly lignified and have a low fat content (García-Ayuso & Luque de Castro, 1999). When OP is processed by partially destoning, its nutritional value increases, indicating that it may be included at high levels in non-ruminant feeds. In this study, a maximum level of 100 g/kg was included in the diet, but no interaction between processing (destoning) and dietary inclusion levels were detected. This interaction may be perhaps observed when higher inclusion levels of OP in future studies. The increase in FI was related to the lower fiber content of the feed including processed OP. Fiber is bulky and physical limits intake, which explains the observed values. The higher intake observed in treatments with processed OP together with even greater WG values explains the greater FE of birds fed
processed OP compared with those fed non-processed OP. The increase in EE and PE may be attributed to the lower fiber content of the processed material, as there was a decrease in the digesta rate of passage, improving FE as a whole.
An another explanation the better results obtained with processed OP is that the removal of the enzymes contained in the olive seeds (stones) of olives resulted in higher content of antioxidant factors (Table 3). Lavelli and Bondesan (2005) observed an increase in total secoiridoid polyphenol (with antioxidant, antimicrobial and anti-inflammatory activities) content and in the antioxidant activity of extra virgin olive oils produced from pre-destoned fruits. Those researchers concluded that further knowledge on the reactions that occur during olive processing, particularly with regards to the involvement of endogenous pulp and stone enzymes, is essential for predicting the effect of destoning on extra virgin olive oil quality. The olive oil residue contributes with most of the energy provided by the OP in broiler diets, where the oil and those beneficial dietary factors are present. Therefore, the presence of these antioxidant, antimicrobial, and anti-inflammatory compounds (not inactivated by seed enzymes) may have contributed to the superior poultry performance in the broilers fed the processed OP.
No significant interaction (p>0.05, Table 7) between olive pulp (OP) levels and enzyme supplementation, OP levels and pulp processing, or enzyme supplementation and pulp processing were detected for economic parameters. The inclusion of OP increased (p≤0.04, Table 7) FC at the 100g/kg level, but did not affect
(p>0.05, Table 7) PEI. The inclusion of ENZ did not
such costs are lower, and therefore may contribute to reduce poultry production costs. It was expected that the inclusion of OP would not interfere with PEI values, as it did not influence performance results (FI, WG, FE, IE, EE, PE, and PI). The PEI is calculated using performance and livability (PEI = [(ABW * livability) / MA * FCR] * 100). Since the dietary inclusion of OP did not affect broiler performance, PEI values could be influenced only by mortality differences among the treatments, which was not the case, as evidenced by the PEI results.
Dietary ENZ inclusion did not affect PEI or FC, and consequently did not affect mortality, as previously discussed for OP inclusion. Araújo et al. (2014) also did not find improvements in PEI when adding an enzyme blend to diets containing increasing sunflower levels. However, the addition of enzymes to diets with fibrous oil industry byproducts may have a positive effect on economic efficiency (Araújo et al., 2014). Enzymes are used worldwide to reduce the feed costs associated with poultry production (Choct, 2006). Again, these results may be explained by the experimental design that is used. Commonly, the studies with enzymes apply diets that consider the nutritional matrix of the
enzyme products when formulation the experimental diets (Choct, 2006), differently from the present study, where the enzyme blend was added “on top” of the broiler requirements.
Although OP processing (partial destoning) improved broiler performance, such effect was not observed for PEI and FC. These results are more difficult to understand, as we did expect better PEI values due to the better performance results. The cost of OP processing was low cost, since there were no differences in FC between the inclusion of processed and non-processed OP. Due to the better performance of broilers obtained with the same FC, OP processing would be very interesting for the poultry industry from an economic point of view. However, PEI is more important than performance in modern broiler production. PEI is widely used today when evaluating the production of broiler chickens of various current commercial strains (Zlatica el al., 2009). According to Zlatica et al. (2009), the success of a poultry flock can be measured by this index. Therefore, it may be inferred that including OP in the feed, either processed or not, provides similar results to the poultry production chain.
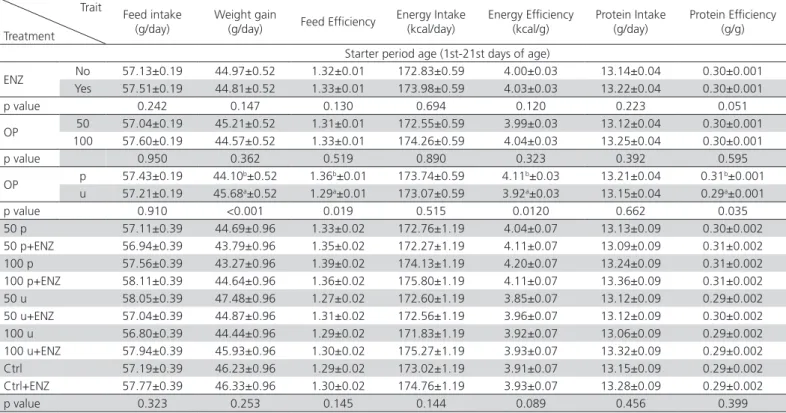
Table 4 – Performance of 1- to 21-day-old broilers fed diets containing the different levels of olive pulp (processed and
non-processed), and supplemented or not with enzymes*
Trait
Treatment
Feed intake (g/day)
Weight gain
(g/day) Feed Efficiency
Energy Intake (kcal/day)
Energy Efficiency (kcal/g)
Protein Intake (g/day)
Protein Efficiency (g/g)
Starter period age (1st-21st days of age)
ENZ No 57.13±0.19 44.97±0.52 1.32±0.01 172.83±0.59 4.00±0.03 13.14±0.04 0.30±0.001 Yes 57.51±0.19 44.81±0.52 1.33±0.01 173.98±0.59 4.03±0.03 13.22±0.04 0.30±0.001
p value 0.242 0.147 0.130 0.694 0.120 0.223 0.051
OP 50 57.04±0.19 45.21±0.52 1.31±0.01 172.55±0.59 3.99±0.03 13.12±0.04 0.30±0.001 100 57.60±0.19 44.57±0.52 1.33±0.01 174.26±0.59 4.04±0.03 13.25±0.04 0.30±0.001
p value 0.950 0.362 0.519 0.890 0.323 0.392 0.595
OP p 57.43±0.19 44.10b±0.52 1.36b±0.01 173.74±0.59 4.11b±0.03 13.21±0.04 0.31b±0.001 u 57.21±0.19 45.68a±0.52 1.29a±0.01 173.07±0.59 3.92a±0.03 13.15±0.04 0.29a±0.001
p value 0.910 <0.001 0.019 0.515 0.0120 0.662 0.035 50 p 57.11±0.39 44.69±0.96 1.33±0.02 172.76±1.19 4.04±0.07 13.13±0.09 0.30±0.002 50 p+ENZ 56.94±0.39 43.79±0.96 1.35±0.02 172.27±1.19 4.11±0.07 13.09±0.09 0.31±0.002 100 p 57.56±0.39 43.27±0.96 1.39±0.02 174.13±1.19 4.20±0.07 13.24±0.09 0.31±0.002 100 p+ENZ 58.11±0.39 44.64±0.96 1.36±0.02 175.80±1.19 4.11±0.07 13.36±0.09 0.31±0.002 50 u 58.05±0.39 47.48±0.96 1.27±0.02 172.60±1.19 3.85±0.07 13.12±0.09 0.29±0.002 50 u+ENZ 57.04±0.39 44.87±0.96 1.31±0.02 172.56±1.19 3.96±0.07 13.12±0.09 0.30±0.002 100 u 56.80±0.39 44.44±0.96 1.29±0.02 171.83±1.19 3.92±0.07 13.06±0.09 0.29±0.002 100 u+ENZ 57.94±0.39 45.93±0.96 1.30±0.02 175.27±1.19 3.93±0.07 13.32±0.09 0.29±0.002 Ctrl 57.19±0.39 46.23±0.96 1.29±0.02 173.02±1.19 3.91±0.07 13.15±0.09 0.29±0.002 Ctrl+ENZ 57.77±0.39 46.33±0.96 1.30±0.02 174.76±1.19 3.93±0.07 13.28±0.09 0.29±0.002
p value 0.323 0.253 0.145 0.144 0.089 0.456 0.399
*Means (± standard error) within each column (dietary treatments) with no common superscript significantly differ at p≤0.05. Means (± standard error) within each column of dietary
Table 5 – Performance of 22- to 42-day-old broilers fed diets containing the different levels of olive pulp (processed and
non-processed), and supplemented or not with enzymes*
Trait
Treatment
Feed intake (g/day)
Weight gain
(g/day) Feed Efficiency
Energy Intake (kcal/day)
Energy Efficiency (kcal/g)
Protein Intake (g/day)
Protein Efficiency (g/g) Finishing period age (22nd-42nd days of age)
ENZ No 175.21±2.28 82.97±1.70 2.19±0.05 551.92±7.18 6.91±0.16 36.79±0.47 0.46±0.01 Yes 170.81±2.28 79.82±1.70 2.26±0.05 538.05±7.18 7.13±0.16 35.87±0.47 0.47±0.01
p value 0.535 0.067 0.572 0.534 0.058 0.165 0.321
OP 50 171.86±2.28 81.95±1.70 2.20±0.05 541.38±7.18 6.94±0.16 36.09±0.47 0.46±0.01 100 174.15±2.28 80.84±1.70 2.25±0.05 548.59±7.18 7.10±0.16 36.57±0.47 0.47±0.01
p value 0.589 0.756 0.345 0.147 0.453 0.789 0.351
OP p 174.01±2.28 79.38±1.70 2.30b±0.05 548.15±7.18 7.26b±0.16 36.54±0.47 0.48b±0.01 u 172.00±2.28 83.41±1.70 2.15a±0.05 541.82±7.18 6.78a±0.16 36.12±0.47 0.45a±0.01
p value 0.423 0.534 0.005 0.165 0.012 0.416 0.017
50 p 172.11±4.35 80.69±3.27 2.22±0.09 542.15±13.72 7.00±0.29 36.14±0.91 0.46±0.02 50 p+ENZ 171.13±4.35 79.86±3.27 2.29±0.09 539.07±13.72 7.23±0.29 35.93±0.91 0.48±0.02 100 p 178.87±4.35 81.13±3.27 2.27±0.09 563.44±13.72 7.16±0.29 37.56±0.91 0.47±0.02 100 p+ENZ 173.95±4.35 75.83±3.27 2.43±0.09 547.96±13.72 7.66±0.29 36.53±0.91 0.51±0.02 50 u 177.23±4.35 85.94±3.27 2.14±0.09 558.29±13.72 6.76±0.29 37.22±0.91 0.45±0.02 50 u+ENZ 166.99±4.35 81.33±3.27 2.14±0.09 526.02±13.72 6.75±0.29 35.06±0.91 0.45±0.02 100 u 172.63±4.35 84.12±3.27 2.13±0.09 543.79±13.72 6.71±0.29 36.25±0.91 0.44±0.02 100 u+ENZ 171.16±4.35 82.27±3.27 2.18±0.09 539.17±13.72 6.88±0.29 35.94±0.91 0.45±0.02 Ctrl 175.16±4.35 86.42±3.27 2.04±0.09 551.76±13.72 6.43±0.29 36.78±0.91 0.42±0.02 Ctrl+ENZ 171.78±4.35 83.06±3.27 2.10±0.09 541.13±13.72 6.62±0.29 36.07±0.91 0.44±0.02
p value 0.498 0.214 0.239 0.321 0.145 0.321 0.149
*Means (± standard error) within each column (dietary treatments) with no common superscript significantly differ at p≤0.05. Means (± standard error) within each column of dietary
treatments with no different superscript do significantly not differ at p>0.05. ENZ= enzyme blend supplementation; OP= olive pulp; p=processed; u= non-processed; Ctrl=Control diet with no olive pulp inclusion.
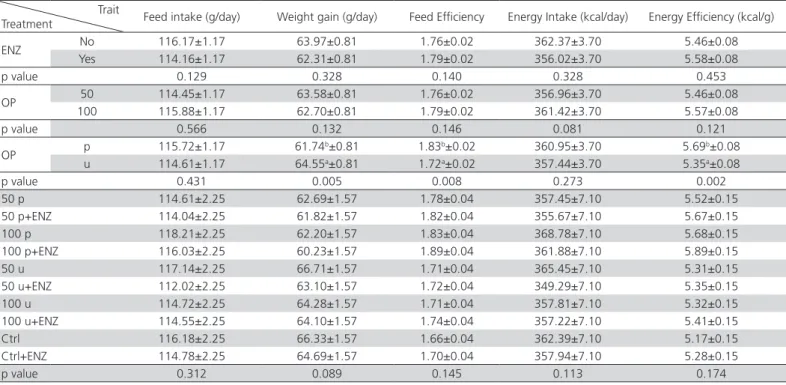
Table 6 – Performance of 1- to 42-day-old broilers fed diets containing the different levels of olive pulp (processed and
non-processed), and supplemented or not with enzymes*
Trait
Treatment Feed intake (g/day) Weight gain (g/day) Feed Efficiency Energy Intake (kcal/day) Energy Efficiency (kcal/g) ENZ No 116.17±1.17 63.97±0.81 1.76±0.02 362.37±3.70 5.46±0.08
Yes 114.16±1.17 62.31±0.81 1.79±0.02 356.02±3.70 5.58±0.08
p value 0.129 0.328 0.140 0.328 0.453
OP 50 114.45±1.17 63.58±0.81 1.76±0.02 356.96±3.70 5.46±0.08 100 115.88±1.17 62.70±0.81 1.79±0.02 361.42±3.70 5.57±0.08
p value 0.566 0.132 0.146 0.081 0.121
OP p 115.72±1.17 61.74b±0.81 1.83b±0.02 360.95±3.70 5.69b±0.08 u 114.61±1.17 64.55a±0.81 1.72a±0.02 357.44±3.70 5.35a±0.08
p value 0.431 0.005 0.008 0.273 0.002
50 p 114.61±2.25 62.69±1.57 1.78±0.04 357.45±7.10 5.52±0.15 50 p+ENZ 114.04±2.25 61.82±1.57 1.82±0.04 355.67±7.10 5.67±0.15 100 p 118.21±2.25 62.20±1.57 1.83±0.04 368.78±7.10 5.68±0.15 100 p+ENZ 116.03±2.25 60.23±1.57 1.89±0.04 361.88±7.10 5.89±0.15 50 u 117.14±2.25 66.71±1.57 1.71±0.04 365.45±7.10 5.31±0.15 50 u+ENZ 112.02±2.25 63.10±1.57 1.72±0.04 349.29±7.10 5.35±0.15 100 u 114.72±2.25 64.28±1.57 1.71±0.04 357.81±7.10 5.32±0.15 100 u+ENZ 114.55±2.25 64.10±1.57 1.74±0.04 357.22±7.10 5.41±0.15 Ctrl 116.18±2.25 66.33±1.57 1.66±0.04 362.39±7.10 5.17±0.15 Ctrl+ENZ 114.78±2.25 64.69±1.57 1.70±0.04 357.94±7.10 5.28±0.15
p value 0.312 0.089 0.145 0.113 0.174
*Means (± standard error) within each column (dietary treatments) with no common superscript significantly differ at p≤0.05. Means (± standard error) within each column of dietary
Table 7 – Performance and economic parameters of 1- to 42-day-old broilers fed diets containing the different levels of olive
pulp (processed and non-processed), and supplemented or not with enzymes*
Trait
Treatment Protein Intake (g/day) Protein Efficiency (g/g) Final weight (g) Feed cost (Rial/kg) Production index
ENZ No 24.96±0.24 0.38±0.009 2,735±34 24,436±222 371.13±9.08 Yes 24.54±0.24 0.39±0.009 2,666±34 24,661±222 355.07±9.08
p value 0.455 0.112 0.078 0.156 0.056
OP 50 24.60±0.24 0.38±0.009 2,719±34 24,053
a±222 369.00±9.08
100 24.91±0.24 0.39±0.009 2,682±34 25,043b±222 357.20±9.08
p value 0.145 0.798 0.354 0.035 0.233
OP p 24.87±0.24 0.39
b±0.009 2,642±34 24,709±222 344.28±9.08
u 24.64±0.24 0.37a±0.009 2,759±34 24,388±222 381.92±9.08
p value 0.127 0.018 0.141 0.162 0.410
50 p 24.64±0.47 0.38±0.10 2,683±66 24,060ab±412 359.36±17.41
50 p+ENZ 24.51±0.47 0.39±0.10 2,646±66 24,299ab±412 346.06±17.41
100 p 25.40±0.47 0.39±0.10 2,660±66 25,054ab±412 345.83±17.41
100 p+ENZ 24.94±0.47 0.41±0.10 2,578±66 25,423b±412 325.88±17.41
50 u 25.17±0.47 0.37±0.10 2,850±66 23,801ab±412 397.71±17.41
50 u+ENZ 24.09±0.47 0.37±0.10 2,698±66 24,054ab±412 372.87±17.41
100 u 24.66±0.47 0.37±0.10 2,748±66 24,829ab±412 381.63±17.41
100 u+ENZ 24.63±0.47 0.37±0.10 2,742±66 24,867ab±412 375.46±17.41
Ctrl 24.97±0.47 0.36±0.10 2,836±66 23,059a±412 404.91±17.41
Ctrl+ENZ 24.68±0.47 0.37±0.10 2,766±66 23,378ab±412 387.46±17.41
p value 0.356 0.412 0.335 0.045 0.137
*Means (± standard error) within each column (dietary treatments) with no common superscript significantly differ at p≤0.05. Means (± standard error) within each column of dietary
treatments with no different superscript do significantly not differ at p>0.05. ENZ= enzyme blend supplementation; OP= olive pulp; p=processed; u= non-processed; Ctrl=Control diet with no olive pulp inclusion.
Table 8 – Interaction between the variables (p values)*
Starter period (1-21 days of age)
Interaction intake Feed Weight gain Feed Efficiency Energy Intake Energy Efficiency Protein Intake Efficiency Protein
OP x ENZ 0.27 0.36 0.15 0.74 0.55 0.64 0.17
OP x PROC 0.08 0.89 0.18 0.91 0.56 0.85 0.19
ENZ x PROC 0.07 0.73 0.69 0.38 0.71 0.36 0.64
OP x ENZ x PROC 0.65 0.48 0.36 0.28 0.45 0.74 0.56
Finisher period (22-42 days of age)
Feed
intake Weight gain Feed Efficiency Energy Intake Energy Efficiency
Protein Intake
Protein Efficiency
OP x ENZ 0.14 0.52 0.44 0.56 0.45 0.43 0.09
OP x PROC 0.12 0.63 0.36 0.45 0.25 0.18 0.45
ENZ x PROC 0.72 0.36 0.34 0.36 0.32 0.24 0.32
OP x ENZ x PROC 0.44 0.45 0.48 0.33 0.65 0.26 0.22
Total period (1-42 days of age)
Feed
intake Weight gain Feed Efficiency
Energy Intake
Energy Efficiency
Protein Intake
Protein Efficiency
Final
weight Feed cost
Production index OP x ENZ 0.18 0.19 0.10 0.78 0.77 0.36 0.56 0.34 0.63 0.65 OP x PROC 0.16 0.44 0.25 0.56 0.14 0.35 0.45 0.15 0.14 0.78 ENZ x PROC 0.45 0.39 0.36 0.42 0.09 0.34 0.65 0.22 0.23 0.45 OP x ENZ x PROC 0.43 0.11 0.34 0.32 0.25 0.21 0.61 0.14 0.44 0.66
CONCLUSION
The dietary inclusion of processed olive pulp improved broiler feed efficiency and energy efficiency during the experimental period. The dietary supplementation of the enzyme blend did not influence any of the studied variables. The dietary inclusion of olive pulp at levels of up to 100g/kg does not have deleterious effects on broiler productive performance.
ACKNOWLEDGEMENTS
This manuscript is prepared from the MSc thesis of the first author at the Islamic Azad University, Rasht Branch, Rasht, Iran. We are grateful to the Islamic Azad University, Rasht Branch, Rasht, Iran and to the Research Support Foundation of the State of Minas Gerais, Brazil (FAPEMIG) for their support.
REFERENCES
Abo Omar JM. The effect of different levels of olive pulp on the feed intake and digestibility of broilers. Bethlehn University Journal 2000;19:97-100.
Abo Omar JM, Ottoman RA, Abu Baker BM, Zaazaa A. Response of broiler chicks to a high olive pulp diet supplemented with two antibiotics. Dirasat, Agriculture Sciences 2003;30:137-142.
Afsari M, Mohebbifar A, Torki M. Effects of phytase supplementation of low phosphorous diets included olive pulp and date pits on productive performance of laying hens, egg quality traits and some blood. Parameters Annual Review & Research in Biology 2013;3(4):777-793.
Al-harthi MA. The chemical composition and nutrient profiles and energy values of olive cake for poultry diets. Life Science Journal 2014;11(9):159-165.
AOAC - Association of Official Analytical Chemists. official methods of analysis of the association of official analytical chemists. 15th ed. Arlington; 1990.
Araújo WAG, Albino LFT, Rostagno HS, Hannas MI, Pessoa GBS, Messias RKG, et al. Sunflower meal and enzyme supplementation of the diet of 21- to 42-d-old broilers. Brazilian Journal of Poultry Science 2014;16:17-24.
Aviagen. Ross broiler management manual; 2009.
Behnke KC, Beyer RS. Effect of feed processing on broiler performance. Proceedings of the 8th International Seminar on Poultry Production and Pathology; 2002; Santiago. Chile. p.21-25.
Benavente-Garcia O, Castillo J, Lorente J, Ortuno A, Del Rio JA. Antioxidant activity of phenolics extracted from Olea europaea L. leaves. Food Chemistry 2000;68:457-462.
Cardoso SM, Ferreira JA, Mafra I, Silva AMS, Coimbra MA. Structural ripening-related changes of the arabinan-rich pectic polysaccharides
from olive pulp cell walls. Journal of Agricultural and Food Chemistry 2007; 55(17):7124–7130.
Choct M. Enzymes for the feed industry:past, present and future. World’s Poultry Science Journal 2006;62(1):5-16.
Clodoveo ML. Malaxation: Influence on virgin olive oil quality. Past, present and future – An overview. Trends in Food Science & Technology 2012;25(1):13–23.
El Hachemi A, El Mecherfi KE, Benzineb K, Saidi D, Kheroua O. Supplementation of olive mill wastes in broiler chicken feeding. African Journal of Biotechnology 2007;6:1848-1853.
García-ayuso LE, Luque de Castro MD. A multivariate study of the performance of a microwave-assisted Soxhlet extractor for olive seeds. Analytica Chimica Acta 1999;382:309-316.
Lavelli V, Bondesan L. Secoiridoids, tocopherols, and antioxidant activity of monovarietal extra virgin olive oils extracted from destoned fruits. Journal of Agricultural and Food Chemistry 2005;53(4):1102–1107.
Porto WS, Carvalho CGP, Pinto RJB. Evaluation of sunflowers cultivars for central Brazil. Scientia Agricola 2008;65:139-144.
Rabayaa E, Abo Omar JM, Othman RA. Utilization of olive pulp in broiler rations. An-Najah University Journal Research 2001;15:133-144.
Reis A, Coimbra MA, Domingues P, Ferrer-Correia AJ, Rosário M, Domingues M.Structural characterisation of underivatised olive pulp xylo‐oligosaccharides by mass spectrometry using matrix‐assisted laser desorption/ionisation and electrospray ionisation. Rapid Communications in Mass Spectrometry 2002;16(22):2124-2132.
Ryan D, Antolovich M, Prenzler P, Robards K, Lavee S. Biotransformations of phenolic compounds in Olea europaea L. Scientia Horticulturae 2002;92:147-176.
Sas Program. User guide for personal computer. Cary: SAS Institute; 2002.
Servili M. Contribution of phenolic compounds to virgin olive oil quality. European Journal of Lipids Science and Technology 2002;104:602-613.
Van Soest PJ, Robertson JB, Lewis BA. Methods for dietary fiber, neutral detergent fiber, and nonstarch polysaccharides in relation to animal nutrition. Journal of Dairy Science 1991;74:3583-3597.
Yorulmaz A, Tekin A, Turan S. Improving olive oil quality with double protection: Destoning and malaxation in nitrogen atmosphere. European Journal of Lipid Science and Technology 2011;113:637-643.
Zangeneh S, Torki M. Effects of β-mannanase supplementing of olive pulp-included diet on performance of laying hens, egg quality characteristics, humoral and cellular immune response and blood parameters. Global Veterinary 2011;7:391-398.
Zarei M, Ehsani M, Torki M. Productive performance of laying hens fed wheat-based diets included olive pulp with or without a commercial enzyme product. African Journal of Biotechnology 2011;10:4303-4312.
Zlatica P, Škrbić Z, Lukić M, Petričević V, Trenkovski S. The effect of genotype