• Nenhum resultado encontrado

Nutritional Balance of Broilers Fed Diets Containing Two Calcium Levels and Supplemented with Different Phytase Levels

N/A
N/A
Protected

Academic year: 2019

Share "Nutritional Balance of Broilers Fed Diets Containing Two Calcium Levels and Supplemented with Different Phytase Levels"

Copied!
12
0
0

Texto

(1)

Supplemented with Different Phytase Levels

Author(s)

Donato DCZI

Ribeiro P de API

Magalhães JDI

Polycarpo G do VI

Garcia PDSRI

Burbarelli MF de CI

Albuquerque R deI

I Departamento de Nutrição e Produção

Animal – FMVZ/USP.

Study funded by FAPESP

Mail Adress

Corresponding author e-mail address Ricardo Albuquerque

Email: ricalbuq@usp.br

Keywords

Enzymes, calcium, broilers.

Submitted: November/2012 Approved: April/2013

ABSTRACT

The objective of this study was to evaluate the effect of diets containing different calcium and phytase levels on the nutritional balance of broilers.A total of 108 male AG Ross 308 broilers were used in each of the replicates phases used in the study: starter (1-21 days), grower (29-35 days) and finisher (36-42 days). A completely randomized experimental design in a 3 x 2 factorial arrangement, with three phytase levels (0, 600 or 1200 FTU/kg) and two calcium levels (0.94 and 0.66%; 0.84 and 0.59%; e 0.78 and 0.54% in the starter, grower, and finisher phases, respectively), totaling six treatments with six replicates each.The experimental feeds also contained reduced available phosphorus levels and minimum crude protein level.The method of total excreta collection was applied to determine dry matter, nitrogen, gross energy, calcium, and phosphorus nutritional balance.Reducing dietary calcium levels to 0.66, 0.59, and 0.54%, and using 0.27, 0.22, and 0.20% available phosphorus, 18.50, 17.50, and 16.00% crude protein, and 600 FTU phytase/kg in the diets of the starter, grower, and finisher phases, respectively, allow higher nitrogen, phosphorus, and calcium retention in broilers.During the grower phase, there was positive linear effect of increasing phytase levels in high-calcium diets on AMEn utilization, and the optimal phytase levels for low-calcium diets was 598.71 FTU/kg.In the finisher phase, the best AMEn utilization was obtained with the high-calcium diets.

INTRODUCTION

Aiming at reducing production costs and the impacts of animal production waste on the environment, research has focused on improving the efficiency of feed utilization.One strategy to reduce the excretion of pollutant compounds is to increase the nutritional availability of feeds by the dietary supplementation of exogenous enzymes (Nahm, 2002). Phytase, for instance, allows reducing inorganic phosphorus supplementation and increasing phytic acid utilization by the birds, thereby reducing phosphorus excretion with no effect on live performance.

Phytase has been widely used in broiler feeds to partially release phosphorus, calcium, and other minerals that are bound as phytate

in feedstuffs. According to Borges et al. (1997), phytase increases

phosphorus availability in approximately 50%, and reduces its fecal and urinary excretion in similar proportions. Recent studies demonstrated that dietary nutrient levels can be reduced, while maintaining broiler

performance and minimizing the excretion of some elements (Silva et

al., 2006; Silva et al., 2008; Gomide et al., 2007; Nagata, 2006; Nagata

(2)

Therefore, the aim of the present study was to evaluate the effect of two calcium levels in diets supplemented with three phytase levels on nutrient metabolizability and excretion, as well as to determined AMEn during the starter (1-21 days), grower (29-35 days), and finisher (36-42 days) phases.

MATERIALS AND METHODS

Three metabolism assays were performed at the experimental poultry house of the Department of Animal Nutrition and Production of FMVZ, USP, Brazil. A number of 108 male AG Ross 308 broilers was used in each rearing phase (starter, grower, and finisher). Broilers were reared until 15, 29, and 36 days, respectively, in a masonry broilers house on wood-shavings litter, where they were fed the experimental diets. At the above-mentioned ages, birds were transferred to battery cages, under a lighting regime of 24h continuous light. Cages were made of stainless

steel and equipped with trough feeders, nipple drinkers, and collection trays.

A completely randomized experimental design in a 3 x 2 factorial arrangement, with three phytase levels (0, 600 or 1200 FTU/kg) and two calcium levels (0.94 and 0.66%; 0.84 and 0.59%; e 0.78 and 0.54% in the starter, grower, and finisher phases, respectively) was applied.

Diets contained equal nutrient levels in each rearing phase, except for calcium levels, were based on corn and soybean meal, and were formulated according

to the recommendations of Rostagno et al. (2005).

In all feeds, available phosphorus levels were reduced in 30% in the different phases (Tables 1, 2, and 3). Calcium and phytase levels were adjusted by increasing or reducing limestone and enzyme levels at the expense of inert material (kaolin). The phytase product was derived from fermentation of a non-pathogenic strain

of Aspergillusniger.

Table 1 – Ingredient and nutritional composition of the experimental diets (starter phase: from 1 to 21 days of age).

Ingredients, % High Calcium Low Calcium

FTU 0 FTU 600 FTU 1200 FTU 0 FTU 600 FTU 1200

Corn 69.23 69.22 69.20 69.20 69.29 69.28

Soybean meal 26.56 26.56 26.57 26.57 26.55 26.55

Soybean Oil 0.02 0.03 0.03 0.03 0.01 0.01

Salt 0.52 0.52 0.52 0.52 0.52 0.52

Dicalcium Phosphate 0.89 0.89 0.89 0.89 0.89 0.89

Limestone 1.67 1.67 1.67 0.93 0.93 0.93

DL-Methionine 99% 0.33 0.33 0.33 0.33 0.33 0.33

L-Lysine HCl 0.38 0.38 0.38 0.38 0.38 0.38

L-Threonine 0.17 0.17 0.17 0.17 0.17 0.17

Choline Chloride 0.03 0.03 0.03 0.03 0.03 0.03

Premix Min-Vit1 0.20 0.20 0.20 0.20 0.20 0.20

Inert material - - - 0.75 0.70 0.70

Phytase - 0.006 0.012 - 0.006 0.012

TOTAL 100 100 100 100 100 100

Nutrients2 Calculated Composition

AMEn (kcal/kg) 2983 2983 2983 2983 2983 2983

CP (%) 18.50 18.50 18.50 18.50 18.50 18.50

Calcium (%) 0.94 0.94 0.94 0.66 0.66 0.66

Total Phosphorus (%) 0.47 0.47 0.47 0.47 0.47 0.47

Aval. Phosphorus (%) 0.27 0.27 0.27 0.27 0.27 0.27

Sodium (%) 0.22 0.22 0.22 0.22 0.22 0.22

Diges. Lysine (%) 1.20 1.2 1.20 1.20 1.20 1.20

Diges. Met+Cys (%) 0.85 0.85 0.85 0.85 0.85 0.85

Diges. Threonine (%) 0.78 0.78 0.78 0.78 0.78 0.78

Diges.Tryptophan(%) 0.19 0.19 0.19 0.19 0.19 0.19

1Each kg of product supplied: Vitamin A 5,546,000 IU/kg; Iron 24,800 mg; Selenium 150 mg; Vitamin D3 1,339,000 IU/kg; Vitamin K3 944 mg; Vitamin B1 1,005 mg; Vitamin B6

1,245 mg; Pantothenic Acid 5,890 mg; Folic Acid 495 mg; Copper 4,280 mg; Iodine 500 mg; Vitamin B2 2,250 mg; Vitamin B12 6,000 mg; Niacin 15,000 mg; B.H.T. 1,000 mg; Biotin 50 mg; Manganese 33,300 mg; Zinc 25,680 mg; Vitamin E 12,430 IU/kg.

(3)

Table 2 – Ingredient and nutritional composition of the experimental diets (grower phase: from 22 to 35 days of age).

Ingredients, % High Calcium Low Calcium

FTU 0 FTU 600 FTU 1200 FTU 0 FTU 600 FTU 1200

Corn 70.22 70.21 70.20 70.24 70.23 70.21

Soybean meal 24.55 24.55 24.55 24.54 24.54 24.55

Soybean Oil 1.62 1.63 1.63 1.62 1.63 1.63

Salt 0.48 0.48 0.48 0.48 0.48 0.48

Dicalcium Phosphate 0.65 0.65 0.65 0.65 0.65 0.65

Limestone 1.56 1.56 1.56 0.90 0.90 0.90

DL-Methionine 99% 0.27 0.27 0.27 0.27 0.27 0.27

L-Lysine HCl 0.30 0.30 0.30 0.30 0.30 0.30

L-Threonine 0.12 0.12 0.12 0.12 0.12 0.12

Choline Chloride 0.03 0.03 0.03 0.03 0.03 0.03

Premix Min-Vit1 0.20 0.20 0.20 0.20 0.20 0.20

Inert material - - - 0.65 0.65 0.65

Phytase - 0.006 0.012 - 0.006 0.012

TOTAL 100 100 100 100 100 100

Nutrients2 Calculated Composition

AMEn (kcal/kg) 3103 3103 3103 3103 3103 3103

CP (%) 17.50 17.50 17.50 17.50 17.50 17.50

Calcium (%) 0.84 0.84 0.84 0.59 0.59 0.59

Total Phosphorus(%) 0.42 0.42 0.42 0.42 0.42 0.42

Aval. Phosphorus(%) 0.22 0.22 0.22 0.22 0.22 0.22

Sodium (%) 0.21 0.21 0.21 0.21 0.21 0.21

Diges. Lysine (%) 1.07 1.07 1.07 1.07 1.07 1.07

Diges. Met+Cys (%) 0.77 0.77 0.77 0.77 0.77 0.77

Diges. Threonine (%) 0.70 0.70 0.70 0.70 0.70 0.70

Diges.Tryptophan(%) 0.18 0.18 0.18 0.18 0.18 0.18

1Each kg of product supplied: Vitamin A 5,546,000 IU/kg; Iron 24,800 mg; Selenium 150 mg; Vitamin D3 1,339,000 IU/kg; Vitamin K3 944 mg; Vitamin B1 1,005 mg; Vitamin B6

1,245 mg; Pantothenic Acid 5,890 mg; Folic Acid 495 mg; Copper 4,280 mg; Iodine 500 mg; Vitamin B2 2,250 mg; Vitamin B12 6,000 mg; Niacin 15,000 mg; B.H.T. 1,000 mg; Biotin 50 mg; Manganese 33,300 mg; Zinc 25,680 mg; Vitamin E 12,430 IU/kg.

2 Considering amino acids CP and AMEn.

Table 3 – Ingredient and nutritional composition of the experimental diets (finisher phase: from 36 to 42 days of age).

Ingredients, % High Calcium Low Calcium

FTU 0 FTU 600 FTU 1200 FTU 0 FTU 600 FTU 1200

Corn 73.75 73.75 73.74 73.76 73.75 73.74

Soybean meal 20.27 20.27 20.27 20.26 20.27 20.27

Soybean oil 2.42 2.42 2.42 2.42 2.42 2.42

Salt 0.45 0.45 0.45 0.45 0.45 0.45

Dicalcium Phosphate 0.55 0.55 0.55 0.55 0.55 0.55

Limestone 1.48 1.48 1.48 0.88 0.88 0.88

Methionine 0.29 0.29 0.29 0.29 0.29 0.29

Lysine 0.38 0.38 0.38 0.38 0.38 0.38

Threonine 0.16 0.16 0.16 0.16 0.16 0.16

Tryptophan 0.02 0.02 0.02 0.02 0.02 0.02

Choline 0.03 0.03 0.03 0.03 0.03 0.03

Premix Min-Vit1 0.20 0.20 0.20 0.20 0.20 0.20

Inert material - - - 0.60 0.60 0.60

Phytase - 0.006 0.012 - 0.006 0.012

TOTAL 100 100 100 100 100 100

Nutrients2 Calculated Composition

AMEn (kcal/kg) 3203 3203 3203 3203 3203 3203

CP (%) 16.00 16.00 16.00 16.00 16.00 16.00

Calcium (%) 0.78 0.78 0.78 0.54 0.54 0.54

Total Phosphorus(%) 0.39 0.39 0.39 0.39 0.39 0.39

Aval. Phosphorus(%) 0.20 0.20 0.20 0.20 0.20 0.20

Sodium (%) 0.20 0.20 0.20 0.20 0.20 0.20

Diges. Lysine (%) 1.05 1.05 1.05 1.05 1.05 1.05

Diges. Met+Cys (%) 0.76 0.76 0.76 0.76 0.76 0.76

Diges. Threonine (%) 0.68 0.68 0.68 0.68 0.68 0.68

Diges.Tryptophan(%) 0.18 0.18 0.18 0.18 0.18 0.18

1Each kg of product supplied: Manganese 33,300 mg; Vitamin B6 623 mg; Niacin 7,500 mg; B.H.T. 1,000 mg; Vitamin B12 3,000 mg; Pantothenic Acid 2,940 mg; Biotin 15 mg; Iodine

500 mg; Folic Acid 153 mg; Vitamin K3 464 mg; Zinc 25,680 mg; Selenium 150 mg; Vitamin A 2,726,000 IU/kg; Vitamin D3 658,300 IU/kg; Vitamin E 4,990 IU/kg; Vitamin B1 502 mg; Iron 24,800 mg; Copper 4,280 mg; Vitamin B2 1,125 mg.

(4)

Water and feed were offered ad libitum. A lighting regime of 24 hours of light was adopted.

The metabolism assay included four days of adaptation and three days of total excreta collection

(Rodrigues et al., 2005). At the end of the each

metabolism assay, excreta were homogenized, weighed, an aliquot was dried in a forced-ventilation

oven at 55oC until constant weight, ground, and

prepared for analyses.

The analyses were carried out at the Chemical Analyses Laboratory of VNP and at CPPSE Embrapa. Gross energy in the feed and excreta samples was determined in a calorimetric bomb (Ika-Werke C5000). Nitrogen levels were determined according to the method of Kjeldahl. Calcium and phosphorus levels were determined by atomic absorption spectrophotometry. Feed AMEn values were calculated using the equations described by Matterson et al. (1965).

Metabolism parameter data were analyzed by the PROC MEANS procedures of the software program Statistical Analysis System, version 9.1.3 (SAS, 1995). As recommended by Banzatto & Kronka (2006), the variables expressed as percentage were submitted to arcsin root transformation, and then to analysis of variance and multiple comparison procedure. However, as there were no differences between transformed and raw data, the raw data are presented.

When there was significant effect (p≤0.05) of calcium levels only, the Student’s t-test was used to compared the means when there was a significant effect (p≤0.05) of phytase levels, regression analyses were performed using the most significant complex model (linear or quadratic), independently of calcium levels. When interactions were significant (P≤0.05), details of the interactions were submitted to the F test,

and when required, analyses of regression of the effects of phytase within each calcium level were performed.

RESULTS AND DISCUSSION

Treatments did not influence energy utilization by the broilers during the starter phase (Table 4).There was a linear effect of phytase levels on apparent metabolizable energy corrected for nitrogen balance (AMEn) during the grower phase when the diets contained high calcium level (p<0.01): the highest phytase inclusion level, the highest the AMEn level obtained (Table 5).During the same period, there was a quadratic effect of phytase inclusion (p<0.01) when the low-calcium diets were fed. Based on the first derivative of the quadratic equation, an optimal phytase level of 598.71 FTU/kg was calculated, which promoted the highest AMEn value when low calcium was fed during the grower phase. During the finisher phase, only calcium levels affected AMEn values (p<0.05), with the broilers fed the high-calcium diet presenting the highest AMEn values. The optimal phytase level calculated from the equation was 785 FTU/kg.

Silva et al. (2008) reported high AMEn values in

feeds containing low crude protein (CP) and available phosphorus (AvP) levels, suggesting that supplementing broiler feeds with phytase and synthetic amino acids allows reducing dietary CP, AvP, and Ca levels and improving dietary energy levels.

Namkung & Leeson (1999) and Ravindran et al.

(2001), obtained improvements of 1.0 and 2.3% in AMEn energy values in 1- to 25-d-old and 1- to 28-d-old broilers, respectively, with the addition of phytase to the feeds. Santos (2008) verified that broilers fed diets

Table 4 – Apparent metabolizable energy corrected for nitrogen (AMEn, kcal/kg) values of diets containing three calcium levels and three phytase levels (FTU/kg) fed to broilers during the starter, grower, and finisher phases.

Phase

Experimental diet p-value

High calcium Low calcium

Mean CV

Phytase Ca*phytase

FTU 0 FTU 600

FTU

1200 FTU 0 FTU 600

FTU

1200 CaFCR Linear Quad. Linear Quad.

Starter 3155 3155 3110 3193 3074 3118 3134 3.88 0.744 0.108 0.944 0.464 0.678

Grower 3272 3317 3388 3247 3386 3241 3308 2.42 0.603 0.003 0.009 0.315 0.250

Finisher 3051 3401 3318 3185 3163 3293 3235 4.26 0.001 0.359 0.062 0.591 0.563

Table 5 – Equations of regression of apparent metabolizable energy corrected for nitrogen (AMEn, kcal/kg) of diets containing three calcium levels and three phytase levels (FTU/kg) fed to broilers during the starter, grower, and finisher phases.

Phase Regression equation p-value R2 Regression equation p-value R2

High calcium Low calcium

Grower Y = 3267.04 + 0.0974X 0.018 0.31 Y = 3246.91+ 0.467X - 0.00039X2 0.004 0.43

(5)

-with reduced calcium and available phosphorus levels and phytase addition presented adequate AMEn levels, which were not different or even higher compared with the control treatment that contained the nutritional levels recommended by Rostagno et al. (2005).

Rocha et al. (2006) did not find any AMEn

differences when phytase was supplemented to diets with reduced Ca and AvP levels, demonstrating the positive effect of the enzyme when AvP was reduced up to 0.35% in the diet of 1- to 7-d-old broilers.

There were significant effects of the treatments on nitrogen intake (N Int) during the three rearing phases (Tables 6 and 7). In the starter phase, there were interactions in the quadratic model (p<0.01) between calcium and phytase levels both for high and low calcium levels. Considering the three evaluated phytase levels, birds fed low-calcium diets presented higher

nitrogen intake than those fed the high-calcium diet, and for both calcium levels, nitrogen intake increased with increasing phytase levels.

There was a linear interaction between calcium and phytase levels (p<0.01) during the grower phase. In the finisher phase, there was a quadratic effect (p<0.01) for phytase levels, with increasing N Int as phytase level increased in the high-calcium diets, and the opposite effect when the low-calcium diets were fed. As to calcium levels, broilers fed the high-calcium diets presented higher N Int. Silva et al. (2008) reported that nitrogen intake was reduced when broilers were fed reduced CP, AvP, and Ca diets supplemented with phytase.

Nitrogen excretion (N Exc) results and equations are shown in Tables 8 and 9, respectively. There were linear responses in the starter (p<0.05) and in the grower

Table 6 – Nitrogen intake (mg/bird/d) of broilers fed diets containing two calcium levels and three phytase levels (FTU/kg) during the starter, grower, and finisher phases.

Phase

Experimental diet

Mean CV

p-value

High calcium Low calcium Phytase Ca*phytase

FTU 0 FTU 600

FTU 1200

FTU 0

FTU 600

FTU

1200 Ca Linear Quad. Linear Quad.

Starter 2915 3203 3366 3005 3378 3893 3293 10.63 0.002 0.069 0.225 0.563 0.008 Grower 4599 4554 3727 4276 4511 4462 4355 6.63 0.043 0.017 0.010 0.001 0.590 Finisher 4727 5260 5313 5152 4925 4854 5039 6.20 0.036 0.391 0.001 0.255 0.508

Table 7 – Regression equation of nitrogen intake (mg/bird/d) of broilers fed diets containing two calcium levels and three phytase levels (FTU/kg) during the starter, grower, and finisher phases.

Phase Regression equation p-value R2 Regression equation p-value R2

High calcium Low calcium

Starter Y = 2935.61 + 0.375X 0.044 0.24 Y = 2981.44 + 0.74X 0.004 0.57

Grower Y = 4728.97 – 0.726X <0.001 0.60 - -

-Finisher Y = 4806.94 + 0.488X 0.008 0.47 - -

-Table 8 – Nitrogen excretion (mg/bird/d) of broilers fed diets containing two calcium levels and three phytase levels (FTU/kg) during the starter, grower, and finisher phases.

Phase

Experimental diet

Mean CV

p-value

High calcium Low calcium Phytase Ca*phytase

FTU 0 FIT 600 FIT

1200 FIT 0 FIT 600 FIT

1200 Ca Linear Quad. Linear Quad.

Starter 1090 1144 1310 992 1267 1307 1185 17.81 0.063 0.024 0.712 0.397 0.397 Grower 1493 1814 1438 1688 1498 1616 1591 11.91 0.292 0.009 0.200 0.291 0.633 Finisher 1940 1850 1886 1921 1984 2056 1939 12.63 0.821 0.713 0.342 0.854 0.208

Table 9 – Equations of regression of nitrogen excretion (mg/bird/d) of broilers fed diets containing two calcium levels and three phytase levels (FTU/kg) during the starter and grower phases.

Phase Regression equation p-value R2 Regression equation p-value R2

High calcium Low calcium

Starter - - - Y = 1031.25 + 0.262X 0.033 0.25

(6)

-(p<0.01) phases for phytase levels. Opposite to the expectations, increasing phytase levels determined increasing N Exc. Also, during the grower phase, the quadratic equation best explained the results obtained with the high-calcium diets, estimating an optimal level of 611 FTU/kg of dietary phytase supplementation. No effects of treatments (p > 0.05) on nitrogen excretion in the finisher phase.

These results do not agree with the findings of (2006) and Silva et al. (2008) reported a significant decrease in both nitrogen intake and excretion in broilers fed diets with reduced CP and AvP levels

supplemented with phytase. Silva et al. (2006) did

not find any differences in nitrogen excretion when evaluating different CP and AvP levels in diets with phytase in 1- to 21-d-old broilers.

Tables 10 and 11 present the results and the equations, respectively, relative to the coefficient of nitrogen retention (N Ret). Nitrogen retention coefficient in the grower phase was significantly influenced (p<0.01) both by calcium and phytase levels.

The coefficient of nitrogen retention of the broilers fed the high-calcium diets was lower relative to those fed the low-calcium diet. Phytase levels resulted in different quadratic responses, with a concave curve for

the birds fed high calcium levels and a convex curve for those fed the low calcium level. The optimal phytase level in low-calcium diets for nitrogen retention was calculated in 750 FTU/kg, and 791 FTU/kg was estimated for the lowest nitrogen retention when high-calcium diets were fed. Considering that higher nitrogen retention indicates better nitrogen utilization, and consequently, lower nitrogen excretion in the environment, both reducing dietary calcium levels and adding an optimal level of phytase (750 FTU/kg) are favorable.

In the finisher phase, a quadratic effect of phytase (p<0.01) was observed; however, no optimal equation to explain this response was found. It was observed also in the grower phase that different results were obtained with the tested calcium levels: the broilers fed the high-calcium diets presented increasing nitrogen retention with increasing dietary phytase supplementation, whereas those fed the low-calcium diets reduced nitrogen retention as phytase levels increased.

The higher nitrogen retention coefficient in broilers fed reduced crude protein levels may be related to the dietary addition of phytase. Phytic acid may bind

the enzymes trypsin and pepsin (Mroz et al., 1994),

forming phytate-protein or phytate-mineral-protein

Table 10 – Coefficient of nitrogen retention (%) of broilers fed diets containing two calcium levels and three phytase levels (FTU/kg) during the starter, grower, and finisher phases.

Phase

Experimental diet

Mean CV

p-value

High calcium Low calcium Phytase Ca*phytase

FTU 0

FTU 600

FTU

1200 FTU 0 FTU 600

FTU

1200 Ca Linear Quad. Linear Quad.

Starter 62.69 64.31 61.18 66.71 62.57 66.53 64.00 7.61 0.990 0.078 0.598 0.802 0.106 Grower 67.52 60.13 61.71 60.43 66.81 63.86 63.41 5.00 0.007 0.004 0.004 0.073 0.671 Finisher 58.93 64.73 64.36 62.77 59.79 57.65 61.37 6.99 0.231 0.345 0.004 0.463 0.144

Table 11 – Equations of regression of the coefficient of nitrogen retention (%) of broilers fed diets containing two calcium levels and three phytase levels (FTU/kg) during the grower phase.

Phase Regression equation p-value R2 Regression equation p-value R2

High calcium Low calcium

Grower Y= 67.52- 0.019X + 0.000012X2 0.021 0.49 Y = 60.43+ 0.018X - 0.000012X2 0.004 0.51

Table 12 – Phosphorus intake (mg/bird/d) of broilers fed diets containing two calcium levels and three phytase levels (FTU/ kg) during the starter, grower, and finisher phases.

Phase

Experimental diet

Mean CV

p-value

High calcium Low calcium Phytase Ca*phytase

FTU 0 FTU 600

FTU

1200 FTU 0 FTU 600

FTU

1200 Ca Linear Quad. Linear Quad.

Starter 427 376 469 358 493 558 447 10.38 0.011 <0.001 0.003 0.280 0.003

Grower 657 702 590 608 615 469 607 6.78 0.007 0.004 <0.001 0.001 <0.001

(7)

complexes (Ravindran & Bryden, 1997) that may affect dietary protein digestibility. Therefore, the hydrolysis of the phosphorus-protein bond by phytase enhances amino acid digestion and absorption (Ravindran & Bryden, 1997). Camden et al. (2001) reported apparent N retention in broilers increased with the addition of phytase to diets containing reduced AvP and Ca levels. However, the findings of the present study do not agree with those studies, as dietary phytase addition did not have a positive effect on nitrogen retention. Silva et al. (2008) and Ibrahim et al. (1999) also did not obtain any improvements in N utilization in starter broilers supplemented with phytase.

Relative to phosphorus intake, the quadratic model showed an interaction between calcium and phytase levels in the starter (p<0.01) and in the grower (p<0.001) phases, as shown in Table 12. In the finisher phase, only calcium levels significantly affected phosphorus intake.

In the starter phase, there was a quadratic effect of high-calcium diets (Table 13) on phosphorus intake, with an estimated optimal phytase level of 900 FTU/ kg. Phytase level promoted an increasing linear effect on phosphorus intake, i.e., the higher the phytase inclusion level, the higher the intake of phosphorus. In

addition, the broilers fed the low-calcium diet, except for diet that did not contain phytase, presented higher calcium intake than those fed the high-calcium diet.

In the period of 22-35 days of age, there was a quadratic influence of both calcium levels on phosphorus intake, but high-calcium diets had a stronger influence. Using the first derivative of the regression equation, the optimal phytase addition for P Int was 473.68 FTU/kg in the high-calcium diets, where as for the low-calcium diet, the optimal phytase level was estimated in 315.80 FTU/kg.

In the period of 36-42 days of age, broilers fed high-calcium diets had higher phosphorus intake than those supplied with low-calcium diets.

There was no effect of treatments (p>0.05) on phosphorus excretion (P Exc), as shown in Table 14. Different results were obtained by Wyatt & Harker (1995), who observed 12-15% reduction in P excretion when adding phytase to broiler diets. Silva (2004) reported more than 50% reduction in relative P excretion during the starter phase when broilers were fed a diet containing 0.34% available phosphorus

supplemented with 500 FTU/kg feed. Nagata et

al. (2009) obtained 24.7% phosphorus excretion

Table 13 – Equations of regression of phosphorus intake (mg/bird/d) of broilers fed diets containing two calcium levels and three phytase levels (FTU/kg) during the starter and grower phases.

Phase Regression equation p-value R2 Regression equation p-value R2

High calcium Low calcium

Starter Y = 426.83 – 0.204X +0.0002X2 0.011 0.41 Y = 369.97 – 0.166X <0.001 0.79

Grower Y= 656.83+ 0.207X – 0.0002X2 0.009 0.63 Y = 607.33 + 0.142X – 0.0002X2 0.003 0.73

Table 14 – Phosphorus excretion (mg/bird/d) of broilers fed diets containing two calcium levels and three phytase levels (FTU/kg) during the starter, grower, and finisher phases.

Phase

Experimental diet

Mean CV

p-value

High calcium Low calcium Phytase Ca*phytase

FTU 0 FTU 600

FTU

1200 FTU 0 FTU 600

FTU

1200 Ca Linear Quad. Linear Quad.

Starter 201 179 215 206 197 217 203 19.31 0.836 0.423 0.500 0.167 0.443

Grower 360 344 305 370 346 375 350 17.85 0.406 0.228 0.254 0.770 0.283

Finisher 385 394 370 351 337 376 369 16.53 0.279 0.451 0.427 0.856 0.290

Table 15 – Coefficient of phosphorus retention (%) of broilers fed diets containing two calcium levels and three phytase levels (FTU/kg) during the starter, grower, and finisher phases.

Phase

Experimental diet

Mean CV

p-value

High calcium Low calcium Phytase Ca*phytase

FTU 0 F T U 600

F T U 1200 FTU 0

F T U 600

F T U

1200 Ca Linear Quad. Linear Quad.

(8)

reduction in broilers fed diets with reduced CP and AvP levels supplemented with phytase.

Silva et al. (2006) observed that reduced CP

levels, independently of AvP levels, and high CP level associated with reduced AvP level, both associated with phytase supplementation, reduced P excretion.

Gomide (2006) and Silva (2004) reported significant reduction in phosphorus intake and excretion when broilers were fed low crude protein and available phosphorus levels supplemented with phytase compared with the control diet, all of which contained 3000 kcal AMEn/kg.

As shown in Table 15, there was a linear effect of the interaction (p<0.01) between the calcium and phytase levels evaluated in the starter phase for phosphorus retention. Despite the significant effect of treatments, there was no significant regression equation for this parameter or for the curvilinear effect (p<0.01) of the interaction observed in the phase of 22-35 days of age.

In the period of 36-42 days of age, dietary calcium levels influenced (p<0.05) phosphorus retention, with the birds fed the low-calcium level diets presenting higher phosphorus retention coefficient than those supplied with the high-calcium levels.

Silva (2004) reported 11.2% improvement in phosphorus retention when broilers were fed a diet with 0.34% available phosphorus supplemented with 500 FTU/kg in the starter phase.

Fukayama et al. (2008) observed that phytase

supplementation improved phosphorus digestibility in a diet with reduced ME, CP, AvP, and Ca, and a linear increase in phosphorus utilization. The dietary supplementation of 750 and 1,000 FTU/kg of phytase

promoted better digestibility coefficients than those obtained with the diet with reduced ME, CP, AvP, and Ca with no enzyme supplementation. According

to Sebastian et al. (1996), phytase breaks down the

phytate-mineral complex, releasing minerals for absorption, thereby reducing their excretion and increasing their digestibility. However, Oliveira et al. (2008) did not observe any effect of phytase on P retention.

Table 16 shows calcium intake (Ca Int) results and Table 17, the respective regression equations.

In the three studied phases, there was a quadratic interaction (p<0.05) between factors, and in all phases, the broilers fed the high-calcium diet presented higher Ca Int.

In the starter period, Ca Int linearly increased with increasing phytase levels in broilers fed both calcium levels.

In the grower phase, there as a convex quadratic response, with an estimated optima level of phytase addition of 543.75 FTU/kg for the birds fed the high-calcium diet, and an increasing linear response for those fed the low-calcium diet. The same behavior was observed in the finisher phase.

Silva et al. (2008) observed reduced Ca Int when

broiler were fed diets with low CP and AvP levels supplemented with phytase.

Quadratic interactions (p<0.001) between the evaluated factors were also found for calcium excretion (Ca Exc) in the three studied phases (Table 18), but no significant regression equation was obtained.

In all phases, Ca Exc was higher in the birds fed the high-calcium diet. In the starter phase, there was

Table 16 – Calcium intake (mg/bird/d) of broilers fed diets containing two calcium levels and three phytase levels (FTU/kg) during the starter, grower, and finisher phases.

Phase

Experimental diet

Mean CV

p-value

High calcium Low calcium Phytase Ca*phytase

FTU 0 FTU 600

FTU

1200 FTU 0 FTU 600

FTU

1200 Ca Linear Quad. Linear Quad.

Starter 844 943 1235 618 819 1049 918 10.01 <0.001 <0.001 0.193 0.227 0.016 Grower 1337 1568 1094 867 986 998 1142 6.17 <0.001 <0.001 0.134 <0.001 <0.001 Finisher 1247 1507 1466 936 985 1145 1214 6.03 <0.001 0.909 0.296 0.146 <0.001

Table 17 – Equations of regression of calcium intake (mg/bird/d) of broilers fed diets containing two calcium levels and three phytase levels (FTU/kg) during the starter and grower phases.

Phase Regression equation p-value R2 Regression equation p-value R2

High calcium Low calcium

Starter Y = 811.91 + 0.325X <0.001 0.68 Y = 613.08 + 0.359X <0.001 0.87 Grower Y= 1336.83 + 0.972X – 0.0009X2 <0.001 0.89 Y = 884.97 + 0.109X 0.004 0.39

(9)

an increasing curvilinear response in Ca Exc as dietary phytase level increased when broilers were fed the high-calcium diet. There was a concave curvilinear response when broilers were supplied with the low-calcium diet.

In the periods of 22-35 and 36-42 days of age, the birds fed the high-calcium diet presented a convex curvilinear response, where as a decreasing curvilinear response was obtained with increasing phytase levels in the grower phase and a concave curvilinear response in the finisher phase for those fed the low-calcium diet.

Silva et al. (2006) reported that phytase efficiently reduced Ca excretion when associated with low CP and AvP levels or with high CP and low AvP levels.

The findings of Nagata et al.(2009) demonstrated

that reduced dietary CP, AvP, and Ca levels associated with phytase supplementation reduced Ca intake, but not Ca excretion, as previously observed by Silva (2004). The authors attribute these results to the fact that the concentration of phytase in the diet was probably not sufficient to break the phytate-mineral bond and therefore, to release calcium for absorption.

The Table 19 shows the coefficients of calcium retention (CR Ca).Consistent with the calcium intake and excretion results, calcium retention was also

affected by non-linear interactions (p<0.01) in the three studied phases.

In the starter phase, calcium retention in broilers fed both calcium levels linearly increased with increasing phytase levels, and those supplied with the low-calcium level presented higher low-calcium retention than those fed the high-calcium diet. However, a significant regression equation explaining this result was obtained only for those fed the low-calcium diet (Table 20).

In the period of 22-35 days of age, low-calcium levels promoted higher calcium retention than the high Ca levels.

An increasing linear equation described the increasing Ca retention with increasing dietary phytase levels in broilers fed the low Ca level, whereas a convex quadratic equation described the response of those fed the high Ca level, with an estimated optimal phytase level of 500 FTU/kg for the best Ca retention.

Although a quadratic interaction was observed for the period of 36-42 days of age, no equations describing the results were obtained. There was an increasing curvilinear response of the birds fed the high Ca level, and a convex curvilinear response for those fed the low Ca level. The broilers supplied with

Table 18 – Calcium excretion (mg/bird/d) of broilers fed diets containing two calcium levels and three phytase levels (FTU/ kg) during the starter, grower, and finisher phases.

Phase

Experimental diet

Mean CV

p-value

High calcium Low calcium Phytase Ca*phytase

FTU 0 FTU 600

FTU

1200 FTU 0 FTU 600

FTU

1200 Ca Linear Quad. Linear Quad.

Starter 486 524 612 328 309 356 436 20.33 0.002 0.346 0.476 0.149 <0.001

Grower 815 856 761 505 494 491 654 14.45 0.004 0.178 0.980 0.286 <0.001

Finisher 941 1020 973 488 485 596 750 13.16 <0.001 0.537 0.452 0.582 <0.001

Table 19 – Coefficient of calcium retention (%) of broilers fed diets containing two calcium levels and three phytase levels (FTU/kg) during the starter, grower, and finisher phases.

Phase

Experimental diet

Mean CV

p-value

High calcium Low calcium Phytase Ca*phytase

FTU 0 FTU 600

FTU

1200 FTU 0 FTU 600

FTU

1200 Ca Linear Quad. Linear Quad.

Starter 42.91 44.95 50.45 46.87 62.22 66.18 52.26 13.68 0.190 0.001 0.186 0.102 <0.001 Grower 38.92 45.39 30.69 41.90 50.00 50.74 42.94 17.54 0.598 0.292 0.295 0.009 0.009 Finisher 24.58 32.04 33.48 47.89 50.78 47.98 39.46 19.10 0.205 0.488 0.083 0.814 <0.001

Table 20 – Equations of regression of the coefficient of calcium retention (%) of broilers fed diets containing two calcium levels and three phytase levels (FTU/kg) during the grower phase.

Phase Regression equation p-value R2 Regression equation p-value R2

High calcium Low calcium

Starter - - - Y = 48.77 + 0.016 X 0.007 0.51

(10)

the low Ca level presented better calcium retention coefficient compared with those fed the high Ca level.

Oliveira et al. (2008) verified better Ca retention with dietary phytase supplementation, demonstrating the effect of phytate hydrolysis, thereby making Ca more available for absorption. These results are consistent with the findings of Tejedor et al. (2001), Viveros et al. (2002), and Rutherfurd et al. (2004), who worked with non-phytic phosphorus levels ranging between 0.33 and 0.37% and phytase levels of 0, 500, and 750 FTU/ kg diet.

Nagata et al. (2009) obtained lower calcium

retention coefficients with diets with extreme CP levels supplemented with phytase, which were similar to those obtained with the control diet, containing 17% CP, also supplemented with phytase. Silva (2004) also observed a reduction in calcium retention, but only when feeds contained 19.0% CP. That author inferred that phytase was no efficient to improve calcium utilization or perhaps the improvement in calcium digestibility caused changes in Ca:P ratio, which may have caused the lower retention of calcium.

CONCLUSIONS

Reducing dietary calcium levels to 0.66, 0.59, and 0.54%, and using 0.27, 0.22, and 0.20% available phosphorus, 18.50, 17.50, and 16.00% crude protein, and 600 FTU phytase/kg in the diets of the starter, grower, and finisher phases, respectively, allow higher nitrogen, phosphorus, and calcium retention in broilers. Energy utilization is not influenced by dietary calcium or phytase levels in the starter phase. However, in the grower phase, increasing phytase levels improve AMEn utilization, and the best results in the finisher phase were presented by the broilers fed the high calcium level.

REFERENCES

Banzatto DA, Kronka SN. Experimentação agrícola. Jaboticabal: FUNEP; 2006.

Borges FMO, Veloso JAF, Baião NC, Carneiro MIF. Avaliação de fontes de fósforoparafrangos de corteemcrescimento, considerando-se o fósforodisponível. ArquivoBrasileiro deMedicinaVeterinária e Zootecnia 1997;49(5):629-638.

Camden BJ, Morel PCH, Thomas DV, Ravindran V, Bedford MR. Effectiveness of exogenous microbial phytase in improving the bioavailabilities of phosphorus and other nutrients in maize-soya-bean meal diets for broilers. Animal Science 2001;73 (2):289-297.

Fukayama EH, Sakomura NK, Dourado LRB, Neme R, Fernandes JBK, Marcato SM. Efeito da suplementação de fitasesobre o desempenho

e a digestibilidade dos nutrientesemfrangos de corte. Revista Brasileira de Zootecnia 2008;37(4):629-635.

Gomide EM. Planosnutricionaiscom a utilização de aminoácidos e fita separa frangos de corte [dissertação]. Lavras (MG): Universidade Federal de Lavras; 2006.

Gomide EM, Rodrigues PB, Freitas RTF de, Fialho ET. Planosnutricionaiscom a utilização de aminoácidos e fitaseparafrangos de cortemantendo o conceito de proteína ideal nasdietas. Revista Brasileira de Zootecnia 2007;36(6):1769-1774.

Ibrahim S, Jacob JP, Blair R. Phytase supplementation to reduce phosphorus excretion of broilers. Journal of Applied Poultry Research 1999;8(4):414-425.

Martins BAB. Determinação da biodisponibilidade relative do fósforoparafrangos de corteemfarelo de trigo, soja integral tostada e soja integral extrusadacom e semadição de fitasemicrobiana à dieta [dissertação]. Pirassununga (SP): Universidade de São Paulo; 2003.

Matterson LD, Potter LM, Stutuz NW, Singsen EP.The metabolism energy of feed nutrients for chickens [research report 7]. Connecticut: Research Report Agricultural Experiment Station Connecticut; 1965. p.3-11.

Mroz Z, Jongbloed AW, Kemme PA. Apparent digestibility and retention of nutrients bound to phytate complexes as influenced by microbial phytase and feeding regimen in pigs. Journal of Animal Science 1994;72(1):126-132.

Nagata AK. Níveis de energiametabolizável e redução dos níveis de proteina e fósforoemraçõescomfitaseparafrangos de corte: desempenho, digestibilidade e excreção de nutrients [tese]. Lavras (MG): Universidade Federal de Lavras; 2006.

Nagata AK, Rodrigues PB, Rodrigues KF, Freitas RTF, Albino LFT, Fialho ET. Uso do conceito de proteína ideal emrações com diferentesníveisenergéticos, suplementadas com fitaseparafrangos de corte de 1 a 21 dias de idade. Ciência e Agrotecnologia 2009;33(2):599-605.

Nahm KH. Efficient feed nutrient utilization to reduce pollutants in poultry and swine manure.Critical Reviews in Environmental Science and Technology 2002;32(1):1-16.

Namkung H, Leeson S. Effect of phytase enzyme on dietary nitrogen-corrected apparent metabolizable energy and the ileal digestibility of nitrogen and amino acids in broiler chicks. Poultry Science 1999;78(9):1317-1319.

Oliveira MC, Gravena RA, Marques RH, Guandolini GC, Moraes VMB. Utilização de nutrientes em frangos alimentados com dietas suplementadas com fitase e níveis reduzidos de fósforo não-fítico. Arquivo Brasileiro de Medicina Veterinária e Zootecnia 2008;60(2):436-441.

Ravindran V, Bryden WL. Influence of dietary phytic acid and available phosphorus levels on the response of broilers to supplemental natuphos. Resumes of the 7th Short Course on Feed Tecnology; 1997; Ansung, Korea: Korean Society of Animal Nutrition and feedstuffs; 1997.

Ravindran V, Selle PH, Ravindran G, Morel PCH, Kies AK, Bryden WL. Microbial phytase improves performance, apparent metabolizable energy, and ileal amino acid digestibility of broilers fed a lysine deficient diet. Poultry Science 2001;80(3):338-344.

(11)

Rodrigues PB, Martinez RS, Freitas RTF, Bertechini AG, Fialho ET. Influência do tempo de coleta e metodologiassobre a digestibilidade e o valor energetico de raçõesparaaves. Revista Brasileira Zootecnia 2005;34(3):882-889.

Rutherfurd SM, Chung TK, Morel PCH, Moughan PJ. Effect of microbial phytase on ileal digestibility of phytate phosphorus, total phosphorus, and amino acids in a low-phosphorus diet for broilers. Poultry Science 2004;83(1):61-68.

Santos LM dos. Níveis de cálcio e fósforo disponível para frangos de corte recebendo rações com fitas e em diferentesfases de criação [dissertação]. Lavras (MG): Universidade Federal de Lavras; 2008. 105p.

Sebastian S, Touchburn SP, Chavez ER, Laguë PC. The effects of supplemental microbial phytase on the performance and utilization of dietary calcium, phosphorus, cooper and zinc in broilers chickens fed corn-soybean diets. Poultry Science 1996;75(6):729-736.

Silva YL da. Redução dos níveis de proteína e fósforo em rações com fitas e para frangos de corte: desempenho, digestibilidade e excreção de nutrientes [tese]. Lavras: Universidade Federal de Lavras; 2004.

Silva YL, Rodrigues PB, Freitas RTF, Bertechini AG, Fialho ET, Fassani EJ, Pereira CR. Redução de proteína e fósforoemrações com fitaseparafrangos de corte no período de 1 a 21 dias de idade. Desempenho e teores de mineraisnacama. Revista Brasileira de Zootecnia 2006;35(3):840-848.

Silva YL, Rodrigues PB, Freitas RTF, Zangeronimo MC, Fialho ET. Níveis de proteína e fósforoemrações com fitaseparafrangos de corte, nafase de 14 a 21 dias de idade. 2. Valoresenergéticos e digestibilidade de nutrientes. Revista Brasileira de Zootecnia 2008;37(3):469-477.

Statistical Analysis System Institute. SAS user’s guide: basic and statistic. Carry: SAS; 1995.

Tejedor AA, Albino LFT, Rostagno HS, Vieites FM. Efeito da adição da enzimafitasesobre o desempenho e a digestibilidade ileal de nutrientes. RevistaBrasileira de Zootecnia 2001;30(3):802-808.

Viveros A, Brenes A, Arija I, Centeno C. Effects of microbial phytase supplementation on mineral utilization and serum enzyme activities in broiler chiks fed different levels of phosphorus. Poultry Science 2002;81(8):1172-1183.

(12)

Imagem

Table 1 – Ingredient and nutritional composition of the experimental diets (starter phase: from 1 to 21 days of age).
Table 3 – Ingredient and nutritional composition of the experimental diets (finisher phase: from 36 to 42 days of age).
Table 4 – Apparent metabolizable energy corrected for nitrogen (AMEn, kcal/kg) values of diets containing three calcium  levels and three phytase levels (FTU/kg) fed to broilers during the starter, grower, and finisher phases.
Table 8 – Nitrogen excretion (mg/bird/d) of broilers fed diets containing two calcium levels and three phytase levels (FTU/kg)  during the starter, grower, and finisher phases.
+5

Referências

Documentos relacionados

Table 5 – Regression equations of weight gain and feed conversion ratio of broilers fed diets with increasing sunflower meal levels and supplemented or not with an enzyme

The immune response in young broilers supplemented with different levels of zinc oxide and zinc-methionine was evaluated and showed no effects of zinc level or source on the levels

Broiler performance significantly improved in grower phase (weight gain and feed conversion ratio) by enzyme supplementation, while the effect of sunflower meal was evident in

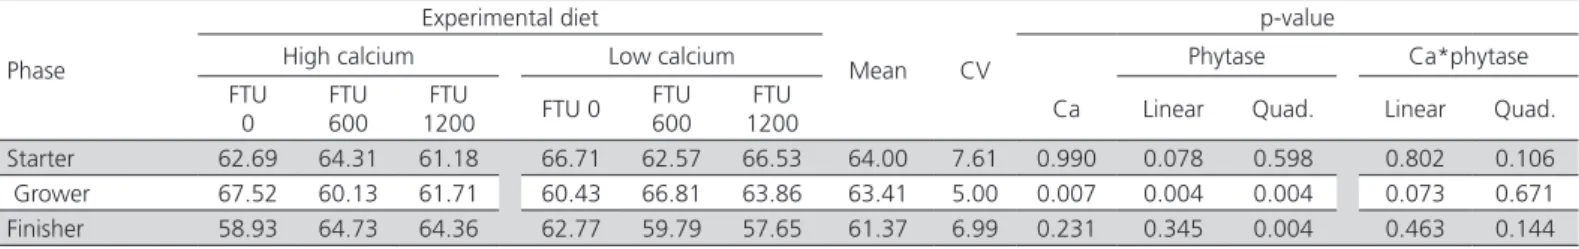
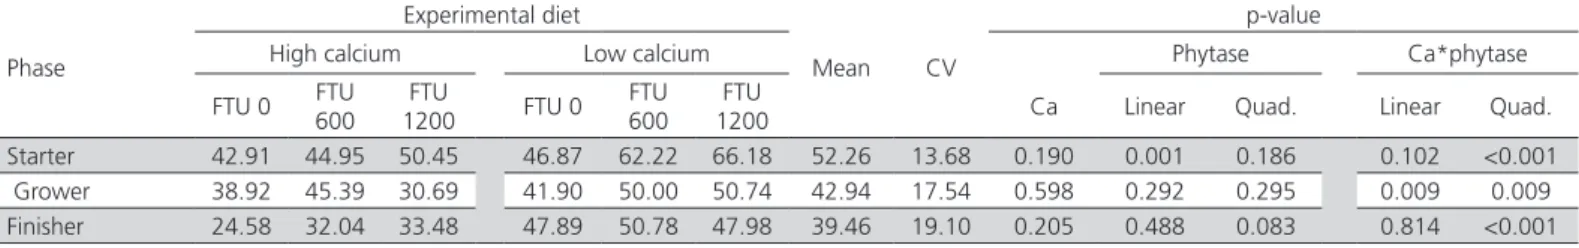
The following orthogonal contrasts were analyzed: contrast C 1 , comparing diets with reduced calcium (Ca) and phosphorus (P) levels supplemented or not with phytase; contrast C 2

The crude protein levels in the diets based on corn and soybean meal (formulated with lysine, methionine and threonine in a digestible basis) for growing pigs should be reduced from

Therefore, the objective of this work was to evaluate the effect of diets with reduced levels of crude protein, available phosphorus, and calcium, supplemented with phytase and

Thus, the objective of this work was to evaluate the effect of diets elaborated with reduced levels of crude protein and phosphorus, supplemented with phytase and

The experimental design was a randomized 2 x 2 x 3 factorial arrangement (two breeds: Morada and Santa Inês; two concentrate supplementation levels: 0.5 and 1.5% of body weight;