www.ccarevista.ufc.br ISSN 1806-6690
Selection of cowpea populations tolerant to water deficit by selection
index
1Seleção de populações de feijão-caupi tolerantes ao déficit hídrico por índice de
seleção
Erina Vitório Rodrigues2, Kaesel Jackson Damasceno-Silva3*, Maurisrael de Moura Rocha3, Edson Alves Bastos3 and Paulo Eduardo Teodoro4
ABSTRACT - The objective of this work was to use different selection criteria to identify cowpea genotypes tolerant to water deficit to be used in recurrent selection programs aiming to reduce the cowpea crop cycle and improve its productive components. Six cowpea genotypes were crossed in a complete diallel scheme. The experiment was conducted in an incomplete block experimental design in a triple lattice arrangement, with the 30 F2 populations of cowpea. The genetic variability of 10 traits was verified, and the following selection criteria were used: direct and indirect selection, classical index, index based on desired gains, and index based on sum of ranks. The number of days to flowering (NDF), number of days to maturity (NDMD), pod weight (PW), grain weight per pod (GWP) and 100-grain weight (100GW) were classified as primary traits, and the others as secondary. The direct selection based on the pod weight was the most efficient criterion to reduce the crop cycle and improve productive components of the cowpea genotypes subjected to water deficit conditions. The genotypes Pingo-de-Ouro-1-2 × MNC99-510F-16-1, CNCx698-128G × MNC99-510F-16-1, MNC99-510F-16-1 × Pingo-de-Ouro-1-2, Pingo-de-Ouro-1-2 × BRS Paraguaçu, Inácio × Pingo-de-Ouro-1-2, BRS Xiquexique × Pingo-de-Ouro-1-2 and Pingo-de-Ouro-1-2 × Santo-Inácio were the most suitable to be used in interpopulation recurrent selection programs aiming to reduce the crop cycle and improve productive components of cowpea grown under water deficit conditions.
Key words: Direct and indirect selection. Interpopulation recurrent selection.Vigna unguiculata L. Walp.
RESUMO - O objetivo desse trabalho foi utilizar diferentes critérios de seleção para identificar genótipos de feijão-caupi
tolerantes ao déficit hídrico, a serem utilizados em programas de seleção recorrente, visando redução do ciclo e incremento nos componentes produtivos. Seis genótipos de feijão-caupi foram cruzados no esquema dialélico completo. Foi conduzido um ensaio em delineamento experimental de blocos incompletos em arranjo do tipo látice triplo para avaliar as 30 populações F2 de feijão-caupi. Após verificar variabilidade genética para 10 caracteres, empregaram-se os seguintes critérios de seleção: seleção direta e indireta, índice clássico, índice baseado nos ganhos desejados e índice baseado em soma deranks. Os caracteres
número de dias para o início de floração (NDIF), número de dias para a maturidade (NDMD), peso da vagem (PV), peso de grãos por vagem (PGV), peso de 100 grãos (PCG) foram considerados como primários, e os demais como secundários. A seleção direta com base no caráter peso de vagem é o critério mais eficiente para reduzir o ciclo e incrementar os componentes produtivos em genótipos de feijão-caupi submetidos ao déficit hídrico. Os genótipos Pingo de Ouro-1-2 x MNC99-510F-16-1, CNCx 698-128G x MNC99-510F-16-MNC99-510F-16-1, MNC99-510F-16-1 x Pingo de Ouro-1-2, Pingo de Ouro-1-2 x BRS Paraguaçu, Santo Inácio x Pingo de Ouro-1-2, BRS Xiquexique x Pingo de Ouro-1-2 e Pingo de Ouro-1-2 x Santo Inácio são os mais indicados para serem utilizados em programas de seleção recorrente interpopulacional, visando redução do ciclo e aumento nos componentes produtivos do feijão-caupi, quando submetido ao déficit hídrico.
Palavras-chave:Seleção direta e indireta. Seleção recorrente interpopulacional.Vigna unguiculata (L.) Walp.
DOI: 10.5935/1806-6690.20170105 * Autor para correspondência
Recebido para publicação em 14/08/2016; aprovado em 28/06/2017
1Parte da Tese de Mestrado do primeiro autor apresentada ao Programa de Pós-Graduação em Genética e Melhoramento, Departamento de Fitotecnia,
Universidade Federal do Piauí, Teresina-PI, Brasil
2Programa de Pós-Graduação em Genética e Melhoramento, Departamento de Fitotecnia, Universidade Federal do Piauí, Teresina-PI, Brasil, erina.
3Embrapa Meio-Norte, Caixa Postal 01, Teresina-PI, Brasil, 64.006-220, [email protected], [email protected],
INTRODUCTION
Cowpea [Vigna unguiculata (L.) Walp] is one of
the most important and strategic food sources in tropical
and subtropical regions of the world (AGBICODOet al.,
2009). Brazil is the third largest world producer of this crop, which is cultivated in the North and Northeast regions of the country and is the basic food of low-income
populations (OLIVEIRAet al., 2013). However, according
to Almeidaet al. (2014), there are frequent supply deficits
in these regions due to the cowpea low national average
yield (300 kg ha-1).
The low yield of cowpea in Brazil is due to several factors, such as the use of unimproved genotypes, the low fertility of the soils and irregular rainfall distribution
(NASCIMENTO et al., 2011). Water deficit is common
in these regions of Brazil and is one of the factors that
reduce the cowpea yield (MENDESet al., 2007). Agbicodo
et al. (2009) point out that the cowpea ‘drought scape’ by
shortening its cycle is one of the main mechanism used by this species to avoid water deficit. Therefore, identifying genotypes with early cycles is one of the most promising strategies to minimize the water deficit in this crop.
Different agronomic traits have been used to investigate the tolerance of cowpea genotypes to water
deficit (BASTOS et al., 2011; NASCIMENTO et al.,
2011). The simultaneous selection of traits increases the chance of success in breeding programs. Selection indexes allow the generation of a genotypic aggregate as an additional trait resulting from the linear combination of traits chosen by the breeder as desirable to perform the simultaneous selection; thus allowing the identification of superior genotypes, regardless of correlations between the traits (CRUZ; REGAZZI; CARNEIRO, 2012).
In this context, the objective of this work was to use different selection criteria to identify cowpea genotypes tolerant to water deficit to be used in intrapopulation recurrent selection programs aiming to reduce the cowpea crop cycle and improve its productive components.
MATERIAL AND METHODS
The experiment was conducted in the experimental area of the Embrapa Meio-Norte, in Teresina PI, Brazil (05° 05’S, 42° 48’W and 74.4 m), from July 26 to October 11, 2011. Teresina has annual average relative humidity of 77.02%, annual average rainfall of 1,388.9 mm, and annual average air temperature of 26.97 ºC (22.08 ºC to 33.52 ºC) (INMET, 2011). The climate of the region is Aw—tropical with wet and dry seasons— according to the Köppen classification. The soil of the experimental area was classified as eutrophic Yellow
Argisol (Ultisol), according to the SiBCS, with sandy loam surface texture.
Six genotypes of cowpea—three cultivars (BRS Paraguaçu, BRS Xiquexique and Santo-Inácio) and three lines (Pingo-de-Ouro-1-2, CNCx698-128G and MNC99-510F-16-1)—were selected based on previous studies
on tolerance to water deficit (BASTOS et al., 2011;
NASCIMENTOet al., 2011) and used as parents (Table
1). These genotypes were crossed in a complete diallel scheme, according to Method 1 of the model proposed
by Griffing (1956). The seeds of the 30 F1hybrids were
seeded to obtain the F2generation.
A water deficit test was conducted to evaluate
the 30 F2 populations of cowpea and their parents.
An incomplete block experimental design in a triple lattice arrangement was used. The experimental plot consisted of six 2-m rows spaced 1.0 m apart with 0.50 m between plants. Irrigation was performed with a fixed conventional system with sprinklers in lateral lines arranged in a spacing of 12 m x 12 m, with pressure of 250 kPa, nozzle diameter of 3.6 mm x 2.6 mm, and flow
rate of 1.19 m3h-1.
Soil moisture was monitored using a capacitance
probe (DIVINER 2000®) with 12 access tubes that were
installed to a depth of 0.70 m and distributed in both tests, with readings at each 0.10 m depth of the soil. The soil water retention curve of the experimental area—0.0 to 0.4 m layer—was determined using the model of Genuchten (1980). The area had field capacity (FC) of
21.2 cm3 cm-3 and permanent wilt point (PWP) of 9.05
cm3 cm-3. The water deficit test (WDT) was conducted
with suspension of irrigation from the pre-flowering at 35 days after sowing (DAS) to the reproductive stage at 49 DAS.
Table 1 -Parents and hybrids of cowpea genotypes evaluated under water deficit conditions
Identification Genotypes
1 BRS Paraguaçu
2 Pingo-de-Ouro-1-2
3 BRS Xiquexique
4 CNCx698-128G
5 Santo-Inácio
6 MNC99-510F-16-1
7 BRS Paraguaçu × Pingo-de-Ouro-1-2
8 BRS Paraguaçu × BRS Xiquexique
9 BRS Paraguaçu × CNCx698-128G
10 BRS Paraguaçu × Santo-Inácio
11 BRS Paraguaçu × MNC99-510F-16-1
12 Pingo-de-Ouro-1-2 × BRS Paraguaçu
13 Pingo-de-Ouro-1-2 × BRS Xiquexique
14 Pingo-de-Ouro-1-2 × CNCx698-128G
15 Pingo-de-Ouro-1-2 × Santo-Inácio
16 Pingo-de-Ouro-1-2 × MNC99-510F-16-1
17 BRS Xiquexique × BRS Paraguaçu
18 BRS Xiquexique × Pingo-de-Ouro-1-2
19 BRS Xiquexique × CNCx698-128G
20 BRS Xiquexique × Santo-Inácio
21 BRS Xiquexique × MNC99-510F-16-1
22 CNC×698-128G × BRS Paraguaçu
23 CNC×698-128G × Pingo-de-Ouro-1-2
24 CNC×698-128G × BRS Xiquexique
25 CNC×698-128G × Santo-Inácio
26 CNC×698-128G × MNC99-510F-16-1
27 Santo-Inácio × BRS Paraguaçu
28 Santo-Inácio × Pingo-de-Ouro-1-2
29 Santo-Inácio × BRS Xiquexique
30 Santo-Inácio × CNCx698-128G
31 Santo-Inácio × MNC99-510F-16-1
32 MNC99-510F-16-1 × BRS Paraguaçu
33 MNC99-510F-16-1 × Pingo-de-Ouro-1-2
34 MNC99-510F-16-1 × BRS Xiquexique
35 MNC99-510F-16-1 × CNCx698-128G
36 MNC99-510F-16-1 × Santo-Inácio
The data obtained for each trait were subjected to
analysis of variance, according to the model: Y
ijk= m +
g
i+ rj + bk(j) + eijk, wherein Yijk is the observed value in
the plot that received the treatmenti in the blockk within
the replicationj; m is the overall mean;g
i is the random
effect of treatmenti (i= 1, 2, ..., 36);rj is the effect of the
replicationj (j= 1, 2 and 3);bk(j) is the effect of the block
k (k = 1, 2, 3, ..., 6) within the replication j; and eijk is
the experimental error of the observation Yijwith ~ NID
for each trait according to the procedures described by Cruz, Regazzi and Carneiro (2012): heritability in the broad sense (h²), genetic standard deviation (SDg), genetic coefficient of variation (CVg) and relative coefficient of variation (CVr).
First, a multicollinearity diagnosis was performed in the matrices of phenotypic (P) and genotypic variance and covariance, in which the number of conditions showed a weak multicollinearity (NC<100). The economic weights and desired gains were established from the experimental data, as recommended by Cruz, Regazzi and Carneiro (2012), to predict the genetic gain in the main traits. The adopted desired gain was equivalent to the genetic standard deviation (SDg), and the adopted economic weights were the genetic coefficient of variation (CVg) estimates. The selection of the best genotypes and estimations of genetic progress were performed with the following methods: direct and indirect selection, classical index (HAZEL, 1943; SMITH, 1936), index based on the desired gains (PESEK; BAKER, 1969) and index based on the sum of ranks (MULAMBA; MOCK, 1978).
The direct and indirect selection is used expecting gains in a single trait, which is focused in the selection, and traits of secondary importance may have favorable or unfavorable responses. The expected gain from the
direct selection in the ith trait was estimated by: GS
i=
DSihi2, being , wherein X
si is the mean of the
selected genotypes for the traiti; X0iis the original mean
of the diallel; DSi is the selection differential practiced
in the diallel; and h2
1 is the heritability of the traiti. The
indirect gain in traitj by the selection of the trait i was
given by: GSj(i)= DSj(i)h2
i, wherein DSj(i) is the indirect
selection differential obtained with the mean of the trait of the genotypes, whose superiority was shown based on other trait on which direct selection is practiced.
The classical index proposed by Smith (1936) and Hazel (1943) consists of a linear combination of several economically important traits whose weighting coefficients are estimated in order to maximize the correlation between the genotypic aggregate and the index. The genotypic aggregate is established by another linear combination, involving the genetic values that are weighted by their respective economic weights (CRUZ; REGAZZI; CARNEIRO, 2012). The selection index of Smith (1936)
and Hazel (1943) is given by: , whereinn is
the number of traits evaluated;b’ is the vector of dimension
1×n of the weighting coefficients of the selection index to
be estimated;x is the matrix of dimensionn×p (genotypes)
of phenotypic values of the trait. The genotypic aggregate is estimated by wherein a’ is the vector
of dimension 1×n of economic weights previously
established; and g is the matrix of dimension n×p of
unknown genetic values of the n trait. Thus, the vector
b = P-1 Ga, whereinP-1 is the inverse of the matrix of
dimension n×n of phenotypic variance and covariance
between the traits; andG is the matrix of dimensionn×n
of genetic variance and covariance between the traits. The Pesek and Baker (1969) index is based on the desired gains for the traits, defined by . Substituting
Δg, the vector of the estimated gains, by Δgd, the vector
of the desired gains, and eliminating the scalar i/σ1, which
does not affect the proportionality of the coefficientsb’s,b
is estimated by the expression , whose coefficients
give the maximization of the gains in each trait based on the specification of the desired gains. Subsequently, the genotypic aggregates were estimated by ,
wherein n is the number of traits evaluated; b’ is the
vector of dimension 1×n of the weighting coefficients
of the selection index to be estimated;x is the matrix of
dimension n×p (genotypes) of the phenotypic values of
the trait.
The index based on sum of ranks (MULAMBA; MOCK, 1978) consists of classifying the genotypes regarding each of the traits in order of improvement. Then, the orders of each genotype are summed, resulting
in the selection index , whereinr
j is the rank of the
genotypei regarding thejth trait;n is the number of traits
in the index.
Eight genotypes were selected for each case, corresponding to an intensity of approximately 22%. Statistical analysis were performed with the Genes (CRUZ, 2013) and SAS (SAS INSTITUTE, 2002) programs.
RESULTS AND DISCUSSION
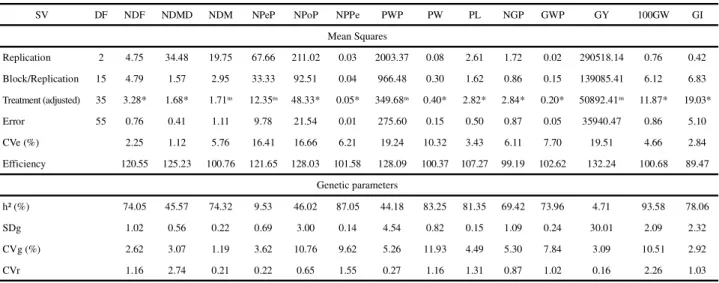
The evaluated traits of the genotypes presented
significant differences (p<0.05), except NDM, NPeP,
PWP and GY (Table 2). The existence of genetic variability in a population is a determining factor for any breeding program, thus, the cowpea genotypes evaluated are promising for recurrent selection for tolerance to water deficit. Recent studies also identified genetic
variability among cowpea genotypes (BASTOS et al.,
2011; CORREA et al., 2012; HAMIDOU; ZOMBRE;
BRACONNIER, 2007; NASCIMENTO et al., 2011;
RODRIGUES et al., 2016; SANTOS et al., 2014;
TEODOROet al., 2016; TORRESet al., 2015).
who define as adequate the use of this experimental design in situations where the efficiency is higher than 100.
The genetic coefficient of variation (CVg) quantifies the genetic variability available for selection (CRUZ; REGAZZI; CARNEIRO, 2012). The ratio between CVg and CVe is the relative coefficient of variation (CVr). The CVg obtained resulted in a CVr higher than 1 for NDF, NDMD, NPPe, PW, PL, GWP, 100GW and GI. This is a favorable situation for the selection of superior genotypes in the populations. The heritability (h²) estimates for these traits—except NDMD—can be considered high (>70%) because they are polygenic traits, governed by several genes of small effect on the phenotype.
Variability among the traits included in the index is essential to employ selection indices in plant breeding (CRUZ; REGAZZI; CARNEIRO, 2012). Therefore, NDM, NPeP, PWP and GY were not included in the indices used in this work; NDF, NDMD, PW, GWP and 100GW were considered as primary and the others as secondary parameters for the prediction of genetic gain. This choice was made considering that an ideal cowpea genotype has a reduced cycle, which makes it possible to be cultivated in times with lower water availability, and have high grain weight, since this trait affects its commercialization.
Table 2 - Analysis of variance and genetic parameters for number of days to flowering (NDF), number of days to field maturity
(NDMD), number of days to maturation (NDM), number of peduncles per plant (NPeP), number of pods per plant (NPoP), number of pods per peduncle (NPPe), pod weight per plant (PWP), pod weight (PW), pod length (PL), number of grains per pod (NGP), grain weight per pod (GWP), grain yield (GY), 100-grain weight (100GW), and grain index (GI) of 36 cowpea genotypes grown under water deficit conditions
ns= not significant by the F test, * = significant at 5% probability by the F test, and ** = significant at 1% probability by the F test. SV = sources of
variation; DF = degrees of freedom; CVe = experimental coefficient of variation; h² = heritability; SDg = genetic standard deviation; CVg = genetic coefficient of variation; CVr = relative coefficient of variation
SV DF NDF NDMD NDM NPeP NPoP NPPe PWP PW PL NGP GWP GY 100GW GI
Mean Squares
Replication 2 4.75 34.48 19.75 67.66 211.02 0.03 2003.37 0.08 2.61 1.72 0.02 290518.14 0.76 0.42
Block/Replication 15 4.79 1.57 2.95 33.33 92.51 0.04 966.48 0.30 1.62 0.86 0.15 139085.41 6.12 6.83
Treatment (adjusted) 35 3.28* 1.68* 1.71ns 12.35ns 48.33* 0.05* 349.68ns 0.40* 2.82* 2.84* 0.20* 50892.41ns 11.87* 19.03*
Error 55 0.76 0.41 1.11 9.78 21.54 0.01 275.60 0.15 0.50 0.87 0.05 35940.47 0.86 5.10
CVe (%) 2.25 1.12 5.76 16.41 16.66 6.21 19.24 10.32 3.43 6.11 7.70 19.51 4.66 2.84
Efficiency 120.55 125.23 100.76 121.65 128.03 101.58 128.09 100.37 107.27 99.19 102.62 132.24 100.68 89.47
Genetic parameters
h² (%) 74.05 45.57 74.32 9.53 46.02 87.05 44.18 83.25 81.35 69.42 73.96 4.71 93.58 78.06
SDg 1.02 0.56 0.22 0.69 3.00 0.14 4.54 0.82 0.15 1.09 0.24 30.01 2.09 2.32
CVg (%) 2.62 3.07 1.19 3.62 10.76 9.62 5.26 11.93 4.49 5.30 7.84 3.09 10.51 2.92
CVr 1.16 2.74 0.21 0.22 0.65 1.55 0.27 1.16 1.31 0.87 1.02 0.16 2.26 1.03
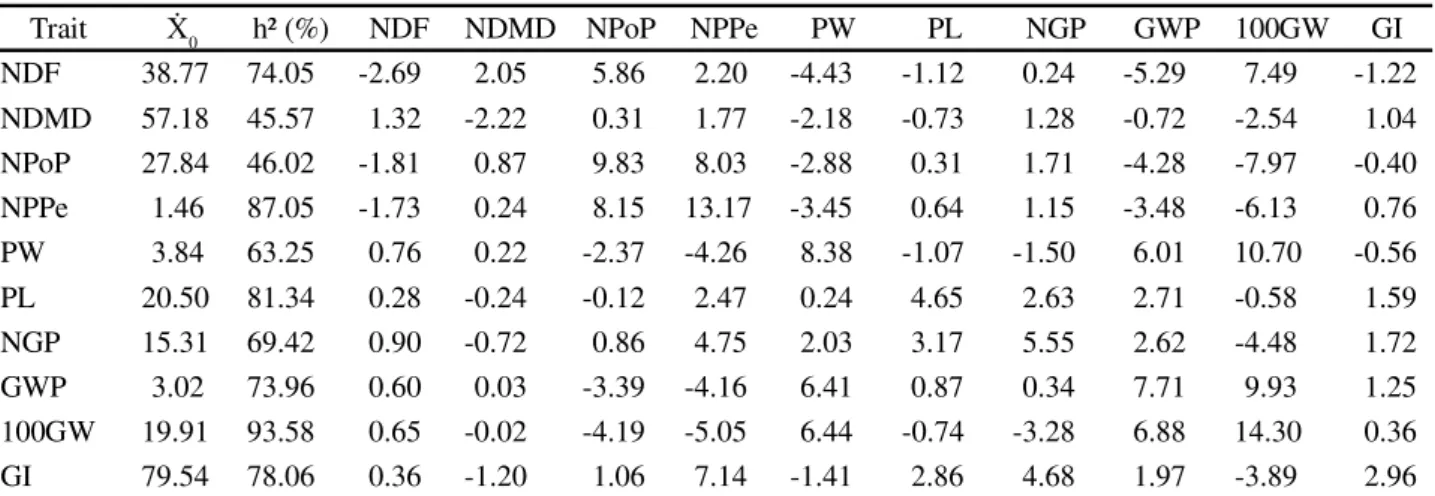
The gains predicted by the direct selection were superior to the indirect gains for all the traits, and close in situations in which the traits are highly correlated, for example, for PW, GWP and 100GW (Table 3). Falconer (1987) reports that indirect selection can promote greater gains than direct selection, when the auxiliary trait presents greater heritability than the main one, and when the genetic correlation between them is positive and of high magnitude. The highest individual gains were observed for 100GW (14.30), NPPe (13.17) NPoP (9.83), and PW (8.38%).
(AGBICODO et al., 2009). In addition, the indirect
response in the other traits suggests the possibility of selecting genotypes with high grain yield.
The estimates of gains predicted by the Smith (1936) and Hazel (1943), Pesek and Baker (1969), and Mulamba and Mock (1978) indexes are described in Table 4. In general, the estimates using the Smith (1936) and Hazel (1943) and Mulamba and Mock (1978) indexes are similar in magnitude and direction. This generated the coincident selection of the genotypes 2, 13, 15, 16, 18,
28, 33 and 34. The Pesek and Baker (1969) index showed gains with similar magnitudes to the other indices used for PW, GWP and 100GW, however, it showed different magnitudes and direction from the predicted gains for the other traits.
According to Cruz, Regazzi and Carneiro (2012) the use of selection indexes is advantageous compared to the direct selection, since it allows more distributed gains in all evaluated traits without providing significant loss in the main traits. However, in the present work, none
Table 3 - Estimates of the means (Ẋ0), heritability (h²) and selection gains (%) obtained by direct and indirect selection in the traits number of days to flowering (NDF), number of days to maturity (NDMD), number of pods per plant (NPoP), number of pods per peduncle (NPPe), pod weight (PW), pod length (PL), number grains per pod (NGP), grain weight per pod (GWP), 100-grain weight (100GW) and grain index (GI) of 36 cowpea genotypes grown under water deficit conditions
Trait Ẋ0 h² (%) NDF NDMD NPoP NPPe PW PL NGP GWP 100GW GI
NDF 38.77 74.05 -2.69 2.05 5.86 2.20 -4.43 -1.12 0.24 -5.29 7.49 -1.22
NDMD 57.18 45.57 1.32 -2.22 0.31 1.77 -2.18 -0.73 1.28 -0.72 -2.54 1.04
NPoP 27.84 46.02 -1.81 0.87 9.83 8.03 -2.88 0.31 1.71 -4.28 -7.97 -0.40
NPPe 1.46 87.05 -1.73 0.24 8.15 13.17 -3.45 0.64 1.15 -3.48 -6.13 0.76
PW 3.84 63.25 0.76 0.22 -2.37 -4.26 8.38 -1.07 -1.50 6.01 10.70 -0.56
PL 20.50 81.34 0.28 -0.24 -0.12 2.47 0.24 4.65 2.63 2.71 -0.58 1.59
NGP 15.31 69.42 0.90 -0.72 0.86 4.75 2.03 3.17 5.55 2.62 -4.48 1.72
GWP 3.02 73.96 0.60 0.03 -3.39 -4.16 6.41 0.87 0.34 7.71 9.93 1.25
100GW 19.91 93.58 0.65 -0.02 -4.19 -5.05 6.44 -0.74 -3.28 6.88 14.30 0.36
GI 79.54 78.06 0.36 -1.20 1.06 7.14 -1.41 2.86 4.68 1.97 -3.89 2.96
Table 4 - Estimations of selection gains (%) obtained by the Smith (1936) and Hazel (1943), Pesek and Baker (1969) and Mulamba and Mock (1978) indexes in the traits number of days to flowering (NDF), number of days to maturity (NDMD), number of pod per plant (NPoP), number of pods per peduncle (NPPe), pod weight (PW), pod length (PL), number of grains per pod (NGP), grain weight per pod (GWP), 100-grain weight (100GW) and grain index (GI) of 36 cowpea genotypes grown under water deficit conditions
Traits Xo h² (%) Smith and Hazel Pesek and Baker Mulamba and Mock
NDF 38.77 74.05 1.55 -0.15 0.68
NDMD 57.18 45.57 -0.90 1.19 -0.22
NPoP 27.84 46.02 -10.31 0.58 -2.56
NPPe 1.46 87.05 -3.57 0.73 -3.14
PW 3.84 63.25 8.50 6.11 6.39
PL 20.50 81.34 1.00 2.06 0.39
NGP 15.31 69.42 -2.96 0.50 -1.95
GWP 3.02 73.96 9.55 8.46 7.15
100GW 19.91 93.58 13.31 12.70 12.48
GI 79.54 78.06 1.80 -0.58 0.73
of the selection indices used was efficient in selecting genotypes that simultaneously provide reduction in cycle related traits and increase in the traits PW, GWP and 100GW. Similar results were observed by Santos and Araújo (2001) using different selection indices in cowpea genotypes; they found that the direct selection in productive traits provided greater gains on the others, when compared to the Smith (1936) and Hazel (1943), Pesek and Baker (1969) and Mulamba and Mock (1978) indexes.
CONCLUSIONS
1. Direct selection based on the pod weight trait is the most efficient criterion to reduce the cycle and increase the productive components in cowpea genotypes subjected to water deficit conditions;
2. The genotypes Pingo-de-Ouro-1-2 × 510F-16-1, CNCx698-128G × 510F-510F-16-1, MNC99-510F-16-1 × Pingo-de-Ouro-1-2, Pingo-de-Ouro-1-2, BRS Paraguaçu, Santo-Inácio × Pingo-de-Ouro-1-2, BRS Xiquexique × Ouro-1-2, and Pingo-de-Ouro-1-2 × Santo-Inácio are the most suitable to be used in recurrent selection programs aiming to reduce the crop cycle and improve productive components of cowpea grown under water deficit conditions.
REFERENCES
AGBICODO, E. M. et al. Breeding drought tolerant
cowpea: constraints, accomplishments, and future prospects.
Euphytica, v. 167, p. 353-370, 2009.
ALMEIDA, W. S. et al. Correlation and path analysis in
components of grain yield of cowpea genotypes.Revista Ciência Agronômica, v. 45, p. 726-736, 2014.
BASTOS, E. A.et al. Identification of cowpea genotypes for
drought tolerance.Revista Ciência Agronômica, v. 42, n. 1, p. 100-107, 2011.
CORREA, A. M.et al. Estimativas de parâmetros genéticos e
correlações entre caracteres fenológicos e morfoagronômicos em feijão-caupi.Revista Ceres, v. 59, p. 88-94, 2012.
CRUZ, C. D. Genes: a software package for analysis in experimental statistics and quantitative genetics. Acta Scientiarum, v. 35, n. 3, p. 271-276, 2013.
CRUZ, C. D.; REGAZZI, A. J.; CARNEIRO, P. C. S.Modelos biométricos aplicados ao melhoramento genético. 4. ed. Viçosa, MG: UFV, 2012. 480 p.
FALCONER, D. S.Introdução à genética quantitativa. Trad.
de Martinho de Almeida e Silva e José Carlos Silva. Viçosa, MG: UFV: Imprensa Universitária, 1987. 279 p.
GENUCHTEN, M. T. A closed form equation for predicting hydraulic conductivity of unsaturated soils.Soil Science Society of American Journal, n. 44, p. 892-898, 1980.
GRIFFING, B. Concept of general and specific ability in relation to diallel crossing systems.Australian Journal of Biological Sciences, v. 9, p. 462-93, 1956.
HAMIDOU, F.; ZOMBRE, G.; BRACONNIER, S. Physiological and biochemical responses of cowpea genotypes to water stress under glasshouse and field conditions. Journal of Agronomy and Crop Science, v. 193, p. 229-237, 2007.
HAZEL, L. N. The genetic basis for constructing selection indexes.Genetics, v. 28, p. 476-490, 1943.
INSTITUTO NACIONAL DE METEOROLOGIA. Dados meteorológicos. 2011. Disponível em: <http://www.inmet. gov.br/>. Acesso em: 10 fev. 2012.
MENDES, R. M. S.et al. Relações fonte-dreno em feijãode-corda submetido à deficiência hídrica.Revista Ciência Agronômica, v. 38, n. 1, p. 95-103, 2007.
MULAMBA, N. N.; MOCK, J. J. Improvement of yield potential of the Eto Blanco maize (Zea mays L.) population
by breeding for plant traits.Egyptian Journal of Genetics and Cytology, v. 7, p. 40-57, 1978.
NASCIMENTO, S. P. et al. Tolerância ao déficit hídrico em
genótipos de feijão-caupi. Revista Brasileira de Engenharia Agrícola e Ambiental, v. 15, n. 8, p. 853-860, 2011.
OLIVEIRA, O. M. S. et al. Associações genotípicas entre
componentes de produção e caracteres agronômicos em feijão-caupi. Revista Ciência Agronômica, v. 44, p. 851-857, 2013.
PESEK, J.; BAKER, R. J. Desired improvement in relation to selected indices.Canadian Journal of Plant Science, v. 49,
p. 803-804, 1969.
RAMALHO, M. A. P.; FERREIRA, D. F.; OLIVEIRA, A. C.
Experimentação em genética e melhoramento de plantas. 2. ed. Lavras: UFLA, 2005. 322 p.
RODRIGUES, E. V. et al. Diallelic analysis to obtain cowpea
(Vigna unguiculata L. Walp.) populations tolerant to water
déficit.Genetics and Moleceular Research, v. 15, n. 2, p. 1-8,
2016.
SANTOS, C. A. F.; ARAÚJO, F. P. Aplicação de índices para seleção de caracteres agronômicos de feijão-de-corda.Revista Ciência Agronômica, v. 32, n. 1/2, p. 78-84, 2001.
SANTOS, J. A. S. et al. Desempenho agronômico e
divergência genética entre genótipos de feijão-caupi cultivados no ecótono Cerrado/Pantanal. Bragantia, v. 73, p. 377-382, 2014.
SAS INSTITUTE. SAS Software. Version 9.1. Cary, North Carolina: SAS Institute Inc., 2002.
SMITH, H. F. A discriminant function for plant selection.
TEODORO, P. E.et al. Measurements of experimental precision for trials with cowpea (Vigna unguiculataL. Walp.) genotypes.
Genetics and Moleceular Research, v. 15, n. 2, p. 1-8, 2016.