Performance of maize single-crosses developed from populations
improved by a modified reciprocal recurrent selection
Cláudio Lopes de Souza Jr.
1*; Sanzio Carvalho Lima Barrios
2; Gustavo Vitti Moro
21
USP/ESALQ – Depto. de Genética, C.P. 83 – 13400-970 – Piracicaba, SP – Brasil. 2
USP/ESALQ – Programa de Pós-Graduação em Genética e Melhoramento de Plantas. *Corresponding author <[email protected]>
ABSTRACT: Maize (Zea mays L.) elite inbred lines developed from pedigree programs tend to be genetically related. Therefore, it is necessary to incorporate unrelated inbreds to those programs to allow the continued release of outstanding single-crosses. The objectives of this research were to compare the usefulness of a modified reciprocal recurrent selection procedure (MRRS) to improve populations to be used as sources of elite inbreds and outstanding single-crosses to integrate pedigree programs, and to investigate the effects of selection on the relative contribution of general (GCA) and specific combining (SCA) abilities to the single-crosses variation. Eight and six S3 lines from populations IG-3-C1 and IG-4-C1, respectively, selected from the first cycle of the MRRS program were crossed in a partial-diallel mating design, and the 48 experimental and five commercial crosses were evaluated in six environments. Grain yield mean of the experimental single-crosses (9.57 t ha–1
) did not differ from the commercial single-crosses (9.86 t ha–1
), and ten of the 48 experimental crosses could be released as cultivars because they compared favorably to the currently used single-crosses. Thus, one cycle of the MRRS procedure improved efficiently the populations allowing the development of outstanding single-cross, but additional cycles of selection should be carried out since none of the experimental single-crosses outperformed the highest yielding commercial single-cross. The relative contribution of the GCA over SCA may have been affected by the MRRS, since the SCA was more important than GCA for some of the traits assessed.
Key words: diallel design, maize improvement, combining ability
Performance de híbridos simples de milho desenvolvidos de populações
melhoradas por seleção recorrente recíproca modificada
RESUMO: Linhagens elites de milho (Zea mays L.) desenvolvidas em programas genealógicos tendem a ser geneticamente relacionadas. Portanto, é necessário incorporar linhagens não relacionadas a estes programas para permitir a liberação contínua de híbridos simples superiores. Comparou-se a utilidade de um procedimento modificado de seleção recorrente recíproca (SRRM) em melhorar populações a serem utilizadas como fontes de linhagens elites e híbridos simples superiores para integrar os programas de melhoramento, e investigar os efeitos da seleção na contribuição relativa da capacidade geral (CGC) e da capacidade específica (CEC) de combinação para a variabilidade dos híbridos simples. Oito e seis linhagens S3 obtidas das populações IG-3-C1 e IG-4-C1, respectivamente, selecionadas do primeiro ciclo de SRRM, foram cruzadas no delineamento dialelo parcial e os 48 híbridos simples experimentais (HSE) e cinco híbridos simples comerciais (HSC) foram avaliados em seis ambientes. A média geral de produção de grãos dos HSE (9.57 t ha–1
) não diferiu significativamente dos HSC (9.86 t ha–1
), e dez dos 48 HSE poderiam ser liberados como cultivares, pois são comparáveis aos híbridos simples comerciais. Portanto, um ciclo de SRRM foi eficiente em melhorar as populações permitindo a produção de híbridos simples superiores, mas ciclos adicionais de seleção deverão ser conduzidos, pois nenhum dos HSE superou o híbrido simples comercial mais produtivo. As contribuições relativas da CGC e da CEC podem ter sido afetadas pela SRRM, uma vez que a CEC foi mais importante que a CGC para alguns caracteres avaliados. Palavras-chave: delineamento dialélico, melhoramento de milho, capacidade de combinação
Introduction
Populations developed from crosses of elite inbred lines, e.g., F2’s or backcrosses, are, usually, the sources of inbred lines in commercial maize (Zea mays L.) breed-ing programs. The elite inbred lines developed from these populations are crossed to develop new popula-tions, and then the elite inbred lines are recycled repeti-tively to assemble their favorable alleles in new inbred lines and hybrids (Hallauer, 1990; Bernardo, 2002).
Al-though this procedure has been very effective to develop outstanding hybrids, in the long-term the recycled inbreds will become, to some extent, genetically related lessening the genetic variability of the breeding pro-grams and, consequently, limiting the development of hybrids that outperform those ones already released (Smith, 1988; Yu and Bernardo, 2004).
has been very effective (Eyherabide and Hallauer, 1991; Souza Jr. and Pinto, 2000; Santos et al., 2005), and also the improved populations have been sources of elite inbreds and outstanding single-crosses (Hallauer et al., 1988; Betrán and Hallauer, 1996). The elite inbred lines from the RRS programs are unrelated to the inbreds de-veloped from the recycling programs, and then they could be incorporated to these programs to maintain the rate of the development and release of new hybrids. De-spite of its features, RRS procedure has seldom been used in commercial maize breeding programs mainly because of its long-term nature (Hallauer et al., 1988; Bernardo, 1996).
To be integrated into commercial hybrid breeding programs, RRS programs should use high selection in-tensity and evaluate testcrosses of S3 lines, instead of test-crosses of S1 lines (Rezende and Souza Jr., 2000). High selection intensity will increase the frequency of favor-able alleles at a higher rates per cycle, and the testcross of the S3 lines will be an early test of their derived inbreds since the genetic correlation between testcrosses of S3 lines and their S7 counterparts is very high (Bernardo, 1991). One cycle of the modified (MRRS) pro-cedure designed by Rezende and Souza Jr. (2000) in-creased grain yield by 16.7% and reduced significantly plant and ear heights. In a per cycle basis, this MRRS procedure increased grain yield at a higher rate than the 6.0% to 7.0% reported for standard RRS programs where 10% to 20% as selection intensity and S1 lines for recom-bination were used (Eyherabide and Hallauer, 1991; Hallauer et al., 1988; Santos et al., 2007; Santos et al., 2005; Souza Jr. and Pinto, 2000). Then, the MRRS procedure was highly effective in improving the population cross performance in only one cycle of selection. Further-more, there were no evidences that genetic variances and genetic correlations of the traits assessed changed sig-nificantly, indicating that further high-intensity selection cycles could be conducted.
Reciprocal recurrent selection was designed to ex-ploit both general (GCA) and specific combining (SCA) abilities, which are related to additive and non-additive (dominance and epistatic) effects, respectively (Comstock et al., 1949). Several reports have showed that both GCA and SCA contribute similarly for grain yield variation, but for other traits such as grain yield compo-nents, days to flowering, plant height, and disease and insect resistance, GCA is more important than SCA for their variation (Hallauer and Miranda Filho, 1988). How-ever, the relative contributions of these effects could be affected by recurrent selection programs (Doerksen et al., 2003; Santos et al., 2007). Since the RRS procedure presented by Rezende and Souza Jr. (2000) introduced new features, it is necessary to investigate whether it changed the relative contribution of GCA and SCA ef-fects to the single-crosses variation.
Although the procedure presented by Rezende and Souza Jr. (2000) was highly efficient to improve popula-tion crosses, to be incorporated into commercial
breed-ing programs the improved base populations should be sources of single-crosses that compare favorably or out-perform the existing commercial single-crosses in few selection cycles. Thus, the objectives of this research were to (i) evaluate the efficiency of the modified RRS procedure in developing improved populations as sources of outstanding single-crosses, and (ii) verify whether the MRRS affected the relative contribution of general and specific combining abilities for the variation of the traits assessed.
Material and Methods
Germplasm and selection procedures
Early-flowering maize populations 105 and BR-106 with orange flint and yellow dent kernels, respec-tively, allocated in different heterotic groups, and re-leased by EMBRAPA/Milho e Sorgo (Souza Jr. et al., 1993) were used for this research. These populations are under high-intensity reciprocal recurrent program as al-ready reported by Rezende and Souza Jr. (2000). Briefly, 400 S3 lines from each population were developed, and these lines were selected for high heritability traits as plant height, early-flowering, and disease and insect re-sistance. The S3 lines from the BR-105 population were testcrossed to the BR-106 population, and the S3 lines from the 106 population were testcrossed to the BR-105 population. These testcrosses were evaluated in three locations with three replications per location. Based on grain yield, plant lodging and ear height, eight (2.0%) and ten (2.5%) testcrosses from populations 105 and BR-106 were selected, and the recombination of the S3 lines of each population gave rise to the IG-3-C1 and to the IG-4-C1 maize synthetics, respectively. Four-hundred S3 lines from IG-3-C1 and 400 S3 lines from IG-4-C1 were developed and testcrossed to the reciprocal populations. The testcrosses were evaluated in three locations with three replications per location, and based on grain yield, plant lodging and plant height, a high selection inten-sity was applied on both populations: 2.0% (eight test-crosses selected) for the IG-3-C1 synthetic and 1.5% (six testcrosses selected) for the IG-4-C1 synthetic. Then, the eight and six S3 lines related to the testcrosses selected from the IG-3-C1 and IG-4-C1 synthetics, respectively, were used for this research.
Experimental procedures
47°37’W), São Paulo State, Brazil, in the growing seasons of 2005/2006 and 2006/2007. A combination of a loca-tion and a growing season was considered as an envi-ronment, and then, six environments with two replica-tions per environment were used for evaluation. Plots were one row 4.0 m long spaced 0.8 m apart, and they were overplanted and thinned to 20 plants per plot (62,500 plants ha–1). Data were recorded for grain yield
(t ha–1), grain moisture (g kg–1), stand (plants per plot), plant height (PH) and ear height (EH) (cm per plant), plant lodging [PL= (root lodging + stalk lodging) plot–1],
and number of ears per plot. Plant and ear heights were recorded on five competitive plants per plot, from the ground level to the collar of the flag leaf and to the up-permost ear node, respectively; and plot means were used for analyses. Grain yield (GY) of each plot was ad-justed for average stand by covariance analyses and to grain moisture of 155 g kg–1. Prolificacy (PRO = ears
per plant) was computed as the ratio number of ears per plot/stand, and adjusted to stand by covariance analy-sis; plant lodging was expressed as a percentage of the total plants per plot, and subsequently transformed to (PL% + 0.5)0.5; and ear placement (EP) was computed
per plot as the ratio ear height/plant height. GY was re-corded in six environments, and the remaining traits in four environments; PH, EH, PL and PRO were not re-corded in the Experimental Stations of Areão and Cat-erpillar in the 2005/2006 growing seasons.
Statistical analyses
Analysis of variance was computed for each environ-ment, and the adjusted means and the effective error mean squares from each environment were used to com-pute the joint analysis of variance. Initially, error mean squares were submitted to Bartlett’s test (p ≤ 0.05) of ho-mogeneity (Sokal and Rohlf, 1995) and no significance were found for all traits evaluated. A mixed model was used since single-crosses were considered as fixed effects and environments as random effects in the mathemati-cal model; therefore the entries × environments means squares were used as denominators of the F test for crosses in the joint analysis of variance. The PROC GLM from SAS software (SAS Institute, 2004) was used for all analyses.
The adjusted means from each environment were used to analyze the partial diallel design using the Griffing's (1956) concepts of general and specific com-bining abilities, in model I method 4, adapted to partial diallels (Geraldi and Miranda Filho, 1988) and expanded to multiple environments to include the interaction of main effects with environmental effects (Ferreira et al., 1993), as follows:
Yijk = μ + gi + gj + sij + εk + (gε)ik + (gε)jk + (sε)ijk + eijk
and Yijkis the value of the experimental single-cross from
the cross between the ith line from IG-3 synthetic and jth line from IG-4 synthetic in the kth environment, μ is the general mean, gi(gj) is the general combining ability
of the ith or the jth line, sij is the specific combining
abil-ity between the ith and jth lines, εk is the effect of the kth
environment, (gε)ik, (gε)jk and (sε)ijk are the corresponding interaction effects between the environment and the gen-eral and specific combining abilities, respectively, and
ijk
e is the mean effective error. The sums of squares of the analyses of variances, the estimates of the general and specific combining abilities, as well as the standard errors of estimates of these parameters were computed from expressions given by Ferreira et al. (1993) which were derived from ordinary least squares procedures. t
tests were performed to test whether the estimates of
gi(gj) and of sij differed significantly from zero as follows:
( /2;n1) gˆi/sˆ(gi)
tα = and ( ) ˆ /ˆ( )
2
; 2
/ n sij s sij
tα = ; here sˆ(gi) and )
( ˆsij
s are the standard errors of the GCA and SCA es-timates; n1 and n2 are the degrees of freedom of the GCA x environment and SCA × environment, respec-tively, and α = 0.05 and α = 0.01 were used. The sum of squares (SS) of the GCA and of the SCA sources of variation were used to compute the relative contribu-tion of these effects to the variacontribu-tion of the ESC as: {SS(GCA)/[SS(GCA)+SS(SCA)]}.100 and {SS(SCA)/ [SS(GCA)+SS(SCA)]}.100; here SS(GCA) refers to the sum of GCA(IG-3) and GCA(IG-4) sums of squares.
Results and Discussion
Means and analysis of variance
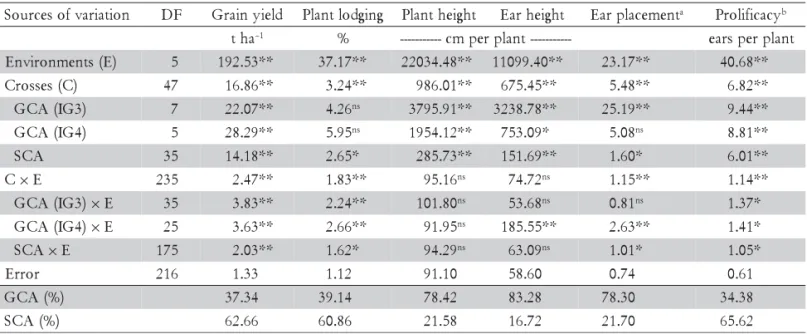
The joint analysis of variance (not shown) detected highly significant differences (p ≤ 0.01) for entries for all traits evaluated. For entries x environments interaction highly differences were detected for grain yield (GY), plant lodging (PL) and ear placement (EP), whereas for plant height (PH), ear height (EH) and prolificacy (PRO) no significant differences were detected. Thus, genetic variation was present among the ESC for all traits evalu-ated, and for only three of these traits the performances of the ESC differed significantly across environments. Average grain yield was 9.57 t ha–1 for the experimental
(ESC) and 9.86 t ha–1 for the commercial (CSC)
single-crosses, and the coefficient of experimental variation was 12.06%.
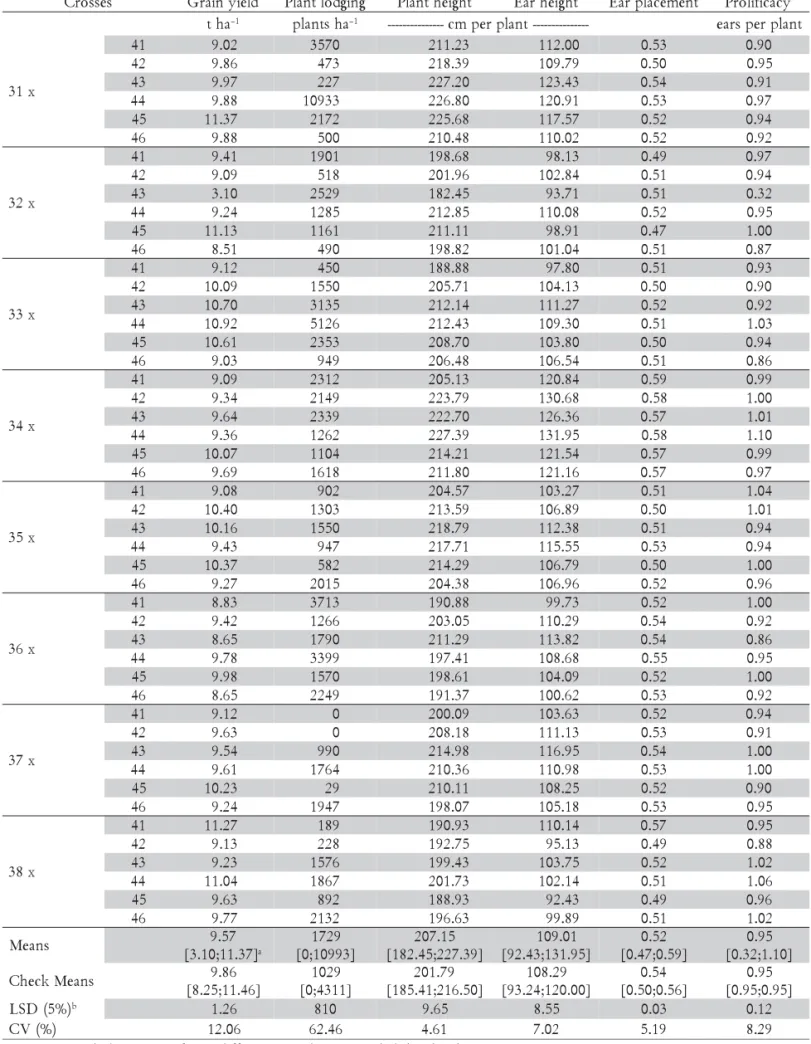
The GY means of the ESC ranged from 3.10 to 11.37 t ha–1 and the means of the CSC ranged from 8.25 to 11.46 t ha–1. ESC and CSC grain yield overall means did not differ significantly, and also the mean of the ten highest yielding ESC (10.80 t ha–1), which correspond to 20.83%
of the ESC evaluated, did not differ from the highest yielding CSC (11.46 t ha–1); but they differed from the
lowest yielding CSC (8.25 t ha–1); and only one of the ESC presented lower grain yield than the lowest yield-ing CSC. For plant lodgyield-ing (PL), the second trait most important in maize breeding programs, the ESC mean (2.77% =1,731 plants ha–1) did not differ from the CSC
mean (1.65% = 1,031 plants ha–1); the ESC means ranged
from 0.0% to 17.49% (10,931 plants ha–1) and the CSC
ranged from 0.0% to 6.90% (4,312 plants ha–1). Notice that
pre-sented higher plant lodging than the CSC with the high-est plant lodging (6.90%), and these two ESC were not among the ten highest yielding ESC (Table 1).
Plant height, ear height, and ear placement traits are regularly assessed in maize breeding programs since they are closely related to plant lodging; i.e., higher the plant height (PH) and/or ear (EH) height and/or ear placement (EP) higher the probability of plant lodging. These traits presented similar pattern of variation as ex-pected because they are highly correlated among them-selves (Hallauer and Miranda Filho, 1988; Silva et al., 2004). For the three traits the ESC means did not differ from the CSC means, and individually most of the ESC (≥ 67.0%) did not differ from the CSC mean. Notice that the ESC with the highest PH (227.39 cm per plant) dif-fered from the CSC with the highest PH (216.50 cm per plant), but the difference between them was not great enough (10.89 cm per plant= 5.03%) to discard it as a potential cultivar. On the other hand, the ESC with the highest EH (131.95 cm per plant) differed from the CSC with the highest EH (120.00 cm per plant), and the dif-ference between them (11.95 cm per plant = 9.96%) was great enough to discard it as a potential cultivar. For ear placement, the mean of the ESC (0.52) was slightly lower but did not differ from the CSC (0.54), and about 85.00% of the ESC did not differ from the CSC; also the highest yielding ESC had an EP value of 0.52 (Table 1).
Prolificacy has been associated to drought stress tol-erance (Campos et al., 2006) and to stability of maize hybrids across environments (Motto and Moll, 1983). Since in tropical maize growing areas short periods of lack of precipitation during the flowering time are fre-quent, and also because maize cultivated in off-growing season occupies a large area in Brazil nowadays where moisture stress is likely to occur, prolificacy should be considered as an important trait in breeding programs for these regions. The overall means for prolificacy for both ESC and CSC were equal (0.95); only eight (16.67%) of the ESC presented more than 1.0 ears per plant and all CSC presented less than 1.0 ears per plant (Table 1). Hence, besides GY, PL and plant and ear heights traits that have been used for selecting the superior testcrosses, selection for prolificacy should be implemented in the MRRS program. Since it is a trait that presents high heri-tability in a single-plant basis (Hallauer and Miranda Filho, 1988), selection for prolificacy could be easily implemented during the development of the S3 lines.
If one considers that to be commercialized a SC should present at least the GY mean and the upper means for PL, PH, EH, EP, and PRO of the CSC evalu-ated, this hypothetical SC would have the following means: 9.86 t ha–1, 6.90% of lodged plants, 216.50 cm per
plant, 120.0 cm per plant, 0.56 as ear placement, and 0.95 ears per plant, respectively. Then, the ten highest yield-ing ESC will have superior performance than this SC, as the means of these ESC were 10.80 t ha–1, 2.87% of
lodged plants, 210.07 cm per plant, 107.51 cm per plant, 0.51 as ear placement, and 0.98 ears per plant.
Further-more, as each one of these ESC compared favorably to the CSC they could be released commercially as culti-vars. For instance, the highest yielding ESC presented the following values: 11.37 t ha–1, 3.48% of lodged plants,
225.68 cm per plant, 117.57 cm per plant, 0.52 as EP, and 0.94 ears per plant. Thus, this ESC will present higher grain yield, less logged plants, about 9 cm higher plants, lower ear height plants, lower ear placement, and simi-lar PRO than that hypothetical SC. However, for GY this ESC did not differ significantly from the highest yielding CSC (11.37 t ha–1 vs. 11.46 t ha–1).
Although the IG-3-C1 and IG-4-C1 synthetics have been improved effectively to develop SC that presented superior performances than several CSC, they have not been improved yet at such level to allow the develop-ment of SC that outperform the highest yielding CSC. These ESC were developed from S3 lines selected after only one cycle of the MRRS procedure. Hence, one could expect that after the recombination of the eight selected S3 lines from IG-3-C1 and of the six selected S3 lines from IG-4-C1 synthetics to develop the IG-3 cycle 2 (IG-3-C2) and IG-4 cycle 2 (IG-4-C2), these improved populations will have potential to develop single-crosses that outper-form the highest yielding CSC, since the favorable alle-les for the traits assessed that were dispersed among the S3 selected lines within each population should be as-sembled in genotypes that will be sources of higher per-forming single-crosses.
General and specific combining ability
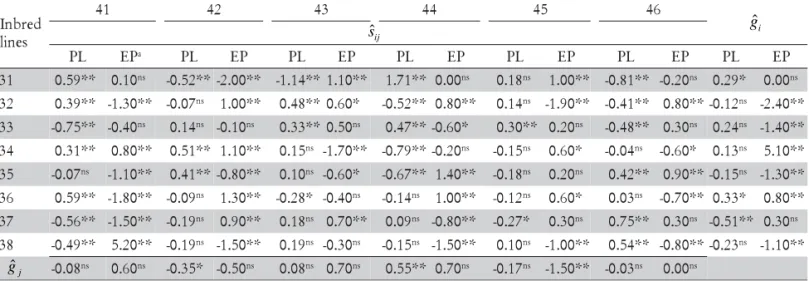
RRS breeding procedure was designed to exploit both general (GCA) and specific (SCA) combining abilities, which are related, respectively, to additive and non-additive (dominance and epistasis) effects (Comstock et al., 1949). Thus it is important to know whether the relative contribution of these effects to the ESC expression have been altered by the RRS proce-dure used in this research. Highly significant (p ≤ 0.01) or significant (p ≤ 0.05) differences were detected for GCA for the lines of both populations (GCA-IG-3 and GCA-IG-4) for GY, PH, EH, and PRO; whereas for EP no difference was detected for GCA-IG4 and no differ-ences were detected for PL for both GCA-IG-3 and GCA-IG-4 lines. Also, highly significant and significant differences were detected for specific combining abil-ity (SCA) for all traits. Thus, additive and non-additive effects were detected for all traits, except for PL where only non-additive effects were detected. For the inter-actions with environments (E), highly significant and significant differences were detected for GCA × E and SCA × E for GY, PL, and PRO; whereas for PH, EH and EP some of these effects did not differ significantly from zero. These results indicate that the CGA effects for the lines of both populations as well as the SCA effects for GY, PL, and PRO varied across the environ-ments. For the remaining traits the results for the in-teractions were inconsistent (Table 2). For GY the es-timates of GCA ranged from -1.16 t ha–1 to 0.85 t ha–1,
aRange intervals. bLeast significant differences at the 0.05 probability level.
Table 1 - Mean values, least significant differences and experimental coefficients of variation for the experimental maize single-crosses and checks for several traits.
s e s s o r
C Grainyield Plantlodging Plantheight Earheight Earplacement Prolificacy a
h
t –1 plantsha–1 ---------------cmperplant--------------- earsperplant
x 1 3
1
4 9.02 3570 211.23 112.00 0.53 0.90
2
4 9.86 473 218.39 109.79 0.50 0.95
3
4 9.97 227 227.20 123.43 0.54 0.91
4
4 9.88 10933 226.80 120.91 0.53 0.97
5
4 11.37 2172 225.68 117.57 0.52 0.94
6
4 9.88 500 210.48 110.02 0.52 0.92
x 2 3
1
4 9.41 1901 198.68 98.13 0.49 0.97
2
4 9.09 518 201.96 102.84 0.51 0.94
3
4 3.10 2529 182.45 93.71 0.51 0.32
4
4 9.24 1285 212.85 110.08 0.52 0.95
5
4 11.13 1161 211.11 98.91 0.47 1.00
6
4 8.51 490 198.82 101.04 0.51 0.87
x 3 3
1
4 9.12 450 188.88 97.80 0.51 0.93
2
4 10.09 1550 205.71 104.13 0.50 0.90
3
4 10.70 3135 212.14 111.27 0.52 0.92
4
4 10.92 5126 212.43 109.30 0.51 1.03
5
4 10.61 2353 208.70 103.80 0.50 0.94
6
4 9.03 949 206.48 106.54 0.51 0.86
x 4 3
1
4 9.09 2312 205.13 120.84 0.59 0.99
2
4 9.34 2149 223.79 130.68 0.58 1.00
3
4 9.64 2339 222.70 126.36 0.57 1.01
4
4 9.36 1262 227.39 131.95 0.58 1.10
5
4 10.07 1104 214.21 121.54 0.57 0.99
6
4 9.69 1618 211.80 121.16 0.57 0.97
x 5 3
1
4 9.08 902 204.57 103.27 0.51 1.04
2
4 10.40 1303 213.59 106.89 0.50 1.01
3
4 10.16 1550 218.79 112.38 0.51 0.94
4
4 9.43 947 217.71 115.55 0.53 0.94
5
4 10.37 582 214.29 106.79 0.50 1.00
6
4 9.27 2015 204.38 106.96 0.52 0.96
x 6 3
1
4 8.83 3713 190.88 99.73 0.52 1.00
2
4 9.42 1266 203.05 110.29 0.54 0.92
3
4 8.65 1790 211.29 113.82 0.54 0.86
4
4 9.78 3399 197.41 108.68 0.55 0.95
5
4 9.98 1570 198.61 104.09 0.52 1.00
6
4 8.65 2249 191.37 100.62 0.53 0.92
x 7 3
1
4 9.12 0 200.09 103.63 0.52 0.94
2
4 9.63 0 208.18 111.13 0.53 0.91
3
4 9.54 990 214.98 116.95 0.54 1.00
4
4 9.61 1764 210.36 110.98 0.53 1.00
5
4 10.23 29 210.11 108.25 0.52 0.90
6
4 9.24 1947 198.07 105.18 0.53 0.95
x 8 3
1
4 11.27 189 190.93 110.14 0.57 0.95
2
4 9.13 228 192.75 95.13 0.49 0.88
3
4 9.23 1576 199.43 103.75 0.52 1.02
4
4 11.04 1867 201.73 102.14 0.51 1.06
5
4 9.63 892 188.93 92.43 0.49 0.96
6
4 9.77 2132 196.63 99.89 0.51 1.02
s n a e
M 9.57
] 7 3 . 1 1 ; 0 1 . 3 [ a 9 2 7 1 ] 3 9 9 0 1 ; 0 [ 5 1 . 7 0 2 ] 9 3 . 7 2 2 ; 5 4 . 2 8 1 [ 1 0 . 9 0 1 ] 5 9 . 1 3 1 ; 3 4 . 2 9 [ 2 5 . 0 ] 9 5 . 0 ; 7 4 . 0 [ 5 9 . 0 ] 0 1 . 1 ; 2 3 . 0 [ s n a e M k c e h
C 9.86
] 6 4 . 1 1 ; 5 2 . 8 [ 9 2 0 1 ] 1 1 3 4 ; 0 [ 9 7 . 1 0 2 ] 0 5 . 6 1 2 ; 1 4 . 5 8 1 [ 9 2 . 8 0 1 ] 0 0 . 0 2 1 ; 4 2 . 3 9 [ 4 5 . 0 ] 6 5 . 0 ; 0 5 . 0 [ 5 9 . 0 ] 5 9 . 0 ; 5 9 . 0 [ ) % 5 ( D S
L b 1.26 810 9.65 8.55 0.03 0.12
) % ( V
1.87 t ha–1; notice that the estimates of SCA were larger
than the GCA estimates. Also, for PL and PRO the ranges and estimates of the SCA were larger than the GCA estimates. For PH, EH, and EP the ranges and es-timates of the GCA and SCA effects presented similar values (Tables 3 and 4).
The relative contribution of the GCA and SCA ef-fects for the ESC variation was 37.34% and 62.66% for GY, 39.14% and 60.86% for PL, and 34.38% and 65.62% for PRO. For the remaining traits the CGA contribu-tion was higher (>78.0%) than the SCA contribucontribu-tion for the ESC variation. Thus, the non-additive effects (domi-nance and epistasis) were more important than the ad-ditive effects for GY, PL, and PRO, whereas for PH, EH, and EP the contribution of the additive effects were more important than the non-additive effects for the ESC varia-tion. The relative importance of GCA over SCA
de-pends on the level of dominance of the trait. For in-stance, reported results have shown that the level of dominance for GY ranged from partial to complete dominance, and for PH it ranged from additive to par-tial dominance (Bingham, 1998; Silva et al., 2004), and then one could expect that SCA was as important as GCA effect for GY, and that GCA was more important than SCA effect for PH. In fact, GCA effect is as important as SCA effect for GY, and GCA is more important than SCA for PH (Hallauer and Miranda Filho, 1988; Aguiar et al., 2003). However, to some extent, the type of selec-tion applied could affect the relative importance of these effects (Doerksen et al., 2003; Santos et al., 2007). Santos et al. (2007) reported that after three cycles of RRS the relative importance of GCA over SCA changed, since the SCA values increased more than the GCA values for GY across the cycles, and thus the SCA effects became
n o i t a i r a v f o s e c r u o
S DF Grainyield Plantlodging Plantheight Earheight Earplacementa Prolificacyb
a h
t –1 % -----------cmperplant----------- earsperplant
) E ( s t n e m n o r i v n
E 5 192.53** 37.17** 22034.48** 11099.40** 23.17** 40.68** )
C ( s e s s o r
C 47 16.86** 3.24** 986.01** 675.45** 5.48** 6.82** )
3 G I ( A C
G 7 22.07** 4.26ns 3795.91** 3238.78** 25.19** 9.44**
) 4 G I ( A C
G 5 28.29** 5.95ns 1954.12** 753.09* 5.08ns 8.81**
A C
S 35 14.18** 2.65* 285.73** 151.69** 1.60* 6.01** C×E 235 2.47** 1.83** 95.16ns 74.72ns 1.15** 1.14**
) 3 G I ( A C
G ×E 35 3.83** 2.24** 101.80ns 53.68ns 0.81ns 1.37*
) 4 G I ( A C
G ×E 25 3.63** 2.66** 91.95ns 185.55** 2.63** 1.41*
A C
S ×E 175 2.03** 1.62* 94.29ns 63.09ns 1.01* 1.05*
r o r r
E 216 1.33 1.12 91.10 58.60 0.74 0.61
) % ( A C
G 37.34 39.14 78.42 83.28 78.30 34.38
) % ( A C
S 62.66 60.86 21.58 16.72 21.70 65.62
a,bMean squares multiplied by 103 and 102, respectively. nsNon-significant; * p ≤ 0.05; ** p ≤ 0.01 by the F test.
Table 2 - Values and significances of the means squares from the diallel analyses of variance, and contributions of general (GCA) and specific (SCA) combining ability for traits expression for several maize traits.
nsNon-significant; *p ≤ 0.05; **p ≤ 0.01 by the t test.
Table 3 - General (gˆi andgˆj) and specific (sˆij) combining ability estimates from the diallel analysis for maize grain yield
(t ha–1).
s e n i l d e r b n
I 41 42 43 44 45 46
1
3 -0.77** -0.18ns 0.68** -0.45** 0.53** 0.20* 0.42**
2
3 1.21** 0.63** -4.61** 0.49** 1.87** 0.41** -1.16**
3
3 -0.75** -0.04ns 1.32** 0.51** -0.32** -0.73** 0.50**
4
3 -0.23* -0.23* 0.81** -0.51** -0.31** 0.48** -0.04ns
5
3 -0.50** 0.57** 1.08** -0.69** -0.26** -0.20* 0.21ns
6
3 -0.18* 0.16ns 0.13ns 0.23* -0.09ns -0.25** -0.36**
7
3 -0.23* 0.02ns 0.68** -0.28** -0.18* 0.00ns -0.01ns
8
3 1.46** -0.93** -0.08ns 0.69** -1.23** 0.08ns 0.44**
1 2 . 0
- ns 0.05ns -0.70** 0.33* 0.85** -0.32*
i
gˆ
ij
sˆ
j
more important than GCA effects. This change was at-tributable to the type of selection applied since selec-tion for GY was based on the means of interpopulaselec-tion progenies, emphasizing the performance of the crosses. On the other hand, for PH the relative importance of GCA over SCA did not change with selection since the selection for this trait was practiced during the develop-ment of progenies; i.e., intrapopulation selection was used for PH. Similar results on the increase of the rela-tive importance of non-addirela-tive effects (SCA) over addi-tive effects (SCA) on the crosses of maize populations under RRS for GY were also reported by Doerksen et al. (2003).
Comparing with those reported our results suggest that the RRS procedure used also changed the relative contribution of GCA over SCA for GY, PL, and PRO, since the contribution of the non-additive effects (SCA) were more important than the additive effects (GCA) for the ESC variation. Selection for GY and PL was based on interpopulation progenies, whereas no selec-tion was practiced for PRO. However since PRO is an important GY component, the interpopulation selection for GY could have caused an indirect response for PRO changing the relative importance of GCA over SCA for this trait. For plant height, ear height, and ear placement traits, selection was practiced mainly during the devel-opment of the S3 lines, i.e., at intrapopulation level em-phasizing the additive effects, and then, as expected, no changes on the relative importance of the GCA over SCA were observed. Thus, our results were in agreement with those reported by Santos et al. (2007) and Doerksen et al. (2003).
Implications for breeding
The modifications implemented in the RRS program reported in this study; i.e., high selection intensity (≈2.0%) coupled with the evaluation of testcrosses and recombination of S3 lines, developed populations (IG-3-C1 and IG-4-(IG-3-C1) that were improved at such level that
the ESC developed from them compared favorably with CSC. Therefore, the MRRS procedure outlined and evaluated in this research could be used effectively in maize breeding programs to fulfill both the need to in-crease or maintain the genetic variability of the pedigree programs and to release outstanding single-crosses as cultivars. These ESC represent the effects of only one cycle of selection, and then after the recombination of the selected lines the improved second-cycle populations will be, probably, sources of inbred lines whose single-crosses should outperform the best CSC. The modifica-tions outlined in the original RRS procedure could be used not only for the maize crop, but also for all crop species in which hybrids are used as cultivars; e.g., sun-flower and sorghum.
Non-additive effects (dominance and epistasis) were more important than additive effects for GY and PL which are the main traits in maize breeding programs, and that these results could be attributed to the effects of the RRS. Positive and high SCA values were associ-ated to higher yielding ESC; e.g., the three highest yield-ing ESC presented SCA estimates that ranged from 1.32 to 1.87 t ha–1, showing that dominance and epistatic
ef-fects are more important than additive efef-fects for the de-velopment of outstanding SC. Thus, selection for these traits could only be based on the means of single-crosses assessed in several locations and years, since the SCA effects were more important than GCA effects for GY and PL, and SCA effects interacted significantly with environments,.
References
Aguiar, A.M.; Carlini-Garcia, L.A.; Silva, A.R.; Santos, M.F; Garcia, A.A.F.; Souza Jr., C.L. 2003. Combining ability of inbred lines of maize and stability of their respective single-crosses. Scientia Agricola 60: 83-89.
Bernardo, R. 1991. Correlation between testcross performance of lines at early and late selfing generations. Theoretical and Applied Genetics 82: 17-21.
aEstimates multiplied by 102. nsNon-significant; *p ≤ 0.05; **p ≤ 0.01 by the t test.
Table 4 - General (gˆiand gˆj) and specific (sˆij) combining ability estimates from the diallel analysis for maize plant
lodging (PL) and ear placement (EP).
d e r b n I
s e n i l
1
4 42 43 44 45 46
L
P EPa PL EP PL EP PL EP PL EP PL EP PL EP
1
3 0.59** 0.10ns -0.52** -2.00** -1.14** 1.10** 1.71** 0.00ns 0.18ns 1.00** -0.81** -0.20ns 0.29* 0.00ns
2
3 0.39** -1.30** -0.07ns 1.00** 0.48** 0.60* -0.52** 0.80** 0.14ns -1.90** -0.41** 0.80**-0.12ns -2.40**
3
3 -0.75** -0.40ns 0.14ns -0.10ns 0.33** 0.50ns 0.47**-0.60* 0.30** 0.20ns -0.48** 0.30ns 0.24ns -1.40**
4
3 0.31** 0.80** 0.51** 1.10** 0.15ns -1.70** -0.79**-0.20ns -0.15ns 0.60* -0.04ns -0.60* 0.13ns 5.10**
5
3 -0.07ns -1.10** 0.41** -0.80** 0.10ns -0.60* -0.67** 1.40** -0.18ns 0.20ns 0.42** 0.90**-0.15ns -1.30**
6
3 0.59** -1.80** -0.09ns 1.30** -0.28* -0.40ns -0.14ns 1.00** -0.12ns 0.60* 0.03ns -0.70** 0.33* 0.80**
7
3 -0.56** -1.50** -0.19ns 0.90** 0.18ns 0.70** 0.09ns -0.80** -0.27* 0.30ns 0.75** 0.30ns -0.51** 0.30ns
8
3 -0.49** 5.20** -0.19ns -1.50** 0.19ns -0.30ns -0.15ns -1.50** 0.10ns -1.00** 0.54** -0.80**-0.23ns -1.10**
8 0 . 0
- ns 0.60ns -0.35* -0.50ns 0.08ns 0.70ns 0.55** 0.70ns -0.17ns -1.50** -0.03ns 0.00ns ij
sˆ gˆi
j
Bernardo, R. 1996. Testcross selection prior to further inbreeding in maize: mean performance and realized genetic variance. Crop Science 36: 867-871.
Bernardo, R. 2002. Breeding for quantitative traits in plants. Stemma Press, Woodbury, MN, USA.
Betrán, F.J.; Hallauer, A.R. 1996. Hybrid improvement after reciprocal recurrent selection in BSSS and BSCB1 maize populations. Maydica 41: 24-33.
Bingham, E.T. 1998. Role of chromosome blocks in heterosis and estimates of dominance and overdominance. p. 71-87. In: Lamkey, K.R.; Staub, J.E., eds. Concepts and breeding of heterosis in crop plants. American Society of Crop Science, Madison, WI, USA.
Campos, H.; Cooper, M.; Edemeades, G.O.; Loffler, J.R.; Schussler, J.R.; Ibãnez, M. 2006. Changes in drought tolerance in maize associated with fifty years of breeding for yield in the U.S. corn belt. Maydica 51: 369-381.
Comstock, R.E; Robinson, H.F; Harvey, P.H. 1949. A breeding procedure designed to make maximum use of both general and specific combining ability. Agronomy Journal 41: 360-367. Doerksen, T.K.; Kannenberg, L.W.; Lee, E.A. 2003. Effect of
recurrent selection on combining ability in maize breeding populations. Crop Science 43: 1652-1658.
Eyherabide, G.H.; Hallauer, A.R. 1991. Reciprocal full-sib recurrent selection. I. Direct and correlated responses. Crop Science 31: 952-959.
Ferreira, D.F.; Rezende, G.D.S.P.; Ramalho, M.A.P. 1993. An adaptation of Griffing´s method IV of complete diallel cross analysis for experiments repeated in several environments. Brazilian Journal of Genetics 16: 357-366.
Geraldi, I.O., Miranda Filho, J.B. 1988. Adapted models for the analysis of combining ability of varieties in partial diallel crosses. Brazilian Journal of Genetics 11: 419-430.
Griffing, B. 1956. Concept of general and specific combining ability in relation to diallel crossing systems. Australian Journal of Biological Science 9: 463-493.
Hallauer, A.R. 1990. Methods used in developing maize inbreds. Maydica 35: 1-16.
Hallauer, A.R.; Miranda Filho, J.B. 1988. Quantitative genetics in maize breeding. Iowa State University Press, Ames, IA, USA.
Hallauer, A.R.; Russell, W.W; Lamkey, K.R. 1988. Corn breeding. p. 941-963. In: Sprague, G.F.; Dudley, J.W., eds. Corn and corn improvement. American Society of Agronomy, Madison, WI, USA.
Motto, M.; Moll, RH. 1983. Prolificacy in maize: a review. Maydica 28: 53-76..
Rezende, G.S.P.; Souza Jr., C.L. 2000. A reciprocal recurrent selection procedure outlined to integrate hybrid breeding programs in maize. Journal of Genetics & Breeding 54: 57-66. SAS Institute 2004. SAS®
proprietary software, version 9.12. SAS Institute,. Cary, NC, USA.
Santos, M.F.; Moro, G.V.; Aguiar, A.M.; Souza Jr., C.L. 2005. Responses to reciprocal recurrent selection and changes in genetic variability in IG-1 and IG-2 maize populations. Genetics and Molecular Biology 28: 781-788.
Santos, M.F.; Câmara, T.M.M.; Moro, G.V.; Costa, E.F.N.; Souza Jr., CL. 2007. Responses to selection and changes in combining ability after three cycles of a modified reciprocal recurrent selection in maize. Euphytica 157: 185-194.
Silva, A.R.; Souza Jr., C.L.; Aguiar, A.M.; Souza, A.P. 2004. Estimates of genetic variance and level of dominance in a tropical maize population. I. Grain yield and plant traits. Maydica 49: 65-71.
Smith, J.C.S. 1988. Diversity of United States hybrid maize Germplasm: isozymic and chromatographic evidence. Crop Science 28: 63-69.
Sokal, R.R.; Rohlf, F.J. 1995. Biometry. W.H. Freeman, New York, NY, USA.
Souza Jr., C.L.; Santos, M.X.; Magnavaca, R.; Gama, E.E.G. 1993. Estimates of genetic parameters in the maize interpopulation BR-105 x BR-106 and implications in breeding. Pesquisa Agropecuária Brasileira 28: 473-479
Souza Jr., C.L.; Pinto, R.M.C. 2000. Responses to a short-term reciprocal recurrent selection procedure in maize. Maydica 45: 21-28.
Yu, J.; Bernardo, R. 2004. Changes in genetic variance during advanced cycle breeding in maize. Crop Science 44: 405-410.