Vitor Casadei
Extending User Interface Design Patterns with
accessibility recommendations to guide mobile
developers
Sorocaba, SP
Vitor Casadei
Extending User Interface Design Patterns with
accessibility recommendations to guide mobile developers
Dissertação de mestrado apresentada ao Pro-grama de Pós-Graduação em Ciência da Com-putação (PPGCC-So) da Universidade Fed-eral de São Carlos como parte dos requisi-tos exigidos para a obtenção do título de Mestre em Ciência da Computação. Linha de pesquisa: Engenharia de Software e Gestão do Conhecimento.
Universidade Federal de São Carlos – UFSCar
Centro de Ciências em Gestão e Tecnologia – CCGT
Programa de Pós-Graduação em Ciência da Computação – PPGCC-So
Orientadora: Profa. Dra. Luciana Aparecida Martinez Zaina
Coorientadora: Profa. Dra. Sahudy Montenegro González
recommendations to guide mobile developers / Vitor Casadei. -- 2018. 140 f. : 30 cm.
Dissertação (mestrado)-Universidade Federal de São Carlos, campus Sorocaba, Sorocaba
Orientador: Profa. Dra. Luciana Aparecida Martinez Zaina
Banca examinadora: Prof. Dra. Sahudy Montenegro González, Prof. Dra. Renata Pontin de Matos Fortes, Prof. Dr. Alexandre Álvaro
Bibliografia
1. Mobile Accessibility. 2. Interaction Design Patterns. 3. Virtual Ethnography. I. Orientador. II. Universidade Federal de São Carlos. III. Título.
Ficha catalográfica elaborada pelo Programa de Geração Automática da Secretaria Geral de Informática (SIn). DADOS FORNECIDOS PELO(A) AUTOR(A)
Acknowledgments
I would like to thank my advisor, Dra. Luciana Zaina for the patience, guidance and support over the last couple of years. You have set an example of excellence as a researcher, mentor, instructor and as a friend.
I would like to thank Dr. Toni Granollers for all the help, enthusiasm, encouragement and guidance in this research project.
I would like to thank CAPES for the financial support during this research project.
I would like to thank for the financial support of CAPES and grant#2017/03397-0, São Paulo Research Foundation (FAPESP).
I would like to thank my thesis committee members Dr. Alexandre Álvaro, Dra. Renata Pontin de Matos Fortes for accepting being part of this comittee: your discussion, ideas, and feedback have been absolutely invaluable.
I would like to thank Dra. Sahudy Montenegro González for the valuable friendship and support.
I would like to thank all my colleagues from the research group UXLERIS for the assistance and cooperation during this research project.
I would like to thank all my undergraduate teachers for without them I would not be able to achieve anything.
I would like to thank my friends Rafael, Eduardo, Breno, Mauricio, Mariana, Ian, Camila and many others for all the laughs, fun and joyful moments that we spent together.
“Communication has the power to build bridges, to enable encounter and inclusion, and thus to enrich society.“ (Vatican.va1, Pope Francis)
1
Abstract
With the dissemination of mobile devices and the migration of activities that were once executed only on desktop computers to smartphones and tablets, the concerns related to accessibility in this environments have increased. Accessibility barriers can directly affect the access of information: a user with difficulties on accessing important information can become frustrated, absorbing the content with difficulty or even not being able to assimilate any information. The difficulties encountered by a great variety of users on mobile devices adds new challenges to the task of creating accessible applications for everyone. However, the accessibility impact of mobile interface design patterns in the life of disabled people has not been widely addressed in academic works. At the same time, the community of mobile designers and developers has made significant advances in identifying accessibility issues with design patterns on mobile interfaces, reporting these findings in virtual spaces of discussions as forums and blogs. Against this scenario, this project proposes recommendations that will help to mitigate or eliminate the accessibility barriers created by Interface Design Patterns on mobile applications. These recommendations were created based on two main studies. The first study was an accessibility evaluation based on interaction design patterns in an e-learning application containing 21 participants without disabilities that collected the emotional response to seven design patterns and video analysis using communicability metrics. While the second study aimed to explore the experiences and knowledge of professionals through an ethnographic study in 18 virtual communities of mobile design and development with the goal of identifying issues on the accessibility of Android mobile interface design patterns. This work presents two main contributions. It presents an approach to support the employment of virtual ethnography studies in software engineering as means to observe software development practice based on the information available in online communities. It also proposes 22 recommendations of 11 Interface Design Patterns and 11 Cross-section elements of mobile applications with the goal of improving the overall accessibility of mobile devices.
List of Figures
Figure 1 – Research Flow . . . 21
Figure 2 – Overview of the methodology . . . 33
Figure 3 – A participant performing an activity . . . 36
Figure 4 – Lookback’s interface: video analysis with CEM tags . . . 38
Figure 5 – User satisfaction by Design Pattern . . . 39
Figure 6 – User dominance by Design Pattern . . . 40
Figure 7 – Occurrence of CEM tags by activity. . . 41
Figure 8 – Virtual Ethnography Approach . . . 50
Figure 9 – Example of Memo on Mobile Pagination Interface Design Patterns . . . 68
Figure 10 – Relationships between categories . . . 72
Figure 11 – Relationships of category Navigation . . . 72
Figure 12 – Relationships of category Input . . . 76
Figure 13 – Relationships of category List and Pagination . . . 77
Figure 14 – Relationships of category Icons . . . 79
Figure 15 – On/Off button . . . 80
Figure 16 – Relationships of category Data Tables . . . 81
Figure 17 – Data Table design proposed on “Lessons from building mobile-friendly, accessible data tables” . . . 82
Figure 18 – Relationships of category Select and Dropdown . . . 83
Figure 19 – Relationships of category Sliders . . . 84
List of Tables
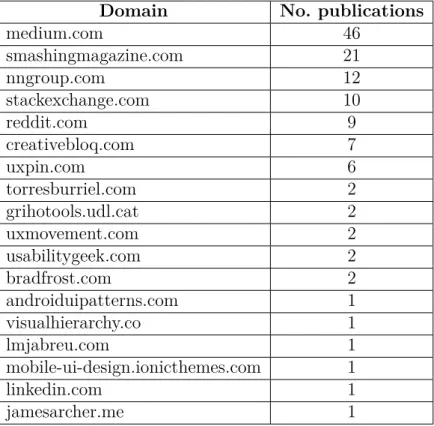
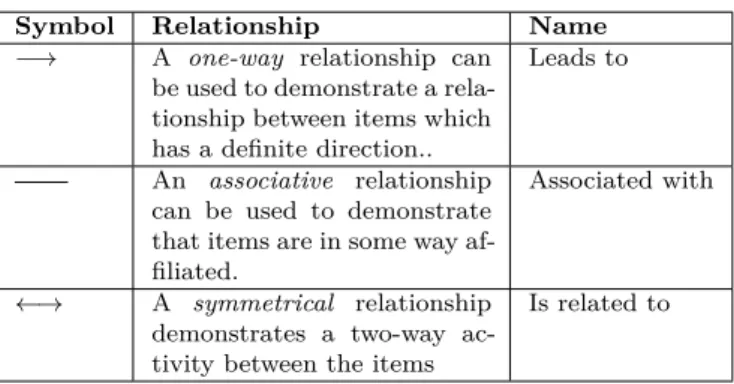
Table 1 – Number of publications by Domain (Information Source) . . . 65 Table 2 – Relationship connectors on Nvivo 11 . . . 67
Contents
1 INTRODUCTION . . . 19
1.1 Research Goals . . . 20
1.2 Methodology . . . 21
1.3 Contributions . . . 22
1.4 Organization . . . 23
2 FUNDAMENTALS AND RELATED WORKS . . . 25
2.1 Accessibility . . . 25
2.2 Design Patterns. . . 26
2.3 Universal Design . . . 27
2.4 Related Works . . . 27
3 EXPLORATORY EXPERIMENT . . . 31
3.1 Preparation and Execution . . . 33
3.1.1 Participants . . . 33
3.1.2 Apparatus and Artifacts . . . 34
3.1.3 Procedure . . . 36
3.2 Analysis . . . 37
3.3 Findings . . . 39
3.3.1 User Perspective . . . 39
3.3.2 Researcher Perspective . . . 40
3.4 Discussion . . . 42
3.5 Conclusions and Contributions . . . 44
4 VIRTUAL ETHNOGRAPHY APPROACH FOR STUDYING ON-LINE COMMUNITIES IN SOFTWARE ENGINEERING . . . 47
4.1 Fundamentals of Ethnography and Virtual Ethnography . . . 47
4.1.1 Virtual Ethnography . . . 47
4.2 Virtual Ethnography Approach . . . 48
4.2.1 1st Step: Planning . . . 49
4.2.1.1 Ethnography Protocol Definition . . . 50
4.2.1.2 Selection of Information Sources . . . 54
4.2.2 2nd Step: Ethnography Execution . . . 55
4.2.3 3rd Step: Data Analysis . . . 56
5.1 Virtual Ethnography in Practice . . . 59
5.2 Contextualization of the research . . . 59
5.3 Pre-planning. . . 60
5.4 Planning . . . 61
5.4.1 Ethnography Protocol Definition . . . 61
5.4.2 Selection of Information Sources . . . 63
5.5 Ethnography Execution . . . 63
5.5.1 Source Exploration . . . 64
5.5.2 Data Selection . . . 64
5.5.3 Data Storage . . . 64
5.6 Data Analysis . . . 65
5.6.1 Grounded Theory process . . . 66
5.7 Findings . . . 69
5.8 Conclusions . . . 69
6 INTERACTION DESIGN PATTERN ACCESSIBILITY . . . 71
6.1 Interface Design Patterns . . . 71
6.1.1 Navigation . . . 72
6.1.1.1 Description . . . 73
6.1.1.2 Accessibility Barriers . . . 73
6.1.1.3 Recommendations . . . 74
6.1.2 Hamburger Menu . . . 74
6.1.2.1 Description . . . 74
6.1.2.2 Accessibility Barriers . . . 74
6.1.2.3 Recommendations . . . 74
6.1.3 Tab Navigation . . . 75
6.1.3.1 Description . . . 75
6.1.3.2 Accessibility Barriers . . . 75
6.1.3.3 Recommendations . . . 75
6.1.4 Input . . . 76
6.1.4.1 Description . . . 76
6.1.4.2 Affected Barriers . . . 76
6.1.4.3 Recommendation . . . 77
6.1.5 List and Pagination . . . 77
6.1.5.1 Description . . . 77
6.1.5.2 Accessibility Barriers . . . 78
6.1.5.3 Recommendations . . . 78
6.1.6.1 Description . . . 79
6.1.6.2 Accessibility Barriers . . . 79
6.1.6.3 Recommendations . . . 80
6.1.7 Data Tables . . . 80
6.1.8 Description . . . 80
6.1.8.1 Accessibility Barriers . . . 80
6.1.8.2 Recommendations . . . 81
6.1.9 Select and Dropdown . . . 83
6.1.9.1 Description . . . 83
6.1.9.2 Accessibility Barriers . . . 83
6.1.9.3 Recommendations . . . 83
6.1.10 Sliders. . . 84
6.1.10.1 Description . . . 84
6.1.10.2 Affected Barriers . . . 85
6.1.10.3 Recommendations . . . 85
6.1.11 Carousel. . . 86
6.1.11.1 Description . . . 86
6.1.11.2 Affected Barriers . . . 87
6.1.11.3 Recommendations . . . 87
6.2 Cross-Sectional Elements . . . 87
6.2.1 Contrast . . . 88
6.2.2 Color . . . 89
6.2.3 Content Accessibility . . . 90
6.2.4 Screen Readers . . . 92
6.2.5 Universal Accessibility. . . 93
6.2.6 Text and Fonts . . . 94
6.2.7 Tap/Touch area. . . 95
6.2.8 Zoom of Content . . . 95
6.2.9 Gestures. . . 96
6.2.10 Errors . . . 97
6.2.10.1 Error Prevention . . . 97
6.2.10.2 Error Handling . . . 98
6.2.11 Links and Buttons . . . 98
6.3 Conclusions and Contributions . . . 99
7 CONCLUSION . . . 101
7.1 Contributions . . . 103
APPENDIX A – LIST OF DOCUMENTS SELECTED IN THE
VIR-TUAL ETHNOGRAPHY . . . 113
APPENDIX B – CHARACTERIZATION FORM . . . 119
APPENDIX C – ACCOMPANIMENT FORM . . . 123
APPENDIX D – OBSERVATION FORM . . . 135
19
1 Introduction
For a long time Accessibility has been one of the focal points on Software Develop-ment along with Usability and User Experience. There are initiatives, such as the World Wide Web Consortium (W3C), that define guidelines for Accessibility on the web. The most common example is the Web Accessibility Initiative (WAI) which define accessibility recommendations for the web on desktop and mobile devices (HARPER; THIESSEN; YESILADA, 2014). The initiative also supports the study and development of solutions that help to improve the use of mobile devices as a mean of social integration, by over-coming the problems and difficulties that users might face when using mobile devices (KAPLAN; HAENLEIN, 2010).
It’s also not new that the use of mobile devices for Internet Browsing has increased around the world and in some contexts these devices even started to replace personal computers and laptops due to the more attractive cost and the mobility and convenience provided. Currently in Brazil, 93 million of people own a smartphone and 68 million use the mobile device for Internet browsing according to a research released in 2016 (NIELSEN, 2016). With a population of 200 million, this means that a quarter of the population accesses the Internet through a mobile device and new research indicates that as the number of smartphones in Brazil has increased 112% since 2010, it’s expected a greater increase until 2020 (MAZETTO, 2015).
Although there are guidelines that help to improve accessibility issues on mobile, these recommendations are mostly abstract (BRAJNIK, 2006). The user interface interac-tion is essential for accessing any content and in many cases problems with the interface may lead to Accessibility Barriers (BRAJNIK,2008), which are conditions that make it difficult for people to achieve a goal when using the web on mobile or desktop devices. Therefore, the interaction of the user with a mobile interface needs to be deeply explored in terms of Accessibility aiming to mitigate the accessibility barriers so that any user will have access to information available in the web.
creating solutions that comply with the needs of the widest possible range of situations and for all audiences so that any person may use the same interface and have access to the same content (MCGUIRE; SCOTT; SHAW, 2006).
In this context, the accessibility barriers faced by users with disabilities in desktop platforms are also faced by users of mobile devices (YESILADA; BRAJNIK; HARPER, 2011a). And while smartphones provide mobility, convenience and access to information, there are physical characteristics and characteristics related to the context of use of the technology that hinder the access to information such as the small size of the screen (and the wide range of resolutions), processing limitations, Internet signal shortages and
difficulties in entering information and navigation.
Interface Design Patterns (NILSSON, 2009) can be used as means to assess ac-cessibility of mobile interfaces. Design Pattern is an interface element, that is a widely used concept on Software Development (RIBEIRO; CARVALHAIS,2012a) and there are several Design Pattern libraries available for consultation. These patterns are defined on what already exists and what works in specific situations, however, sometimes these patterns are not given much importance in terms of user interaction with the pattern and the usability and accessibility aspects that comes along.
Given the exposed context this masters project evaluates the accessibility of Mobile Interaction Design Patterns under the perspective of Universal Design in order to contribute to developers and designers by identifying Accessibility Barriers related to common patterns and giving recommendations on how to avoid or minimize the barriers to any target group. It is believed that the results of this project will contribute to the Human Computer Interaction (HCI) area on accessibility for mobile and will be easily extended to other Design Patterns.
In order to identify the accessibility barriers related to the Interface Design Patterns and understand how these accessibility issues are addressed by designers and developers, the technique of Virtual Ethnography was chosen. Ethnography is a common research method recognized as a qualitative approach to understand social groups and work practices (SHARP; DITTRICH; SOUZA, 2016), thus, the use of Virtual Ethnography is fitted to the goal of this research as it helps to comprehend how the community of designers and developers deals with accessibility barriers on Mobile Interface Design Patterns.
1.1
Research Goals
1.2. Methodology 21
Patterns adding recommendations about the barriers that the pattern could insert into the interaction. This project investigated Accessibility Barriers present in a selected set of Interaction Design Patterns from the Android platform, however, it’s easy to extend this research to all Interaction Design Patterns.
As specific goals of this research project, can be highlighted:
• An investigation on the accessibility impact that the implementation of Interaction
Design Patterns can have on mobile devices;
• A study on the use and understanding of mobile Interaction Design Patterns;
• A study to understand the solutions for common accessibility barriers related to
mobile Interaction Design Patterns by the community of developers and designers;
• Propose recommendations regarding the Interaction Design Patterns in terms of
accessibility.
1.2
Methodology
In order to achieve the proposed objectives, this study was conducted using bib-liographic research, exploratory study and virtual ethnography (WOHLIN et al., 2012; CHARMAZ, 2014).
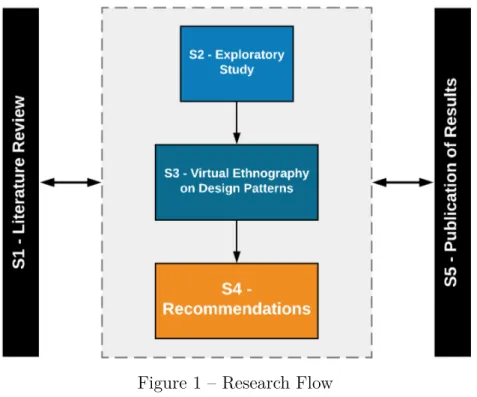
Figure 1 – Research Flow
S1 - Literature Review: a literature review study about the main topics involving
this project as a form to identify the state of the art, new trends and discoveries in the research field. This step was continuous through the research project so that the bibliography and related works are up to date and relevant.
S2 - Exploratory Study: this steps contains the elaboration and execution of a user
experimentation. The outcomes of the study supported the identification of the main design patterns which insert barriers of accessibility.
S3 - Virtual Ethnography on Design Patterns: an investigation on blogs and
forums of developers and designers that shall bring more light on accessibility barriers related to Design Patterns.
S4 - Recommendations: This step considered the results of S2 and S3 in order to
outline the approach of this project.
S5 - Publication of results: this step was used for the publication of the results
through scientific papers, conferences, project reports and the master dissertation.
1.3
Contributions
Through the related works, the exploratory study on the accessibility of the Interaction Design Patterns on mobile applications and the virtual ethnographic study, the contributions listed below were obtained:
• Elaboration and execution of a study with end users to survey the problems of
interaction with mobile design patterns. Besides the findings, the study design allows its replication;
• Systematization of a process for the execution of virtual ethnography through the
adaptation of the foundations of traditional ethnography and the inclusion of new elements;
• Survey of problems with interaction mobile design pattern through the execution of
a virtual ethnography in virtual communities;
• Qualitative and in-depth analysis of the problems encountered;
• Elaboration of recommendations based on accessibility problems encountered.
• Publication: "CASADEI, V. et al. Accessibility evaluation of design patterns on
1.4. Organization 23
• Publication: "CASADEI, V.; GRANOLLERS, T.; ZAINA, L. Investigating
ac-cessibility issues of ui mobile design patterns in online communities: A virtual ethnographic study. In:Proceedings of the XVI Brazilian Symposium on Human Factors in Computing Systems.New York, NY, USA: ACM, 2017. (IHC 2017), p. 33:1–33:10." (CASADEI; GRANOLLERS; ZAINA,2017)
1.4
Organization
This dissertation consists of seven (7) chapters involving an introduction to the work produced during the master’s project, related works, presentation of two studies and conclusions.
On Chapter 1, an introduction to the main topics relevant to this study are presented, as well as the methodology and research goals.
On Chapter2important concepts are explained and the state of the art and related works to this research are presented. On Chapter3an exploratory experiment is presented, in this chapter a study on a mobile application was performed and the results are discussed.
On Chapter4 an approach to conduct virtual ethnography on online communities is presented as an extended guide to aid researchers on similar ethnographic studies. On Chapter 5a virtual ethnography study is presented and discussed.
Chapter 6presents the findings of the ethnographic study and recommendations for the implementation of interaction design patterns on mobile applications with the goal of mitigating accessibility barriers introduced with the design patterns.
25
2 Fundamentals and Related Works
This chapter presents the main concepts, fundamentals and related works of this project. The search and gathering process of these related works was based in two main strategies: manual search and search for keywords.
The manual search for related works was done by exploring known conferences and scientific journals on the area of Human-Computer Interaction (HCI) such as the
Conference on Human Factors in Computing Systems (CHI) e o Brazilian Symposium on Human Factors in Computing Systems (HCI Brazil) as well as the International Journal of Human-Computer Studies. On the other hand, the search by keywords was performed in well known electronic scientific databases such as Google Scholar1, ACM Digital Library2, Scopus3, IEEE Xplore4 and Web of Knowledge5. Thus, this section compiles important works used in the development of this masters project.
The following keywords were used (among others) in the process of searching for related works: Mobile Accessibility, Accessibility Studies, Accessibility Guidelines, Universal Design, HCI Accessibility, Mobile Interaction Design Patterns, Ethnography, Virtual Ethnography and Accessibility Research.
2.1
Accessibility
The Web Accessibility Initiative (WAI) of the World Wide Web Consortium (W3C) (HARPER; THIESSEN; YESILADA, 2014) presents guidelines, strategies and resources
related to accessibility in various contexts. However, some guidelines defined by W3C are not applicable or adapted to mobile applications and as the web become more mobile and ubiquitous, the need for accessibility in any context and device is urgent (ABOU-ZAHRA;
BREWER; HENRY, 2013).
Existing standards and guidelines (such as WCAG from W3C) do not give clear instructions for designers on how to design accessible solutions nor give developers instruc-tions on how to create accessible systems. Because of this, in most situainstruc-tions, developers try to make a website accessible by simply adapting the software only at the end of the development, which tends to the existence of accessibility gaps and increased cost in the final product (NEWELL; GREGOR, 1988).
1
Link: scholar.google.com.br/
2
Link: dl.acm.org/
3
Link: www.scopus.com/home.uri
4
Link: ieeexplore.ieee.org/
5
Alongside the impairments and accessibility barriers that users encounter while using a website, their mood is directly related to the overall experience and the accessibility of a website or app is beneficial for everyone as it improves the usability for every user. This is shown byPascual et al. (2013) (PASCUAL et al., 2013) in a study conducted with 13 participants that who were blind or low-vision users and also users without disabilities. The goal of the study was to record the mood of the users (in terms of interaction efficiency, effectiveness and satisfaction) while using websites with and without accessibility barriers and the results showed the elements with the highest rate of frustration on each group of users.
Another important factor is that people with disabilities are not the only ones that have problems using websites and mobile devices, as there is an exponential growth of the elderly population in the world that suffers from a wide variety of disabilities developed by the advanced age (LEME; ZAINA; CASADEI, 2015). In the mobile context such users have even more difficulties, as they mostly are not used to mobile technology and with the attention on this group of users, a set of guidelines was collected from various sources of the literature and presented byDíaz-Bossini e Moreno(2013) (DÍAZ-BOSSINI; MORENO, 2013) in order to help designers and developers to better understand and to build solutions that meet the needs of this growing parcel of the population.
2.2
Design Patterns
The concept of Design Pattern was first developed in the architecture field in the late 1970s with the goal of being components of language that can be used as dialog about organizations and development process. Although the concept was born on a very different field, it can be easily applied to software and interactive design. Design Patterns can be understood as best practices or some sort of heuristics of well knows design problems and its solutions as presented on the work of Hoober e Berkman (2011) (HOOBER; BERKMAN, 2011) in 76 patterns organized in 13 categories.
As there are many classifications and specific applications for Design Patterns, many studies are made on individual categories of patterns as the work presented by Sampaio(2013) (SAMPAIO, 2013) in which a tool was developed to automatically adapt web sites navigation menu in different contexts of screens, resolutions and devices according to common menu design patterns that are organized into two orders of navigation: simple navigation and multi-level navigation.
2.3. Universal Design 27
in mobile and web design with the objective of helping designers and developers to design mobile and web interfaces. The patterns defined are later applied to three case studies in order to ascertain about their usefulness and applicability.
2.3
Universal Design
Universal Design is the process of developing a system or product that can be used by any person with any ability, in any situation or environment. In HCI, Universal Design is mainly related to accessibility in the development of computer systems for people with and specially for people without disabilities in situations that can limit the ability to see, hear, understand, concentrate and control motor movements (HENRY; ABOU-ZAHRA; BREWER,2014). It is important to point out that many accessibility barriers faced by people with disabilities also are witnessed by other users, however, for disabled people, accessibility is essential in order to actually have access to information, while people with situational accessibility, this concern is mere convenience (HEUMANN,1998).
In order to present better understatement to designers and developers in the development of accessible systems by comparing problematic situations with real life conditions, Fogli, Provenza e Bernareggi(2014) (FOGLI; PROVENZA; BERNAREGGI, 2014) presents a design pattern language for accessibility based on W3C specifications and concerned with general design methods of universal access to support designers and developers since the beginning of the development and design process.
2.4
Related Works
In the academic area mobile devices present a great potential to improve the learning experience of any student by providing mobility and easy access to information alongside several benefits in one device. In order to determine the existence of academic mobile applications that aids visually impaired users and to understand the usage of these applications, a systematic review was performed in the work of Silva, Braga e Damaceno (2015) (SILVA; BRAGA; DAMACENO,2015). As a result of this work, it was identified that the accessible mobile applications had the impact of rehabilitation and educational inclusion of visually impaired users and that this could be applied to users with other types of disabilities as well.
description of images and other media files and transcripts or alternative text of video and audio contents. A similar approach focused on persons with visual impairment is presented byUlbricht et al. (2012) (ULBRICHT et al., 2012).
Many efforts have been made in the challenge of improving accessibility on mobile devices for users with different disabilities.Díaz-Bossini e Moreno (2014) (DÍAZ-BOSSINI; MORENO, 2014) present a valuable set of guidelines to achieve accessibility in mobile interfaces for elderly users as a result of a literature review study of academic works, standards and best practices of mobile web design. Also as people with disabilities are often excluded from the society by not having access to information through technology (and older people are included in this group), the guidelines were compared with a survey of three mobile Android apps, that were advertised as accessible, where all applications showed accessibility problems.
Some efforts have been developed aiming to solve accessibility gaps to visually impaired users. A literature review was carried out resulting in the mapping of 65 existing accessibility problems in the interaction with mobile devices (DAMACENO; BRAGA; MENA-CHALCO,2017). The accessibility issues were classified in seven groups of problems which contributed to the establishment of a set of recommendations to improve accessi-bility. Concentrating on visually impaired issues, Color Vision Deficiency (CVD), which means the difficulty or inability recognize a certain color or to perceive color differences, can be seen as another important disability that affects many people in the world. A solution that adapts colors preserving properties of the original colors was proposed by Zhou, Bensal e Zhang(2014) (ZHOU; BENSAL; ZHANG, 2014).
Concerning on accessibility issues for elderly, a usability testing of three mobile applications exploring navigation and interaction of older users was conducted. The evaluation results led the authors to propose recommendations regarding the design of mobile applications for older adults (BARROS; LEITãO; RIBEIRO, 2014). Similarly, Leitao e Silva(2012) (LEITAO; SILVA, 2012) investigates the optimal target and spacing size between elements in mobile applications intended for older adults. In the study, the gestures of tap and swipe were used by 40 older users in two tasks on a mobile application. From the data collected in the experimentation, the authors recommended appropriate implementations of large tap and large swipe targets for the use of mobile applications by the elderly.
2.4. Related Works 29
flexibility in time and space. It’s also important to remember that assistive technologies do not remove all the accessibility barriers of a system as some barriers are created by the lack of study and knowledge during the design.
On Virtual Ethnography the work published on software engineering and computing related practices is not numerous. However, important works have been published as the ethnographic study conducted on e-learning context that analyzed the experience of students to understand the relation between the effectiveness of the learning methods with the motivation of the students (KRUGER, 2006). And the study conducted on online message boards by Steinmetz (2012a) (STEINMETZ,2012a) that aimed to better understand the topics of space, identity and ethics on virtual ethnography by exploring these issues on an actual virtual ethnography study.
Virtual ethnography shifts the location of observation to online spaces adapting the classical ethnography directions (BOELLSTORFF,2012). Sharp, Dittrich e Souza(2016) (SHARP; DITTRICH; SOUZA, 2016) suggest five dimension which aid the researcher in
the planning of an ethnography: (a) participant and non-participant observation (levels of participation between only observation and total participation (HINE,2008)); (b) duration of the field study; (c) space and location; (d) use of theoretical underpinnings to support the conduction and the analysis of results; and (e) the ethnographers’ intent in undertaking the study. In virtual ethnography, the first puzzle that the researcher must face is choosing a participation role in the research. While some researchers in the literature may agree that some degree of participation is necessary, the nature of the community may force the researcher to adopt an observer or hybrid position in the study (HINE, 2008).
Lastly, one important work on virtual ethnography analyzed online message boards conversations in the online community with focus and detail on three specific aspects of the research method: space and time, identity and authenticity, and ethics (STEINMETZ, 2012a).
The previous works present several approaches to the problem of mobile accessibility, however they present limitations that this work sought to approach. The work of Silva, Braga e Damaceno (2015) on the impact of mobile application in the inclusion of visual impaired users is extremely rich, however, it does not present a general approach to accessibility. Similarly, the work of Gabrielli et al. (2005) and (ULBRICHT et al., 2012) are strongly tied to the W3C guidelines and therefore cannot be fully extended to mobile devices.
the problem of accessibility on e-learning platforms.
31
3 Exploratory Experiment
Prior to the virtual ethnography, it was sought to understand in a practical manner which interaction design patterns produced accessibility problems on mobile interfaces. For this, an experimental study (LAZAR; FENG; HOCHHEISER, 2017) was conducted. Firstly, the type of application was chosen to be used in the experiment and thereafter the target audience.
Mobile Learning (M-learning) is an approach to e-learning where mobile devices are used to access educational content. Considering that traditional LMS (Learning Management Systems) were created before the dissemination of mobile devices with Internet access, there is a gap that has not been filled on exploring the application and adaptation of these systems on such devices as a way to motivate students to perform educational activities and in the exploration of new patterns of interaction (GUTERRES; SILVEIRA, 2015) as accessibility and usability studies have mainly been made on Moodle desktop (BARBOSA; OLIVEIRA; PENNA, 2015; SANTANA; NETO; COSTA, 2014).
Accessibility in e-learning is the ability of the learning environment to adjust to the needs of any learner with any disability (JEMNI; LAABIDI; AYED, 2014), which involves content presentation and interaction. Also, it’s important to consider the impacts of mobile learning in the life of students and educators as presented by Abachi e Muhammad (2014) (ABACHI; MUHAMMAD,2014).
In Education, mobile devices can be useful to enhance and support the learning experience of the disabled user and the adaptation of content to accessible by anyone. This adaptation brings several advantages to e-learning systems that complement the traditional education system as recorded classes and materials in video or audio and use of forums for discussion at any time, anywhere (MOURAO; FREIRE; SILVA,2013).
The Web on the context of learning system has been a great channel for dis-semination of information and communication. Now it’s possible to attend to university classes from thousands of kilometers of distance and to graduate without having to leave the comfort of home, it has brought access to education in areas of difficult. M-learning (GEORGIEV; GEORGIEVA; SMRIKAROV,2004) systems are platforms accessed through mobile devices and this change of perspective from desktop to mobile is another channel for learning and presenting information (ALLY; PRIETO-BLÁZQUEZ, 2014). On the other hand not all learning systems are well adapted to mobile interaction and many of them in general have serious accessibility issues that can insert barriers in the learning process, which discourages students and users of such platforms (HASHEMI et al.,2011).
potential that can improve the learning experience of students by providing mobility and easy access to information. In Brazil (and in many countries) the most used M-learning system is Moodle which has more than 76000 sites over 230 countries (MOODLE.ORG, 2016).
Whilst Universal Design can be described as a framework that assists the design of environments and products, the Universal Design for Learning (UDL) is presented as a framework for the development of teaching strategies that encourage equal opportunities and in this context the M-learning emerges as an opportunity to promote inclusive, user-centered and democratic education as pointed out in the research developed byTavares et al. (2015) (TAVARES et al.,2015) that reviews the literature on Universal Design applied to education and M-learning.
In order to understand and evaluate the interaction design patterns’ accessibility on mobile adaptations, an exploratory study was planned.
The goal of this study is to present the results of an accessibility evaluation of interaction design patterns on m-learning platforms from emotional assessment of users without disabilities in the mobile application for Moodle. In the evaluation 21 participants performed 5 tasks on the mobile application that were recorded and later analyzed in order to identify possible accessibility barriers in the use of certain interaction design patterns.
The study presented in this chapter also suggests a methodology of evaluation that is interested in both the user and researcher’s perspective and highlights common accessibility problems faced by users without disabilities in the mobile scenario through interaction design patterns. As a result of this study we have also identified accessibility barriers related to common interface elements, which are mapped to interaction design patterns and can serve as an input for future studies on mobile elements with users with disabilities in the e-learning scenario.
The choice of M-learning systems as domain case study in this research was not random, possible accessibility problems can spoil the learning experience of many disabled people that cannot access information due to accessibility barriers. The study and discussion of the impacts of these problems on education is a desired achievement, but not the main purpose of this project.
The methodology of the study consisted of three phases with the execution of an experiment on a controlled environment (LAZAR; FENG; HOCHHEISER,2017) and the general overview is shown in Figure2.
1. Preparation - In this phase several mobile design patterns were analyzed together
3.1. Preparation and Execution 33
Moodle application presented at the moment with eyes on the design patterns of the interface.
2. Execution - Here all the questionnaires were designed and the experiment was
performed in a controlled environment. The users should execute the 5 activities that were compiled in the previous phase and give their feedback while being recorded.
3. Analysis - With the data collected from the previous phases, there are two
per-spectives to be analyzed: the user’s and the researcher’s. The discussion, results and implication of this analysis is presented in this article.
Figure 2 – Overview of the methodology
3.1
Preparation and Execution
The following subsections present the main elements of the study.
3.1.1 Participants
not have identified disabilities, were undergraduate students and had a smartphone. When asked about the experience using mobile devices (smartphones or tablets) 78% stated to have 4 or more years using a device and only 4.3% had only two years of experience (the rest was in between). Also the daily usage (in hours) of mobile devices was around 2 to 8 hours and the daily usage of Internet around 2 to 5 hours.
Although all participants used their mobile device to access the Internet, only 30.4% actually preferred the mobile device over a PC to access web content and when asked to describe situations that influenced this preference we received many answers like "I can’t find information or navigate in some websites", "The buttons are too small", "I can’t understand the meaning of some icons in some sites" or "I have difficulties accessing my grades on the smartphone". Another important information is that all participants were users of Moodle and 48% accessed up to 3 times a week and 13% accessed Moodle daily in a mobile device.
The participants were students of a chemistry class and were chosen randomly by volunteering to participate in the research and in this initial study we have chosen participants without disabilities in order to identify accessibility barriers in Design Patterns that affect such users and doing so further explore in other experiments the affect of these barriers in different participants (with different types of accessibility) using Moodle on a mobile device.
The teacher of the chemistry class uses the desktop version of Moodle provided by the University of blind review in his class and the students were accustomed to perform the operations that were requested to be performed in the mobile version of Moodle. The tasks were chosen with the help of the teacher while preparing the activities that were related to the class material.
3.1.2 Apparatus and Artifacts
The experiment was performed in a laboratory of the Department of blind review of the University of blind review. There were used five different mobile devices, all of them with Android operating system (Nexus 5, Moto G, Moto E, Galaxy S4 and a Tegra Note tablet), screen size varying from 4 to 7 inches and Android version 5 or above. All devices had a clean desktop, containing the same keyboard layout, connected to the Internet and to a power source and had the two applications that were used in the experiment installed: the Moodle Mobile1 and the Lookback2 apps.
The mobile devices and questionnaires were distributed in separate desks in the laboratory and the participants were seated in 5 different locations with a comfortable space between them in order to provide privacy in the execution of the experiment.
1
www.download.moodle.org/mobile
2
3.1. Preparation and Execution 35
Each participant received a copy of the Terms of Consent for image and data usage, an Accompaniment questionnaire (AppendixC) containing the description of the activities and questions related to each activity and a page with screenshots of the Moodle Mobile application grouped by each task containing enumerated elements of interface and a mobile device tat was assigned randomly to each participant. The experiment had the participation of 4 observers that would be distributed between the participants and monitor their actions by taking notes of problems and difficulties that occurred during the experiment (Appendix D).
The Accompaniment questionnaire (AppendixC) consisted of five activities and, for each activity, the participants would evidence their satisfaction and feeling of dominance (that should be indicated in a scale of one to nine based in the Self-Assessment Manikin (SAM)) about interface elements that were highlighted and enumerated in the page with Moodle Mobile screenshots. The observers were instructed to not interfere in the participant’s interaction and the participants were told to perform all activities and ask for help from the observer only when strictly needed.
The participants were also asked to fill a form where demographic and general infor-mation about usage of mobile devices and e-learning systems were collected (Appendix B) and presented in this section in order to characterize the participants.
The Lookback application that was also installed in each device was used to collect video data of the experiment in order document the participant’s interaction with the screen and to capture their facial expressions using the front camera of the mobile devices.
All sessions were recorded using the mobile app Lookback3 that records the screen interaction and video and sound from the front camera of the mobile devices. The recordings would start in the beginning of each sessions and end when the participants would signal the completion of all activities. Each recording was identified by the participants unique login information in the platform and were uploaded to a cloud platform also provided by the Lookback service. These recording would be used again the the analysis phase as described in Section 3.2.
All 4 observers that participated in this study are master’s students in the field of Human Computer Interaction (HCI) and two of them had experience working with accessibility on mobile devices. The other two develop research in the usability area (also on mobile devices). For the experiment a new installation of Moodle version 3.1 was performed in a server using the default theme. This was needed due to the fact that the Moodle Mobile app present some limitations with older versions of Moodle.
3
3.1.3 Procedure
The 21 participants performed the experiment in 5 sessions (4 with five participants each and the last one with one participant only) due to the number of mobile devices available for the experiment (5 devices), which means that, apart from the last session, the devices were used evenly by the participants during the sessions. Figure 3illustrates a participant performing an activity during the experimentation alongside with the artifacts described in the previous section.
Figure 3 – A participant performing an activity
In the beginning of each session the participants received general information about how to use the artifacts provided, how to fill the forms and what activities they should perform. It was given special attention to the explanation of the Self-Assessment Manikin that was applied in the Accompaniment questionnaire. The participants were also asked to think aloud about their progress, doubts and problems while performing the tasks.
The SAM is a non-verbal pictorial assessment technique that aims to measure emotion in terms of satisfaction, arousal and dominance that are associated with the reaction of a person to some sort of stimuli (BRADLEY; LANG, 1994). The SAM technique used in this experiment aimed to capture only the participant’s satisfaction and dominance of each element of interface that was actually used by the participant. The icon representation of both satisfaction and dominance was adapted from the original version as can be seen in Figures5 and 6.
3.2. Analysis 37
sending a private message; in the fourth activity the participant should find and read a chapter of a chemistry book; finally in the last activity the participant would answer a question about an upcoming event of the class.
The participants were advised to freely perform the tasks without any intervention or any tips on how to perform an operation or screens that should be used. At the completion of each activity they would indicate their satisfaction and dominance of some selected interface items that were highlighted and enumerated for each activity (the participants should do this only for the elements that they used during the task). On each task the participants were also asked to report any difficulties or problems of usage or understatement of any interface element and they were also asked to inform their level of agreement in a Likert scale on the number of steps and localization problems in the general execution of the task.
At the end of the experiment, each participant was asked to give feedback on the execution of the experiment and also about the satisfaction with the adaptation and usage of the Moodle e-learning system on mobile devices.
3.2
Analysis
The data collected after the experiment contained the satisfaction and dominance of each participant about to the studied interface elements. A work of mapping and grouping the interface elements into mobile interaction design patterns was then performed by analyzing each element with the help of the patterns presented by (HOOBER; BERKMAN, 2011) and (RIBEIRO; CARVALHAIS, 2012b;RIBEIRO,2012).
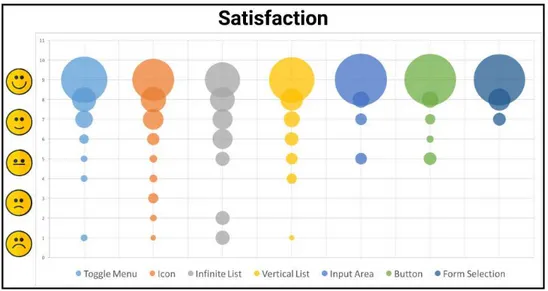
After mapping and grouping the interface elements into design patterns from the data collected in the SAM questionnaire, we had identified 7 main design patterns used by the participants that are Toggle Menu, Icon, Infinite List, Vertical List, Input Area, Button and Form Selection and collected the satisfaction and dominance for each of the seven design patterns. This data is represented in two bubble charts: one for satisfaction (Figure 5) and another for dominance (Figure 6).
Another output of the experiment was the recording of the screen and front camera video of the mobile devices during each session for every participant. With the recording (and because the participants were asked to think aloud) it was possible to better understand the interaction with the interface and which problems each user had encountered and how they performed each one of the activities. With this, it was possible to analyze in deeper detail the interaction with the Moodle Mobile app and identify situations that could not be perceived by the observer during the session.
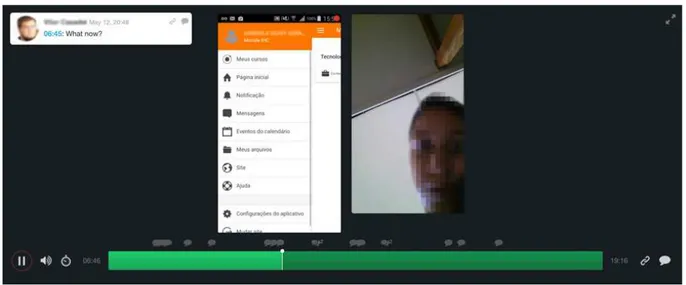
used to record screen and front camera of the devices. With the cloud platform we could identify each participant by the video, add tags and comments into the recording, identify the duration that each participant took to perform the 5 tasks and discuss these findings. The interface of Lookback as a collaborative tool can be seen on Figure 4.
Figure 4 – Lookback’s interface: video analysis with CEM tags
To catalog and analyze the recordings we used the Communicability Evaluation Method (CEM) tags (CAPELÃO et al.,2011) as communicability directly impacts in the understanding of the user about the interface and therefore impacts in accessibility and usability because if a user had problems communicating with an interface, he will have problems using and understanding the same interface. However, we did not use the whole CEM method, but only used the tags in order to identify accessibility problems during the interaction with the interface that are presented as communicability ruptures.
The tags were chosen because it was possible to easily add comments in parts of the recordings in the Lookback platform, due to the possibility of grouping the problems identified with the technique and because the tags of the CEM method are widely used and make the analysis process easier. The tagging process was a collaborative work performed by two evaluators in the cloud platform. In order to achieve more reliable results and instigate the discussions of issues encountered by the participants, each evaluator would tag all videos and discuss the tags of the other evaluator when having doubts or some observation to add. Doing so, each video recording was analyzed twice.
3.3. Findings 39
3.3
Findings
After the analysis of the results of the experiment we could analyze and discuss the findings of this study. This section presents the point of view of the participant that answered the SAM questionnaire and the point of view of the researcher related to the observation form and video analysis with CEM tags presented in Section 3.2.
3.3.1 User Perspective
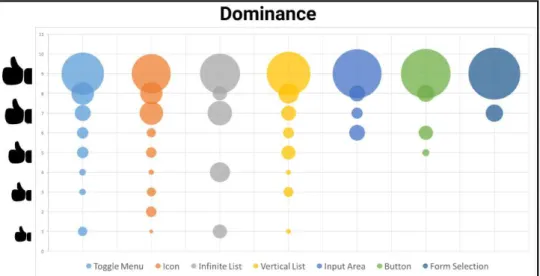
The user perspective contains the satisfaction and feeling of dominance that were indicated by the participants in the SAM questionnaire. By looking at Figure 5 that presents the data distribution of satisfaction for the seven design patterns we can observe that three of the patterns (Input Area, Button and Form Selection) did not have negative scores of satisfaction (below 5) and had a high concentration of positive scores around 9 and 8. The same scenario can also be observed in Figure 6 about the dominance of these patterns.
On the other hand, it is possible to see a higher incidence of negative scores of both satisfaction and dominance on the other four design patterns (Toggle Menu, Icon, Infinite List and Vertical List). These patterns still have high satisfaction and dominance, however we can see that the scores are distributed in the scale, which means that some of the participants were not satisfied or had trouble using such elements.
Figure 5 – User satisfaction by Design Pattern
Figure 6 – User dominance by Design Pattern
It is also clear that the same patterns that had poor satisfaction also had higher incidence of negative dominance, which means that the overall emotion of the participants while using these patterns was negatively affected.
3.3.2 Researcher Perspective
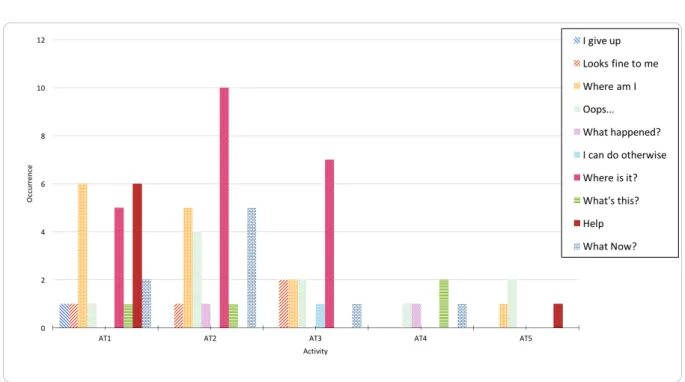
In contrast to the user perspective, the researcher perspective is oriented by activities and not by patterns, although the correlation with the user perspective can be easily noticed. Activity 1 had the highest occurrence of the Help tag which can be explained by the fact that it was the first contact with the application and many questions about localization would arise. Also, when comparing to the SAM results of the design patterns and the video recording, it is possible to understand that due to the fact that to complete the task the participants needed to navigate through the menu (Toggle Menu) of the application, they would not know which options would be available in the menu and which screens would be presented on each item.
Still on the first activity, there is a significant high occurrence of Where am I? and Where is it? tags, which reinforces the argumentation that the users had difficulties understanding their localization in the app, which actions they should perform to complete the first activity and what operations were available.
3.3. Findings 41
Figure 7 – Occurrence of CEM tags by activity
In the third activity the participants should look for a specific student and send a private message and one way of doing this was to iterate over an infinite list to find the student. In Figure 7 we can see that this activity had a high occurrence of the Where is it? tag, which means that the participants had difficulties using the infinite list and finding the specific item of the list (that was conveniently located near the end of the list). By looking at Figures 5and 6it is possible to identify that the Infinite List pattern had the worst satisfaction and dominance signed by the participants, which means that they had trouble using the design pattern, which negatively affected their interaction and the completion of the activity.
The fourth and fifth activities did not present high occurrence of any tag, but some isolated cases of What’s this?, Oops and Where am I? tags. This can be explained by two factors: (i) these activities where the last ones and by the time the participants had completed the first three, they already had explored great part of the applications and had an idea of where to look and what to do and (ii) the design patterns related to three activities were the ones with highest rates of satisfaction and dominance (Input Area, Button and Form Selection), which leads to the conclusion that the users were used to the adaptation of these patterns on mobile devices.
3.4
Discussion
From both user and researcher perspectives it can be observed that there weren’t identified major problems with the patterns Input Area, Button and Form Selection. One of the reasons for this to happen is that these patterns are well known interface elements that can be found in most web pages and thus, the participants were used with the mobile adaptation of such elements as reflected with positive satisfaction and dominance and also by the lack of CEM tags identified in the videos and problems related by the observers which indicates low accessibility problems.
On the other hand, the Infinite List pattern: this patterns presented lower satisfac-tion and dominance amongst the participants and a high concentrasatisfac-tion of Where is it? tag and from the video analysis it was identified that a good portion of the participants did not understand the continuous loading for new information at the end of the list and were frustrated for not being able to find the correct list item (several participants gave up the task of looking for an specific item and chose randomly). This represents a serious accessibility barrier that the participants had to face and directly affected their mood during the experiment.
Also, participants were troubled by the Toggle Menu: although it has mostly good satisfaction, it presented worse results in terms of dominance and can be seen on Figure5 and Figure 6. In the recordings it was possible to see that the participants would open and close the menu several times in order to find the desired option in its Vertical List. These problems impacted in the time consumed during the tasks and also in the mood of the participants: it was possible to see the frustration of not finding an option and the need for help from the evaluator in order to complete the task.
The Icon design patterns can also be highlighted as it had the highest occurrence of "Where is it?" and"Oops" tags. It was possible to identify in the recordings that the participants had trouble understanding the meaning of some icons and would do and undo an operation in order to know what the icon represented. In Activity 2 (AT2) the participants should check their grades on an assessment performed in a previous week that was in the main page with an Icon and text representation, however as the image presented in the Icon was a bar chart, the participants would not identify themselves with the icon and ignored the text, trying to look somewhere else for the grades. This also reflected in their satisfaction and mostly in the feeling of dominance, as it can be seen that there is less concentration of points on 9 and more on 8 and 7 (and a good amount below 5).
Infi-3.4. Discussion 43
nite List where the participant would spend most of the time looking for an option instead of actually performing the activity: most participants took around 22 minutes to complete all activities, however, in a few situations, some participants took more than 30 minutes to complete the same activities. Also accessibility and usability barriers encountered by some users caused frustration and irritation that were noted by the observers and during the video analysis.
A possible comparison between the problem of finding information in a Toggle Menu with visually impaired users can be identified: when a blind user or a user with low-vision access an application, he doesn’t know which options a menu offers and needs to access item per item to understand the available features; when a user without disabilities access an interface with a toggle menu, he also doesn’t know which features are present in the menu, in fact the user needs to identify the icon or text that represent the trigger for the menu and only them he will be able to see the which options are available (YESILADA; BRAJNIK; HARPER, 2011b).
The accessibility barriers encountered by the participants during the experiment are problematic as they can directly impact the usage of the e-learning platform in a mobile device. One must consider that during the experiment the participants could ask for help when they had issues with some interface element, but that this help would not be at hand if they were using the application in a real life scenario which could spoil their learning experience and prejudice their educational performance.
The accessibility barriers encountered by the participants during the experiment are problematic as they can directly impact the usage of the e-learning platform in a mobile device. One must consider that during the experiment the participants could ask for help when they had issues with some interface element, but that this help would not be at hand if they were using the application in a real life scenario which could spoil their learning experience and prejudice their educational performance.
Another important fact is that none of the participants had identified disabilities. This is important to be noticed due to the fact that disabled people have serious issues with the traditional education system because it is not adapted to their needs and sometimes they seek aid in technology to help overcome their limitations. The presence of accessibility problems related to design patterns in a m-learning application can create more problems than it solves and discourage such users to continue with the learning process while in the case of participants without disabilities, the problems are mostly situational and can be overcome with some effort, using another platform or asking for aid.
written, we could not find any work that analyzed the accessibility of Moodle for mobile devices which makes this study an important contribution for developers and designers that work with Moodle on mobile.
3.5
Conclusions and Contributions
This study presented an accessibility evaluation of interaction design patterns on the m-learning platform Moodle based on emotional assessment with users without disabilities. The initial idea that accessibility barriers could be identified using design patterns and that such barriers would also affect the experience of users without disabilities while using the a m-learning platform was confirmed and the emotional impact of such barriers can be identified in the user interaction as well.
The problems related to the seven design patterns analyzed in this study were the result of an emotional assessment using the SAM technique as feedback from the participant and by the analysis of video recording from each participant’s interaction with the mobile app.
The accessibility barriers identified are diverse: the participants had trouble to identify the meaning of icons present in the interface, which lead to errors while performing the activities; there were reported problems of localization where the participants would spend a long time looking for one information in the application menu or would not understand the behavior of an infinite list, which would implicate in the increase of time needed to perform an operation and lead to frustration and even abandonment of the activity.
The results also show possible impacts of accessibility problems on m-learning platforms in the learning process as users can be unmotivated to continue studying due to barriers that are imposed by the lack of adaptation of the platform. This impact should be later verified in further studies.
The 21 participants performed five common activities that were parts of a chemistry class in a controlled environment where none of them had identified disabilities and all were familiar with the Moodle e-learning platform for desktop. Due to the characteristics of the participants (young, used to mobile devices and e-learning platforms and without disabilities) the results presented here are not as expressive and they would be if the experiment had been performed with disabled users, however this was intentional as the principle of Universal Design is to design for everyone. Thus, it is important to analyze the impact of accessibility problems to any person.
record-3.5. Conclusions and Contributions 45
ings of the screen and face of the participants. The major issues were related with finding information or identifying the meaning of interface elements that directly affected in the participant’s performance.
47
4 Virtual Ethnography approach for studying
online communities in software engineering
Due to the difficulty in finding information and practical examples in the literature about virtual ethnography studies in Software Engineering, this chapter presents an approach to conduct ethnography studies in online communities where developers usually share and discuss practical issues of software engineering.
4.1
Fundamentals of Ethnography and Virtual Ethnography
The path to understand a social group, its culture, institutions, interpersonal interactions and beliefs is challenging and may seen even more inaccessible when not using the appropriate research method (ANGROSINO, 2007). Ethnography may help in situations where the goal is to understand a community by analyzing it’s behavior and social interactions as it is a qualitative research method that combines observation, participation, interview and document analysis as tools to aid in this discovery.
Ethnography is a descriptive technique that uses raw data collected from observation or participation in a community or group and identifies common patterns that are present in the raw data and produce general theories that explain such patterns (HAMMERSLEY; ATKINSON, 2007).
In the literature there are not many ethnographic studies on Software Engineering (SHARP; DITTRICH; SOUZA, 2016) and there are even fewer studies conducted on virtual spaces. However the necessity of solving problems that frequently arise from the market practice is one of the motivations for which Software Engineering and other sciences produce research and the link between the practice and academy is essential for the development of new research (SANTOS et al., 2012).
Although ethnography is being used recently in the area of Human Computer Interaction and Software Engineering in order to help to improve the software development practice, it has its roots in social sciences and anthropology where it was first used in studies that aimed to understand new cultures and civilizations (LAZAR; FENG; HOCHHEISER, 2010).
4.1.1 Virtual Ethnography
site to socials spaces in the Internet (HINE, 2008).
Since the beginning of popularization of personal computers with access to the Internet in the 1990s, interesting social formations started to emerge in the digital world (BAYM, 1995) and this scenario caught the attention of many researchers that wanted to explore and understand the interactions in this new form of communication. The first ethnographic studies of virtual communities that emerged in mid-1990s analyzed conversations, documents and interviews with group members as would happen in a traditional ethnographic study, however important questions about the importance of presence and other dilemmas were not yet discussed (HINE, 2000).
With the emergence of new forms of interaction on the Internet as online multi-player games and social networks as Myspace, Orkut and later Facebook, different settings for ethnographic studies appeared with new challenges of data collection from chat logs and different types of media as pictures, video and audio files. Also the researcher needed to be comfortable with the new reality and develop strategies to interact with the communities (BOYD; HEER, 2006).
As on classical ethnography there are several dilemmas that ethnographers face in deciding how to conduct an study, however, in virtual ethnography some concepts may seem more complex and have more ramifications that have not been widely discussed (BOELLSTORFF, 2012). One of the first puzzles that the researcher must face is choosing a participation role in the research: there are several levels of participation between only observation and total participation (HINE, 2008) and, while some researchers in the literature may agree that some degree of participation is necessary, the nature of the community may force the researcher to adopt an observer or hybrid position in the study.
Also, with the participation role defined other challenges also arise as the concern with authenticity aspect regarding the disclosure of the researcher’s identity and intentions and other ethical issues as the use of informed consent form and protection of privacy of online users (DRISCOLL; GREGG, 2010).
4.2
Virtual Ethnography Approach
Based on the fundamentals of traditional ethnography and on the particularities of the Software Engineering field, the approach may be considered a guideline for supporting researchers to investigate the development practice. The approach for virtual ethnography presented in this chapter aids the researcher in all stages of an ethnographic study, from the planning to the execution and data analysis.
4.2. Virtual Ethnography Approach 49
the characteristics that are intrinsic to studies performed on online communities and virtual artifacts as the selection of a historical period (that is a time frame in which information in the Internet will be accepted for the research) and the definition of strategies for storing and organizing volatile information from the Internet in order to preserve it’s availability and original content.
Another significant aspect of both the approach is that in the literature one can find a few examples of virtual ethnography in areas related to the software development practice, however, these studies use as primary source of information the analysis of interviews with participants of the online community. However, direct interviews may fail to extract concerns and issues from the daily life of software development.
Therefore, research that considers the information and discussions publicly available on forums and blogs (that are not directed to a person, but to the community) have the opportunity to observe the interaction between developers and understand how the creative process of software development and problem solving happens with the collaboration of colleagues in its natural habitat: the virtual world.
The proposed approach for virtual ethnography in the study of the practice in Software Engineering consists of 3 steps (1 Planning; 2 Ethnography Execution; 3 -Data analysis) that are discussed in the following subsections and presented in Figure 8.
4.2.1 1st Step: Planning
The planning step consists of two phases which are the Definition of an Ethnography Protocol and the Selection of Information Sources (steps 1.1 and 1.2 in Figure 8). The phases are connected and executed in order, also, at the end of the second phase, the researcher must decide whether it’s necessary to return to the protocol definition for adjustments.
In the literatureHINE (HINE, 2008) presents a set of dilemmas and practices of online ethnography that includes several characteristics of ethnographic studies in virtual communities as the participation role of the researcher among others characteristics. While SHARP; DITTRICH; SOUZA (SHARP; DITTRICH; SOUZA,2016) compiles five general dimensions of ethnographic studies in Software Engineering containing key topics to help the researcher in the planning and execution of the ethnography. These definitions together are used to advise the researcher about key points of an ethnographic study.
Figure 8 – Virtual Ethnography Approach
4.2.1.1 Ethnography Protocol Definition