Pesq. agropec. bras., Brasília, v.48, n.7, p.975-982, jul. 2013 DOI: 10.1590/S0100-204X2013000800024
Gustavo Ruschel Lopes(1), Carlos Henrique Araujo de Miranda Gomes(1), Cláudio Rudolfo Tureck(2) and Claudio Manuel Rodrigues de Melo(1)
(1)UniversidadeFederal de Santa Catarina, Laboratório de Moluscos Marinhos, Avenida Beco dos Coroas, no 503, Barra da Lagoa,
CEP 88062‑600 Florianópolis, SC, Brazil. E‑mail: gustavoruschel@gmail.com, carloshenriquelabmol@gmail.com, claudio.melo@ufsc.br
(2)Universidade da Região de Joinville, Rodovia Duque de Caxias, s/no, Poste 128, Km 8, Iperoba, CEP 89240‑000 São Francisco do
Sul, SC, Brazil. E‑mail: claudio.tureck@univille.br
Abstract – The objective of this work was to evaluate the growth of the mangrove oyster Crassostrea gasar
cultured in marine and estuarine environments. Oysters were cultured for 11 months in a longline system in two study sites – São Francisco do Sul and Florianópolis –, in the state of Santa Catarina, Southern Brazil. Water
chlorophyll‑α concentration, temperature, and salinity were measured weekly. The oysters were measured monthly (shell size and weight gain) to assess growth. At the end of the culture period, the average wet flesh weight, dry flesh weight, and shell weight were determined, as well as the distribution of oysters per size class.
Six nonlinear models (logistic, exponential, Gompertz, Brody, Richards, and Von Bertalanffy) were adjusted to the oyster growth data set. Final mean shell sizes were higher in São Francisco do Sul than in Florianópolis. In addition, oysters cultured in São Francisco do Sul were more uniformly distributed in the four size classes than
those cultured in Florianópolis. The highest average values of wet flesh weight and shell weight were observed in São Francisco do Sul, whereas dry flesh weight did not differ between the sites. The estuary environment is
more promising for the cultivation of oysters.
Index terms: mangrove oyster, mariculture, nonlinear models.
Crescimento de
Crassostrea gasar
cultivada em ambientes
marinho e estuarino em águas brasileiras
Resumo – O objetivo deste trabalho foi avaliar o crescimento da ostra-do-mangue Crassostrea gasar cultivada em ambiente marinho e estuarino. As ostras foram cultivadas por 11 meses em sistema de espinhel, em dois locais de
estudo – São Francisco do Sul e Florianópolis –, em Santa Catarina. A concentração de clorofila‑α, a temperatura
e a salinidade da água foram registradas semanalmente. As ostras foram medidas mensalmente (tamanho da
concha e ganho de peso) para avaliar o crescimento. No final do período de cultivo, os pesos médios de carne
úmida, carne seca e concha foram determinados, bem como a distribuição das ostras por classes de tamanho. Seis
modelos não lineares (logístico, exponencial, Gompertz, Brody, Richards e Von Bertalanffy) foram ajustados aos dados de crescimento das ostras. As médias finais de tamanho da concha foram maiores em São Francisco do Sul do que em Florianópolis. Além disso, as ostras cultivadas em São Francisco do Sul apresentaram distribuição mais uniforme nas classes de tamanho do que aquelas cultivadas em Florianópolis. Os maiores valores médios de
peso de carne úmida e peso de concha foram observados em São Francisco do Sul, enquanto o peso da carne seca
não diferiu entre os locais. O ambiente estuarino é mais promissor para o cultivo de ostras.
Termos para indexação: ostra-do-mangue, maricultura, modelos não lineares.
Introduction
The external morphology of oysters can be considerably influenced by environmental factors; therefore, classifications based only on external characteristics, such as shell structure, color or shape, can easily lead to errors (Ignácio et al., 2000). In Brazil, the number of native oyster species is controversial. Lazoski et al. (2011) studied the two main Brazilian
native oysters and concluded that they are, indeed, two distinct species: Crassostrea rhizophorae (Guilding,
1828) and C. brasiliana (Lamarck, 1819) [Syn.
Materials and Methods
Wild Crassostrea gasar were collected from
Babitonga Bay, in São Francisco do Sul, in the state of Santa Catarina, Brazil, and were reared and spawned at Laboratório de Moluscos Marinhos, at Universidade Federal de Santa Catarina. The second generation of oysters was used as broodstock. Ten percent of the broodstock was sacrificed and used to prepare solutions of both male and female gametes at unknown concentrations. The remaining broodstock was induced to spawn by temperature treatment and immersion regime according to the procedures described by Silveira et al. (2011). Oysters were left in the tanks until the following day when the fecundity rate was evaluated. The resulting larvae were transferred to the culture tank, and larviculture was performed in January 2007, according to Silveira et al. (2011).
Broodstock and larvae were sampled for identification with molecular biology techniques as described by Melo et al. (2010) and Lazoski et al. (2011). The molecular analyzes were performed at Laboratório de Biodiversidade Molecular, at Universidade Federal do Rio de Janeiro. Forty-eight days after spawning, there were approximately 18,000 spats. Half of these spats were transferred to the sea in Sambaqui beach (MAR, marine environment), in Florianópolis (27º35'S, 48º32'W), and the other half to Babitonga Bay (EST, estuary environment), in São Francisco do Sul (26°28'S, 48°50'W), in the state of Santa Catarina, Brazil. Oysters were cultured at the study sites from March 2007 to February 2008.
A completely randomized design was used, with two treatments (MAR and EST) and four replicates (lanterns). During the first 15 days of the experiment, oysters were kept in water in horizontal floating boxes, divided into six portions of 40x30x10 cm, with wooden frames, covered with 500 µm mesh nets. The boxes were cleaned every week using a high-pressure water jet machine (Gong-F122, Interpump Group S.p.A, Calerno di S.Ilario d’Enza, RE, Italy). After this period, the oysters were transferred to nursery lanterns (four levels of 40 cm in diameter, 20 cm in height, and 2 mm mesh net) until they could be transferred to grow-out lanterns (same size as the nursery lanterns but with 30 mm mesh net) in longlines. The nursery and grow-out lanterns were cleaned twice and once a month, respectively, to remove mud and fouling organisms. After five months of culture in the grow‑out from Florianópolis, state of Santa Catarina, South of
Brazil, to the state of Pará, in the North (Melo et al., 2010; Lazoski et al., 2011), but with a discontinuity in the coast of Bahia, Northeastern Brazil, possibly due to inefficient sampling.
Although these species are valued commercially, they are not well represented in the current Brazilian oyster culture. In 2007, the total production in the country reached 1,385 Mg of cultured oyster, mainly C. gigas (Thunberg, 1793), of which approximately 84% (1,158.5 Mg) were cultured in the state of Santa Catarina, South Brazil (Oliveira et al., 2007). Crassostrea gigas is an exotic species, which has a well-developed culture technology and also grows well in the southern region of Santa Catarina. However, C. gigas is adapted to low water temperature. This limits its farming in most available areas along the Brazilian shore, where tropical conditions prevail and the mean water temperature is high and, therefore, unsuitable for the culture of C. gigas (Poli, 2004).
Currently, the farming of indigenous oyster species is based almost exclusively on the extraction of seeds from the wild, with the exception of some very small farms along the shore. In addition, information on farming techniques and requirements for good growth of native oysters is still scarce. Several studies were done before the development of molecular biology identification techniques and, therefore, the precise identification of the species was not possible. Since C. gasar and C. rhizophorae are found in the same habit, these two species may have been studied as one species.
Studies have shown that environmental conditions strongly influence the growth of oysters during distinct stages of their life cycle. These conditions include temperature (Huang et al., 2006; Yukihira et al., 2006; Cáceres-Puig et al., 2007), salinity (Paterson et al., 2003; Alvarenga & Nalesso, 2006), the composition of suspended particulate matter, and microalgae (Paterson et al., 2003; Huang et al., 2006; Rivero‑Rodríguez et al., 2007). Along the Brazilian shore, several areas with distinctive characteristics are available for oyster farming. However, researches on species adapted to Brazilian conditions are needed to begin oyster culture in those areas and to boost cultivation in the country.
Pesq. agropec. bras., Brasília, v.48, n.7, p.975‑982, jul. 2013
DOI: 10.1590/S0100-204X2013000800024
lanterns, all fouling organisms on the oysters’ shells were removed before measurements were taken.
Sampling procedures were the same in both sites of study. Surface sea water was collected every week in dark bottles. For sampling, water temperature was measured near the surface with a 0.5°C scale analog thermometer (Supermedy, São Paulo, SP, Brazil). Water samples were transported in iceboxes to the laboratory to measure salinity and concentration of chlorophyll‑α. Salinity was measured with a handheld refractometer ITREF-10, (Instrutemp Group S.p.A., Calerno di S.Ilario d’Enza, RE, Italy), and chlorophyll‑α was analyzed according to Strickland & Parsons (1972).
At the time of oyster sampling for wet flesh weight, dry flesh weight, and shell weight, it was not known if the gonadal maturation of the animals was at the same stage in both sites. Oysters might have spawned a few days before the sampling day in one site, while others were still full of gametes in the other. Therefore, oyster sampling was done with the shortest interval possible between samples to minimize this type of error.
The first oyster sampling occurred on days 37 (in EST) and 42 (in MAR) of the culture, corresponding to 85 and 90 days after spawning, respectively. Subsequent samples were taken monthly until the end of the culture period. On sampling days, lanterns were cleaned using a high-pressure water jet machine Gong-F122, (Interpump Group S.p.A, Calerno di S.Ilario d’Enza, RE, Italy) before measurements were taken. Every month, 15 oysters per replicate were subjected to a stratified random sampling, totaling 60 oysters per experimental culture site. The size of the samples increased to 20 oysters per replicate in July, totaling 80 oysters per site. The shell height, length, and width of the selected oysters were measured using a 0.01 mm digital caliper Series 799, (Starrett, Itu, SP, Brazil). The whole oyster weight or total wet weight was measured using a analytical balance WT 1000, (Weightech, Florianópolis, SC, Brazil). On the last day of culture, measurements also included mean wet flesh weight, dry flesh weight, and shell weight. After weighing, the oysters were opened, and the flesh was weighed and dried in an oven Q317M, (Quimis, Diadema, SP, Brazil), at 60°C, for 48 hours. The dried flesh was weighed, and the empty shell weight was recorded. On this day, oysters were classified into four height groups: <50 mm, 50–60 mm, 60–70 mm, and >70 mm. The total number of oysters per size group
was counted, and the percentage of each size group per replicate was determined.
Oyster growth parameters between the two culture sites were compared using analysis of variance. Linear correlations were used to estimate the length, height, and width with total wet weight per site. The analyses were performed using SAS, version 9.1 (SAS Institute, Cary, NC, USA).
The relationship between environmental parameters and oyster growth was analyzed by regression analysis procedure (PROC REG) in SAS, version 9.1 (SAS Institute, Cary, NC, USA). Daily growth rate was calculated as DGR = (Xt + 1 - Xt)/D , in which Xt + 1 is the mean height (mm) or the total wet weight (g) of the current month; Xt is the mean height (mm) or the total wet weight (g) of the previous month; and D is the number of days between measurements.
The six following nonlinear models were applied to the growth data to check for the best fit for the mean growth curve: logistic, exponential, Brody, Gompertz, Richards, and Von Bertalanffy (Macciotta, 2004). Model parameters were estimated by the NLIN procedure in SAS, version 9.1 (SAS Institute, Cary, NC, USA). The criteria used to choose the model that best described the growth curve were the mean squared error and the coefficient of determination (R2).
Results and Discussion
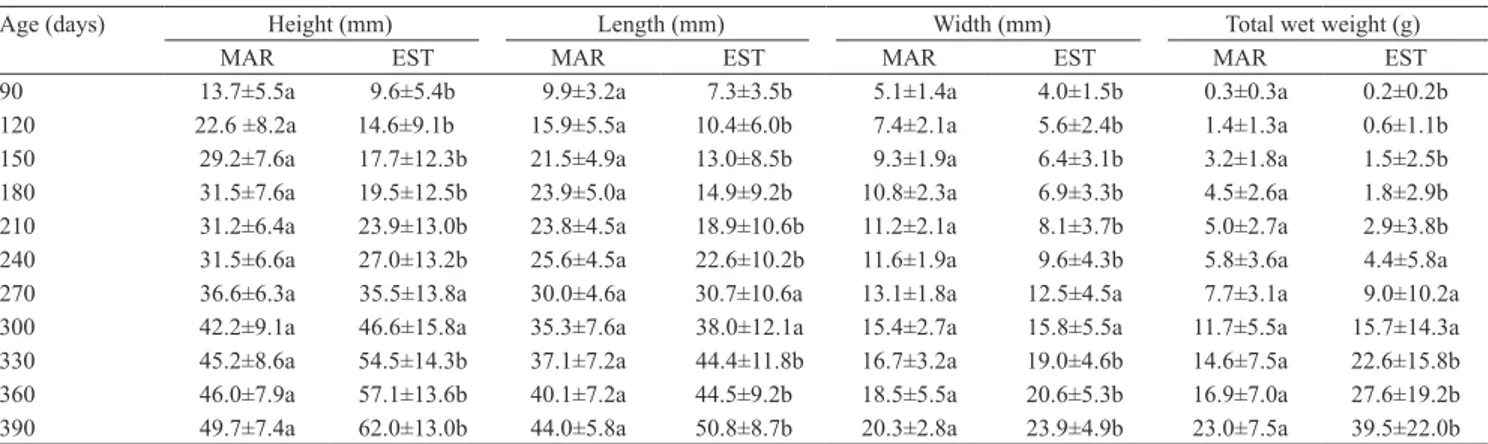
Until the 240th day of culture, oysters in MAR
showed higher growth (height, length, and width) than in EST, with a mean height of 31.46±5.65 mm (Table 2). Between the 270th and 300th day of culture,
no difference was observed in growth between the sites. From the 300th day on, oysters in EST presented
mean values higher than in MAR (p<0.05). The total wet weight of oysters in MAR was higher than in EST until the 210th day, and equivalent between the 240th
and 300th days. After the 330th day, the mean total wet
weight of oysters in EST was higher than in MAR. The values of mean temperature and chlorophyll‑α in both sites were similar, showing that these environmental parameters did not cause the differences observed in growth. However, salinity differed between
the two sites (from October 2007 to January 2008). A possible reason is that EST is in an estuary strongly influenced by rivers, with a tidal amplitude of up to 2.30 m in some areas (Cremer, 2006), whereas MAR is in a bay with little influence of rivers and low salinity variation during the day. The influence of salinity on oyster shell growth has already been reported. Paterson et al. (2003) studied the anthropic effect on the quality and quantity of seston, as well as on the growth and survival of Saccostrea glomerata, and found an inverse relationship between growth and salinity. Sarà & Mazzola (1997) evaluated the effect of trophic and environmental conditions on the growth of C. gigas cultured at two depths (7 and 13 m) and concluded that salinity influenced oyster growth in deeper waters.
Final growth values for height (49.65±7.39 mm in MAR and 61.98±13.04 mm in EST) are promising when compared with other growth rates reported for indigenous species of Brazilian oysters. Pereira et al. (2003) studied the growth of the mangrove oyster C. brasiliana (Syn. C. gasar) attached to mangrove roots in two areas in the estuary of Cananéia, state of São Paulo, Brazil, and identified two groups of oysters with distinct growth rates in each area of the estuary: fast- and slow-growing groups. It was estimated that 18.81 and 28.28 months were required for C. brasiliana to reach 50 mm in height.
Pereira et al. (2001) also reported a mean height of 81.82 mm after ten months of rack culture of C. brasiliana in four stocking densities (10, 15, 20, and 25 oysters per square meter) in three sites in Cananéia, state of São Paulo, Brazil. The mean initial oyster size was 50 mm. Maccacchero et al. (2007) assessed
Table 2. Monthly mean measurements of height, length, width, and total wet weight of the mangrove oyster Crassostrea gasar cultured in marine (MAR) and estuary (EST) environments, in the state of Santa Catarina, Brazil(1).
Age (days) Height (mm) Length (mm) Width (mm) Total wet weight (g)
MAR EST MAR EST MAR EST MAR EST
90 13.7±5.5a 9.6±5.4b 9.9±3.2a 7.3±3.5b 5.1±1.4a 4.0±1.5b 0.3±0.3a 0.2±0.2b
120 22.6 ±8.2a 14.6±9.1b 15.9±5.5a 10.4±6.0b 7.4±2.1a 5.6±2.4b 1.4±1.3a 0.6±1.1b
150 29.2±7.6a 17.7±12.3b 21.5±4.9a 13.0±8.5b 9.3±1.9a 6.4±3.1b 3.2±1.8a 1.5±2.5b
180 31.5±7.6a 19.5±12.5b 23.9±5.0a 14.9±9.2b 10.8±2.3a 6.9±3.3b 4.5±2.6a 1.8±2.9b
210 31.2±6.4a 23.9±13.0b 23.8±4.5a 18.9±10.6b 11.2±2.1a 8.1±3.7b 5.0±2.7a 2.9±3.8b 240 31.5±6.6a 27.0±13.2b 25.6±4.5a 22.6±10.2b 11.6±1.9a 9.6±4.3b 5.8±3.6a 4.4±5.8a 270 36.6±6.3a 35.5±13.8a 30.0±4.6a 30.7±10.6a 13.1±1.8a 12.5±4.5a 7.7±3.1a 9.0±10.2a
300 42.2±9.1a 46.6±15.8a 35.3±7.6a 38.0±12.1a 15.4±2.7a 15.8±5.5a 11.7±5.5a 15.7±14.3a
330 45.2±8.6a 54.5±14.3b 37.1±7.2a 44.4±11.8b 16.7±3.2a 19.0±4.6b 14.6±7.5a 22.6±15.8b
360 46.0±7.9a 57.1±13.6b 40.1±7.2a 44.5±9.2b 18.5±5.5a 20.6±5.3b 16.9±7.0a 27.6±19.2b
390 49.7±7.4a 62.0±13.0b 44.0±5.8a 50.8±8.7b 20.3±2.8a 23.9±4.9b 23.0±7.5a 39.5±22.0b
(1)Means±SD followed by equal letters (in the same age and parameter) do not differ by Tukey’s test, at 5% probability.
Table 1. Monthly mean values of chlorophyll‑α and salinity
in marine (MAR) and estuary (EST) environments, in the state of Santa Catarina, Brazil(1).
Month Chlorophyll‑α (µg L-1) Salinity (‰)
MAR EST MAR EST
Apr. 5.54±0.69a 3.57±2.86a 30.5±2.1a 31.1±1.5a May 4.78±0.59a 2.44±1.50a 33.3±1.1a 30.8±1.7a Jun. 1.95±0.45a 2.31±0.39a 34.5±0.7a 30.3±9.3a Jul. 3.33±1.71a 2.24±0.32a 35.5±0.7a 35.0±2.7a Aug. 3.68±1.46a 3.27±0.87a 35.0±1.4a 28.1±2.9a Sept. 3.72±1.24a 3.18±0.47a 36.0±0.0a 27.8±0.3a Oct. 3.66±1.26a 2.94±0.62a 33.3±2.9a 26.7±2.0b Nov. 3.60±0.57a 3.47±1.45a 32.5±0.7a 29.3±1.2b Dec. 5.07±1.97a 3.48±0.51b 33.9±0.0a 30.1±1.1b Jan. 4.80±1.21a 2.74±0.49b 32.3±0.7a 26.1±6.5a Feb. 6.80±2.23a 3.43±2.40a 32.3±0.6a 26.4±0.2b
Pesq. agropec. bras., Brasília, v.48, n.7, p.975‑982, jul. 2013
DOI: 10.1590/S0100-204X2013000800024
the growth of Crassostrea sp. under two cleaning frequencies (every week and every two weeks) and two stocking densities (1,000 and 2,000 seeds per lantern level). The authors reported a final mean height of 58.83 mm after five months of culture with cleaning every two weeks and a density of 2,000 seeds per level, and of 49.81 mm with cleaning every week and a density of 1,000 seeds per lantern level. The mean time for oysters to reach 50 mm in height was 18 months, much longer than the nine months observed in the present study. However, the results from those studies might refer to more than one species of oyster. Pereira et al. (2001, 2003) analyzed oysters collected from the wild, where at least two species of the indigenous oyster of the genus Crassostrea can be found; and although the study by Maccacchero et al. (2007) used oysters hatched in a laboratory, no molecular determination for the species was done. Furthermore, in studies with oysters collected from the wild, there is also the risk of choosing animals of different ages (i.e., fast-growing young individuals and slow-growing older ones).
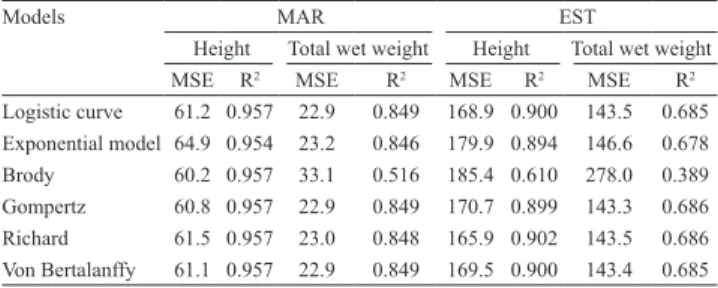
In EST, all models were adjusted to the mean growth curve for height and total wet weight, except the Brody model, which presented a low R2 value
and a high mean squared error (Table 3). In MAR, all models were adjusted to the mean growth curve for height. The Brody curve was well suited for the height of oysters cultured in MAR. The study by Pereira et al. (2003) showed that the model of Von Bertalanffy was best suited for the growth data of C. brasiliana. This and the logistic model were suited for the growth data of Pinctada margaritifera (Pouvreau et al., 2000); whereas the Von Bertalanffy model described the growth in length; and the logistic model was the best fit for shell length and dry flesh weight. Yukihira et al. (2006) reported that the Von Bertalanffy model ignored the slow growth of oysters in the early life stages but presented a good fit (R2 = 0.95–0.97) for the growth of P. maxima and P. margaritifera.
Some of the models used in the present study have also been adopted to describe the growth of other aquatic animals. For example, Freitas (2005) studied the growth of the freshwater prawn Macrobrachium rosenbergii and of the pepper-frog Leptodactylus labyrinthicus. According to the author, the best fit for M. rosenbergii
growth data were the Gompertz (R2 = 0.9799),
logistic (R2 = 0.9796), and Von Bertalanffy
(R2 = 0.9999) models. However, it was observed that
the models overestimated the initial and final weights of the animals. For the growth data of the pepper-frog, the author found a better fit of the Gompertz (R2 = 0.9999), logistic (R2 = 0.9999), Richards
(R2 = 0.9999), and Von Bertalanffy (R2 = 0.9402)
models.
Although some of the growth curve models analyzed in the present study did fit the data, they were not developed to explain the growth of oysters. It is possible that the growth curve models presented here are not the best fit for data on the growth of oysters cultured under conditions different from those of the present study. Therefore, the application of these models to data on oysters requires further studies with additional observations of oysters cultured under different conditions.
In EST, oysters were well distributed in the four size groups, and no significant difference was observed in the number of oysters between groups (Table 4). The distribution of oysters per size showed a higher growth of oysters cultured in EST. Only 24.14% of the oysters cultured in EST were smaller than 50 mm, whereas in
Table 3. Mean squared error (MSE) and coefficient of
determination (R2) for the curves generated by height and total wet weight of the mangrove oyster Crassostrea gasar
in marine (MAR) and estuary (EST) environments, in the state of Santa Catarina, Brazil.
Models MAR EST
Height Total wet weight Height Total wet weight
MSE R2 MSE R2 MSE R2 MSE R2
Logistic curve 61.2 0.957 22.9 0.849 168.9 0.900 143.5 0.685 Exponential model 64.9 0.954 23.2 0.846 179.9 0.894 146.6 0.678
Brody 60.2 0.957 33.1 0.516 185.4 0.610 278.0 0.389
Gompertz 60.8 0.957 22.9 0.849 170.7 0.899 143.3 0.686
Richard 61.5 0.957 23.0 0.848 165.9 0.902 143.5 0.686
Von Bertalanffy 61.1 0.957 22.9 0.849 169.5 0.900 143.4 0.685
Table 4. Distribution per size of the mangrove oyster
Crassostrea gasar cultured in marine (MAR) and estuary (EST) environments, in the state of Santa Catarina, Brazil(1).
Oyster size MAR EST
(mm) Absolute number % Absolute number %
<50 1,979 57.08Aa 684 24.14Aa
50–60 1,205 34.76Ab 835 29.46Aa
60–70 260 7.5Ac 744 26.25Aa
>70 23 0.66Ad 571 20.15Aa
Total 3,467 100 2,834 100
MAR, 57.08% of the oysters were within that group. In addition, 91.84% of the oysters cultured in MAR were smaller than 60 mm. In EST, approximately 50% of the oysters had reached more than 60 mm by the end of the test culture. After the eight-month culture (November 2007), 38.75% of the oysters in EST presented a minimum size of 50 mm, whereas in MAR, these oysters accounted for only 17.5%. These results are in accordance with those described in the literature (Pereira et al., 2001, 2003; Maccacchero et al., 2007) for oyster growth in estuarine environments.
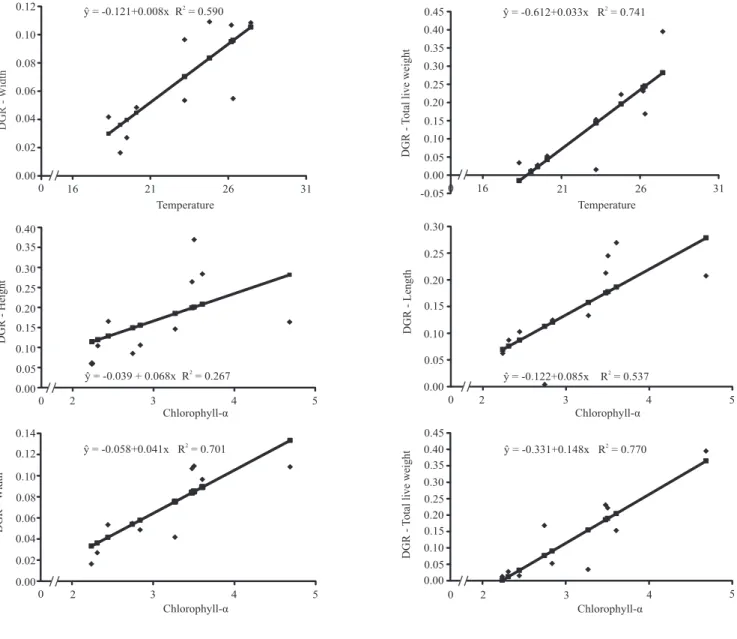
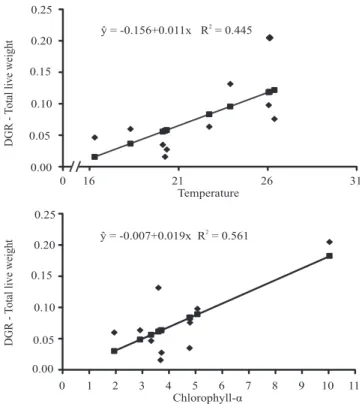
Regression analyses of data from EST showed linear correlations between the daily growth rate (DGR) in oyster (shell height, length, width, and total wet weight) and the mean water chlorophyll‑α concentration (Figure 1). In MAR, a linear correlation was observed only between total wet weight and water chlorophyll‑α concentration (Figure 2). Similar results have been observed in C. gigas cultured at two depths, in which oyster growth was strongly influenced by the presence of phytoplankton near the water surface (Sarà & Mazzola, 1997). However, Brown & McCausland (2000), while testing supplementary
21 26 31
Temperature
ŷ = -0.121+0.008x R = 0.5902
-0.05 0.00 0.05 0.10 0.15 0.20 0.25 0.30 0.35 0.40 0.45
21 26 31
DGR
-T
otal live weight
Temperature
ŷ = -0.612+0.033x R = 0.7412
0.00 0.05 0.10 0.15 0.20 0.25 0.30
0 3 4 5
ŷ = -0.122+0.085x R = 0.5372
3 4 5
Chlorophyll-α
ŷ = -0.058+0.041x R = 0.7012
0.00 0.05 0.10 0.15 0.20 0.25 0.30 0.35 0.40 0.45
0 3 4 5
DGR
-T
otal live weight
Chlorophyll-α ŷ = -0.331+0.148x R = 0.7702
3 4 5
0.00 0.02 0.04 0.06 0.08 0.10 0.12
16
0.00 0.02 0.04 0.06 0.08 0.10 0.12 0.14
2
DGR
-W
idth
DGR
-W
idth
0.00 0.05 0.10 0.15 0.20 0.25 0.30 0.35 0.40
2
DGR - Height
Chlorophyll-α ŷ = -0.039 + 0.068x R = 0.2672
DGR - Length
Chlorophyll-α 0
0
0 2
16
2 0
Figure 1. Statistically significant relations between environmental parameters and growth indices in estuary environment, in
Pesq. agropec. bras., Brasília, v.48, n.7, p.975‑982, jul. 2013
DOI: 10.1590/S0100-204X2013000800024
feeding to enhance C. gigas growth, did not find a significant correlation between daily growth rate and water quality parameters. Other authors reported that in months with low chlorophyll‑α concentrations oyster growth rates were also low. The DGR for total wet weight showed a linear correlation with water temperature both in MAR and in EST, and the DGR for width showed a linear correlation with temperature in MAR. The other DGR parameters (length and height) were not correlated with water temperature. According to Cáceres-Puig et al. (2007), the growth of C. corteziensis seeds showed a quadratic relation with temperature, i.e.: growth increased linearly with temperature until a certain point and then started decreasing until growth ceased. In another study with the pearl oysters P. maxima and P. margaritifera, in two culture environments, Yukihira et al. (2006) observed that temperature influenced the growth of small and medium sized P. maxima at both sites and of small P. margaritifera at only one of the sites.
Results in EST showed a higher growth of oysters, a shorter culture cycle, and also a greater standardization of the final product. The present study was conducted to adjust the oyster growth data to the different growth curve models; therefore, no animal was discarded as usually happens in regular production systems. In this case, the oysters with slow growth rates are removed and only the fast growing ones are kept until the end of the cycle. If such a procedure had been adopted in the present study, the mean growth values would have be higher than the ones actually reported.
Final means for shell weight were 26.81 and 15.05 g in EST and in MAR, respectively. Mean wet flesh weight was 5.91 g in EST and 4.74 g in MAR. Both parameters were significantly higher in EST (p<0.05). Mean dry flesh weight did not differ significantly between EST (1.28 g) and MAR (1.16 g). Therefore, the difference observed in growth between the sites was due to shell size and not flesh weight.
Currently, oysters are sold in the Brazilian market per dozen, and consumers usually prefer larger oysters, even if this means buying an oyster with a large shell and little flesh. With the increased production in volume, other markets are expected to emerge, including processed oysters that can be sold without the shell, boiled and frozen or refrigerated, ready to serve. In these cases, the main determinant of serving size is the flesh weight, not the shell size. For these purposes, both sites presented similar results.
Conclusions
1. The oyster Crassostrea gasar shows promising growth in both estuarine and marine environments tested with harvest after 11 months of cultivation.
2. The estuary environment is more promising for the cultivation of oysters.
Acknowledgements
To Cristiano V. S. Lazoski, for the molecular analysis of the broodstock and larvae used in the experiment; to Fundo de Recursos Hídricos (CT‑Hidro), Fundo Setorial de Agronegócio (CT-Agro), Secretaria Especial de Aquicultura e Pesca (Seap-PR), Financiadora de Estudos e Projetos (Finep), for financial support; and to Conselho Nacional de Desenvolvimento Científico e Tecnológico (CNPq), for scholarship granted to the first author.
Figure 2. Statistically significant relations between
environmental parameters and growth indices in environment, in the state of Santa Catarina, Brazil. DGR, daily growth rate.
0.00 0.05 0.10 0.15 0.20 0.25
0 21 26 31
DGR
-T
otal live weight
Temperature ŷ = -0.156+0.011x R = 0.4452
0.00 0.05 0.10 0.15
0.20 0.25
0 2 3 4 5 6 7 8 9 10 11
DGR
-T
otal live weight
Chlorophyll-α ŷ = -0.007+0.019x R = 0.5612
References
ALVARENGA, L.; NALESSO, R.C. Preliminary assessment of the
potential for mangrove oyster cultivation in Piraquê-açu river estuary (Aracruz, ES). Brazilian Archives of Biology and Technology, v.49, p.163-169, 2006. DOI: 10.1590/S1516-89132006000100019.
BROWN, M.R.; MCCAUSLAND, M.A. Increasing the growth of juvenile Pacific oysters Crassostrea gigas by supplementary feeding with microalgal and dried diets. Aquaculture Research, v.31, p.671-682, 2000. DOI: 10.1046/j.1365-2109.2000.00485.x.
CÁCERES‑PUIG, J.I.; ABASOLO‑PACHECO, F.; MAZÓN‑SUASTEGUI, J.M.; MAEDA‑MARTÍNEZ, A.N.;
SAUCEDO, P.E. Effect of temperature on growth and survival of
Crassostrea corteziensis spat during late-nursery culturing at the
hatchery. Aquaculture, v.272, p.417-422, 2007. DOI: 10.1016/j. aquaculture.2007.06.030.
CREMER, M.J. O estuário da Baía da Babitonga. In: CREMER, J.M.; MORALES, P.R.D.; OLIVEIRA, T.M.N. de (Ed.).
Diagnóstico ambiental da Baía da Babitonga. Joinville: Univille,
2006. p.15-19.
FREITAS, A.R. de. Curvas de crescimento na produção animal.
Revista Brasileira de Zootecnia, v.34, p.786-795, 2005. DOI:
10.1590/S1516-35982005000300010.
HUANG, S.; HSIEH, H.; CHEN, C.P. Effects of the winter
Monsoon on the growth, mortality, and metabolism of adult oysters in Kinmen Island, Taiwan. Aquaculture, v.251, p.256-270, 2006. DOI: 10.1016/j.aquaculture.2005.05.026.
IGNÁCIO, B.L.; ABSHER, T.M.; LAZOSKI, C.; SOLÉ‑CAVA,
A.M. Genetic evidence of the presence of two species of
Crassostrea (Bivalvia: Ostreidae) on the coast of Brazil. Marine
Biology, v.136, p.987-991, 2000. DOI: 10.1007/s002270000252.
LAZOSKI, C.; GUSMÃO J.; BOUDRY, P.; SOLÉ‑CAVA,
A.M. Phylogeny and phylogeography of Atlantic oyster species: evolutionary history, limited genetic connectivity and isolation by distance. Marine Ecology Progress Series, v.426, p.197-212, 2011. DOI: 10.3354/meps09035.
MACCACCHERO, G.B.; FERREIRA, J.F.; GUZENSKI, J. Influence of stocking density and culture management on growth
and mortality of the mangrove native oyster Crassostrea sp. in southern Brazil. Biotemas, v.20, p.47-53, 2007.
MACCIOTTA, N.P.P.; CAPPIO‑BORLINO, A.; PULINA, G.
Growth and lactation curves. In: SAXTON, A.M. Genetic analysis
of complex traits using SAS. Cary: SAS Institute, 2004. p.97-147.
MELO, C.M.R.; SILVA, F.C.; GOMES, C.H.A.M.; SOLÉ‑CAVA, A.M.; LAZOSKI, C. Crassostrea gigas in natural oyster banks in southern Brazil. Biological Invasions, v.12, p.441-449, 2010. DOI: 10.1007/s10530-009-9475-7.
OLIVEIRA, G.M. de; SANTOS, G.C.B. dos; SILVA FILHO, J.B. da; ARAGÃO, J.A.N.; BEZERRA, S.N. (Coord.). Estatística
da Pesca 2007: Brasil, grandes regiões e unidades da federação.
Brasília: Ibama, 2007. 113p.
PATERSON, K.J.; SCHREIDER, M.J.; ZIMMERMAN, K.D.
Anthropogenic effects on seston quality and quantity and the growth and survival of Sydney rock oyster (Saccostrea glomerata) in two estuaries in NSW, Australia. Aquaculture, v.221, p.407-423, 2003. DOI: 10.1016/S0044-8486(03)00027-9.
PEREIRA, O.M.; HENRIQUES, M.B.; MACHADO, I.C.
Estimativa da curva de crescimento da ostra Crassostrea brasiliana
em bosques de mangue e proposta para sua extração ordenada no
estuário de Cananéia, SP, Brasil. Boletim do Instituto de Pesca, v.29, p.19-28, 2003.
PEREIRA, O.M.; MACHADO, I.C.; HENRIQUES, M.B.; YAMANAKA, N. Crescimento da ostra Crassostrea brasiliana
semeada sobre tabuleiro em diferentes densidades na região
estuarino‑lagunar de Cananéia‑SP (25ºS, 48ºW). Boletim do
Instituto de Pesca, v.27, p.163-174, 2001.
POLI, C.R. Cultivo de ostras do pacífico (Crassostrea gigas,1852).
In: POLI, C.R.; POLI, A.T.; ANDREATTA, E.; BELTRAME, E.
Aquicultura: experiências brasileiras. Florianópolis: Multitarefa,
2004. p.251-266.
POUVREAU, S.; TIAPARI, J.; GANGNERY, A.; LAGARDE, F.; GARNIER, M.; TEISSIER, H.; HAUMANI, G.; BUESTEL, D.; BODOY, A. Growth of the black‑lip pearl oyster, Pinctada
margaritifera, in suspended culture under hydrobiological
conditions of Takapoto lagoon (French Polynesia). Aquaculture, v.184, p.133-154, 2000. DOI: 10.1016/S0044-8486(99)00319-1.
RIVERO‑RODRÍGUEZ, S.; BEAUMONT, A.R.;
LORA-VILCHIS, M.C. The effect of microalgal diets on growth,
biochemical composition, and fatty acid profile of Crassostrea
corteziensis (Hertlein) juveniles. Aquaculture, v.263, p.199-210,
2007. DOI: 10.1016/j.aquaculture.2006.09.038.
SARÀ, G.; MAZZOLA, A. Effects of trophic and
environmental conditions on the growth of Crassostrea gigas
in culture. Aquaculture, v.153, p.81-91, 1997. DOI: 10.1016/ S0044-8486(97)00009-4.
SILVEIRA, R.C.; SILVA, F.C.; GOMES, C.H.M.; FERREIRA, J.F.; MELO, C.M.R. Larval settlement and spat recovery
rates of the oyster Crassostrea brasiliana (Lamarck, 1819) using different systems to induce metamorphosis. Brazilian
Journal of Biology, v.71, p.557-562, 2011. DOI: 10.1590/
S1519-69842011000300029.
STRICKLAND, J.D.H.; PARSONS, T.R. A practical handbook
of seawater analysis. Hardcover: Fisheries Research Board of
Canada, 1972. 310p. (Bulletin, 167).
YUKIHIRA, H.; LUCAS, J.S.; KLUMPP, D.W. The pearl oysters,
Pinctada maxima and P. margaritifera, respond in different
ways to culture in dissimilar environments. Aquaculture, v.252, p.208-224, 2006. DOI: 10.1016/j.aquaculture.2005.06.032.