Received May 27, 2011 and accepted December 13, 2011. Corresponding author: ppmendonca@ifes.edu.br
*Current address: IFES Campus de Alegre.
Morphometrical development of tambaqui (
Colossoma macropomum
,
Cuvier, 1818) under different photoperiods
Pedro Pierro Mendonça1*, Manuel Vazquez Vidal Junior2, Marcelo Fanttini Polese3, Monique Virães Barbosa dos Santos4, Fabrício Pereira Rezende5, Dalcio Ricardo de Andrade2
1Doutorando em Ciência Animal - LZNA/CCTA/UENF. 2LZNA/ CCTA/UENF, Campos dos Goytacazes, RJ, Brasil. 3Mestrando em Ciência Animal - LZNA/CCTA/UENF. 4Mestranda em Produção Animal - LZNA/CCTA/UENF.
5Doutorando em Zootecnia/EMBRAPA Pesca e Aquicultura - Palmas, TO.
ABSTRACT - The experiment was performed with 160 tambaqui (Colossoma macropomum) with average weight 11.01±2.08 g and total length 7.8±0.18 cm. Fishes were kept in sixteen aquariums with 56 L of water at 29.1±0.4 oC of
temperature, initial stocking density 1.97 g/L and constant aeration. The objective of this study was to assess the influence of photoperiod on fish performance. Treatments consisted of four photoperiods: T1 = 6 hours; T2 = 12 hours; T3 = 18 hours and T4 = 24 hours, with four replicates each. Fishes were fed twice a day with commercial extruded feed (28% of crude protein). The experiment was developed in closed circulation system, with volume of water renewal for each experimental unit equivalent to 40 times daily. Fish biometry was performed at the beginning of the experiment and at every 16 days, in order to follow the effects of treatments on juvenile development. Final weight, total length, standard length, height, feed intake, weight gain, feed conversion, survival, specific growth rate, protein efficiency rate and protein retention efficiency were assessed. Statistical analysis of variables was performed with application of the software SAEG version 9.1, for analysis of variance, regression analysis and Pearson correlation. Positive influence of photoperiod was observed for the studied variables in this study. The studied variables enhanced as the photoperiod increased, mainly between 15 and 22 hours. The photoperiod has significant influence upon growth traits of tambaqui (Colossoma macropomum).
Key Words: bioclimatology, growth, native fish
www.sbz.org.br
Introduction
Fish farming is one of the activities that have positive economic growth every year, due to the increasing world demand for fish. Therefore, deeper knowledge of species with productive potential, such as tilapia, carp and native species such as tambaqui, arapaima, pacu, pintado among others, is needed.
Most of the native species with commercial potential in Brazil and around the world are from the Amazon, not only for their size, growth rate or taste, but mainly because these species evolved withstanding low levels of dissolved oxygen in water. Other factors that contributed to diffusion, specially of tambaqui (Colossoma macropomum), and other species such as characin fishes like pacu and pirapitinga, were the development and publication of a protocol for juvenile production allied to the good fecundity of these species (Silva et al., 1981; Woynarovich, 1986).
Tambaqui (Colossoma macropomum, Cuvier, 1818) is a native species from the Amazon, and has been an issue of
interest of researchers and farmers due to its adaptation to intensive production, fast growth, acceptance into the industrial feed and high value of its meat.
Tambaqui was taken to Panamá and Taiwan in the eighties and lately, to Cuba, Dominican Republic, United States, Honduras, Jamaica, Philippines, Guatemala, Hungary, Costa Rica, Porto Rico and China, where they are grown or live in free populations in the nature (Liao et al. 2001).
Photoperiod affects physiology of growth and reproduction of fish. Also, the lack of information about the effect of environmental factors for Brazilian fish can be noticed. Thus, the effect of photoperiod on the development of fingerlings of tambaqui is the scope of this study.
Material and Methods
The experiment was performed in the Agriculture Sector of Universidade Estadual do Norte Fluminense (UENF/RJ), Campos dos Goytacazes, Rio de Janeiro, Brazil, during the period between May 4 and June 21 of 2006, comprising 48 days.
One hundred and sixty juveniles of tambaqui Colossoma macropomum, from the fish farming station Projeto Piabanha, located in Itaocara, Rio de Janeiro State, Brazil were used. The age of the specimens was approximately 60 days; fishes were distributed in 16 aquariums with approximate measures of 30 × 60 × 50 cm (width, length, height), using the volume of 56 liters of water for each aquarium, which received 10 juvenile tambaqui, resembling an experimental unit.
Experimental units were distributed in a randomized blocks design, with two blocks that contained two replicates for each treatment, and composed according to the difference of light intensity that reached the replicates and four treatments. Treatments differed in the simulations of photoperiods (hours of light) T1 = 6h, T2 = 12h, T3 = 18h and T4 = 24h of artificial light.
The light intensity used in the experiment was quantified by a photometer, measured in ìmol/m.s. Hours of light supplied throughout the experiment was controlled by automatic timers that turned the lights on and off during the programmed period.
Treatments were isolated with black PVC to avoid light incidence from other sources during the dark period of each treatment, assuring that the supply of light would only happen during the programmed periods for each treatment. The following water quality parameters were measured: dissolved oxygen, pH, temperature and electrical conductivity. The measures were obtained always after feeding (at 8:20 a.m. and 1:20 p.m). The levels of oxygen were kept with aerators; the oxygen was measured by oxygen sensor, pH was measured by a pH-meter, temperature by a digital thermometer, and electrical conductivity by an electrical conductivity analyzer.
Experimental aquariums were kept under a continuous closed recirculating system containing a wet/dry filter with a pre box for decantation and a return box with thermostats to maintain the water temperature.
Water circulation rate was 40 times the total volume per day. Water flow was constant, aiming to keep the oxygen saturation high and remove feces, avoiding the plankton formation.
Feeding management was done with commercial feed containing 28% of crude protein (CP) and 3,100 kcal of digestible energy (DE)/kg. Animals were fed twice a day with 5 hours of interval between the first and the second meal, at 8:20 a.m. and 1:20 p.m. After 15 minutes, the leftovers were cleaned from the aquariums. Feeding was supplied until every aquarium presented some amount of leftovers. The initial stocking density was 1.97 g/L in each aquarium and juvenile fish went through a process of adaptation to the experimental routin, which lasted 12 days. At the 32nd experimental day, 50 animals from each replicate were slaughtered.
Biometry was made in the beginning of the experiment and at every 16 days during the experimental period aiming to assess total body length in cm, standard body length in cm, body height in cm and body weight in g. Feed intake was measured in grams by the difference between feed offered and leftovers.
Biometry, along with feeding management allowed the calculation of some parameters such as: body weight gain (g), feed conversion (g), daily weight gain rate (%), specific growth rate (%) and protein efficiency rate (%).
Statistical analysis of the experiment was done with statistical software SAEG (Sistema para Análises Estatísticas, version 9.1), of Universidade Federal de Viçosa. Analysis of variance, Simple and Multiple Linear Regressions, Linear Response Plateau and Pearson Correlations were made with data obtained from measurements performed during the experimental period.
Results and Discussion
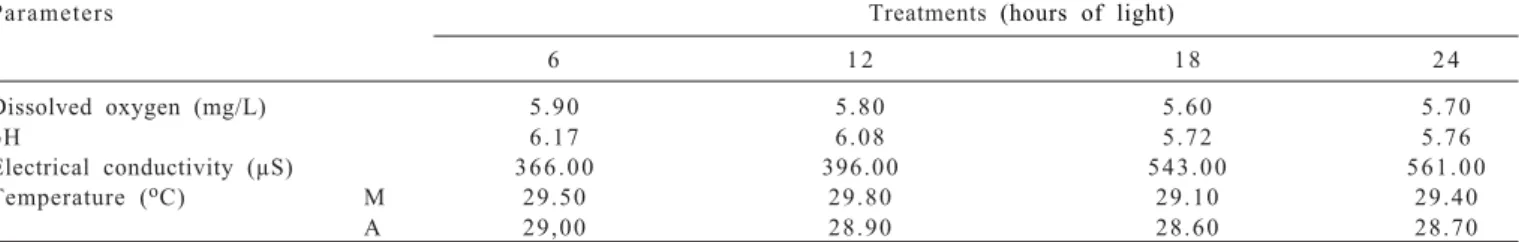
According to Araujo-Lima & Gomes (2005), tambaqui presents normal growth at oxygen levels above 3 mg/L. Therefore, the values obtained in this experiment (5.75 mg/L) perfectly supply the tambaqui requirement. Similarly, average values of pH were kept between 4.0 and 6.5, within the recommended standards by Aride et al. (2004). The temperature of the experimental aquariums was adequate for tropical climate species, presenting average values of 29.45 oC in the morning and 28.80 oC in the afternoon (Table 1).
0.1416 µmol/m2.s.) Block 1 was composed of replicates 1 and
4 and block 2, of replicates 2 and 3.
The third biometry (32nd experimental day) presented a high average weight, mainly in treatments 3 and 4, generating a high density situation inside the experimental aquariums. In order to reduce density inside those aquariums, some fishes that composed each replicate of every treatment were slaughtered.
Results obtained from biometry in this experiment were higher for the following variables: total length, standard length and weight in the treatments of longer photoperiods (Table 2), determining a better development of juvenile tambaqui in those photoperiods.
The Linear Response Plateau (LRP) analysis for the variables (Table 2) showed that better responses were obtained with photoperiods above 15 hours.
Several authors have reported positive effects of longer photoperiods in fish development. Longer photoperiods (18HL:6HD and 24HL:0HD) provided better results of Latris lineatus larvae development than shorter photoperiod (12HL:12HD) (Trotter et al., 2003).
Results similar to the ones observed in this study were reported for different species and development phases. Flounder larvae (Paralichthys lethostigma)
(Moustakas et al., 2004) and Atlantic cod larvae (Gadus morhua), described by Puvanendran & Brown (2002) and haddock juvenile (Melanogrammus aeglefins), reported by Trippel & Neil (2003), presented better development when exposed to longer photoperiods and lighting of high intensity. Some authors did not observe significant differences or positive responses with the increase in photoperiod in the initial stages of development of some species used in fish farming. Reynalte-Tataje et al. (2002) worked with piracanjuba larvae (Brycon orbignyanus) and did not observe significant differences for length or weight (P<0.05) in photoperiods of 0 hours of light (HL):24 hours of dark (HD), 10HL:14HD, 14HL:10HD and 24HL:0HD, during 10 days of experimental period. The same authors observed more heterogeneity as photoperiod decreased, and the treatment 0HL:24HD resulted in the maximum and minimum values for weight 12 to 94 mg for 11 and 22 mm of length, respectively. The best results for weight gain, feed intake and feed conversion were observed as the photoperiod increased (Table 3).
Salaro et al. (2006), worked with trairao fingerlings (Hoplias lacerdae) subjected to different photoperiods and did not observe significant differences in weight gain, feed conversion, survival rate or cannibalism.
Parameters Treatments (hours of light)
6 1 2 1 8 2 4
Dissolved oxygen (mg/L) 5 . 9 0 5 . 8 0 5 . 6 0 5 . 7 0
pH 6 . 1 7 6 . 0 8 5 . 7 2 5 . 7 6
Electrical conductivity (μS) 3 6 6 . 0 0 396.0 0 5 4 3 . 0 0 5 6 1 . 0 0
Temperature (oC) M 2 9 . 5 0 2 9 . 8 0 2 9 . 1 0 2 9 . 4 0
A 2 9 , 0 0 2 8 . 9 0 2 8 . 6 0 2 8 . 7 0
M - morning; A - afternoon.
Table 1 - Mean values of water quality variables measured during the experimental period
Variables Treatments (hours of light)
6 CV 1 2 CV 1 8 CV 2 4 CV
Total length 1 2 . 2 8 0 . 4 1 1 2 . 6 8 1 . 1 8 1 2 . 8 5 0 . 7 8 1 3 . 1 5 3 . 8 0 Standard length 1 0 . 7 3 0 . 5 6 1 1 . 1 3 0 . 4 5 1 1 . 1 3 1 . 3 5 1 1 . 4 8 3 . 9 2 Height 5 . 2 3 2 . 8 7 5 . 4 1 1 . 6 7 5 . 4 3 0 . 9 2 5 . 6 5 5 . 3 1 Weight 4 1 . 7 1 2 . 6 1 4 4 . 3 1 2 . 8 9 4 5 . 6 5 0 . 3 5 5 1 . 7 3 1 4 . 3 4 CV - coefficient of variation.
Table 2 - Mean values of total length (cm), standard length (cm), height (cm) and weight (g) of juvenile tambaqui at different photoperiods, in hours, within 48 days of experiment
CV - coefficient of variation.
Variables Treatments (hours of light)
6 CV 1 2 CV 1 8 CV 2 4 CV
Weight gain 2 9 . 4 2 1 . 0 0 3 2 . 0 5 7 . 8 8 3 3 . 5 3 2 . 7 9 3 9 . 6 9 2 0 . 2 6 Feed intake 6 2 . 2 0 6 . 8 2 7 1 . 7 7 2 . 1 0 7 2 . 6 0 1 0 . 5 2 8 6 . 5 3 7 . 9 3 Feed conversion 1 . 7 8 3 . 9 9 1 . 7 8 1 1 . 0 9 1 . 8 1 7 . 2 9 1 . 9 7 1 2 . 4 3
Luz et al. (2000) also did not find significant difference when evaluating the development of Brazilian catfish cachara larvae (Pseudoplatystoma fasciatum) under 24HL:0HD and 0HL:24HD.
Melo et al. (2001) studied tambaqui fingerlings and found mean value of 1.09 for feed conversion. The high values of feed conversion found in the present experiment may have occurred because some animals were slaughtered on the 32nd day, with the intention to reduce density of replicates and assure animal welfare.
The Linear Response Plateau was calculated to elucidate which would be the longest photoperiod possible for a better response of each variable listed in Table 3, observing the point where variable and treatment meet. Therefore, results were 22:37 hours of light for weight gain and 17:29 hours of light for feed intake. The variable feed conversion presented a statistical behavior that did not allow the calculation of the Linear Response Plateau; thus, the longer possible photoperiod for the best feed conversion could not be statistically demonstrated.
Specific growth rate, protein efficiency ratio, daily weight gain rate and density (g/L) of fishes within 48 days of experiment were also measured (Table 4).
The mean values of specific growth rate observed in treatments T1, T2, T3, T4 were respectively 0.37, 0.44, 0.45 and 0.48%/day, presenting a higher value from treatment T4 (24HL). These values are lower than the ones found by Ituassú et al. (2004), who worked with juvenile tambaqui weighting initially 75.68g, on average, and found specific growth rate means that ranged from 0.97 to 0.83%/day.
Fernandes et al. (2004), also estimated specific growth rate values higher than the ones obtained in this study, between 1.64 and 1.80%/day for pacu fingerlings, just like Ituassú et al. (2005), who observed values of specific growth rate between 1.4 and 2.4%/day for juvenile pirarucu fed diets with variation of crude protein levels.
Muñoz-Ramirez & Carneiro (2002) observed even higher values of specific growth rate, between 2.27 and 1.76%/day, for the initial stage of growth of pacu fed diets
with different supplementations of lysine and methionine and low protein value.
The lower values of specific growth rate found in this study may be a result from the stress caused on the 32nd day, when 5 animals of each experimental unit were slaughtered in order to reduce density of experimental units and perform bromatological analysis of carcass. This management may have caused a disorder in the shoal that unleashed new disputes for leadership and probably impaired the development of these animals.
The feed used in the experiment had 28% of crude protein (CP), and must not have affected the development of the animals and consequently the variables related to growth, because crude protein level was close to the ideal for juvenile tambaqui recommended by Vidal Junior (1995). That author studied juvenile tambaqui weighting from 30 to 250 g at 25.8 °C and observed maximum performance when animals were fed diets containing 25.1% of CP. Fernandes et al. (2004) also did not observe significant difference between isocaloric feed, but 30 and 26% of crude protein in feed influenced growth of juvenile pacu.
Means calculated for protein efficiency ratio at the end of 48 days were lower than the ones found by Muñoz-Ramirez & Carneiro (2002), who observed protein efficiency ratio between 2.34 and 2.73 for juvenile pacu, and Fernandes et al. (2004), who observed protein efficiency ratio around 3.2 to 2.92 for pacu fingerlings fed diets with different levels and sources of protein. Protein efficiency ratio was also calculated by Carneiro et al. (1992), who subjected juvenile pacu to different stocking densities and feed with different protein levels.
The Linear Response Plateau for specific growth rate was 22:38 hours of light and for rate of daily weight gain was 20:35 hours of light. Therefore, treatments of longer photoperiods are closer to those encounter points between photoperiods and variables.
All other variables studied in this experiment presented a linear behavior during the experimental period, except for feed conversion and protein efficiency ratio. This behavior is described by equations obtained from statistical analysis of those variables by the SAEG software.
Variables Treatments (hours of light)
6 1 2 1 8 2 4
Protein efficiency rate 1 . 6 8 1 . 6 2 1 . 6 5 1 . 6 2
Specific growth rate 0 . 3 7 0 . 4 4 0 . 4 5 0 . 4 8
Daily weight gain rate 1 . 1 0 1 . 1 6 1 . 2 0 1 . 3 1
Density 8 . 3 0 8 . 5 3 8 . 9 2 9 . 2 4
According to the results, the best equations for the following variables were: weight gain, Y = 37.9950+0.5236X; feed intake, Y = 54.8175+1.2304X; total length, Y = 12.0375+0.0466X; and height, Y = 5.1025+0.0216X. For specific growth rate, the equation that best represented the line was Y = 0.3779+0.0038X and for daily weight gain rate, the equation with best adjustment was Y = 1.0237+0.0124X.
Conclusions
Photoperiods affect the variables weight gain, feed intake, feed conversion, total and standard length, height, specific growth rate, protein efficiency ratio and daily weight gain rate, and the highest mean values for these variables are obtained with photoperiods above 15 hours of light.
References
ARAUJO-LIMA, C.A.R.M.; GOMES, L.C. Tambaqui (Colossoma macropomum). In: BALDISSEROTTO, B. GOMES, L.C. (Eds.)
Espécies nativas para piscicultura no Brasil. Santa Maria: Editora da UFSM, 2005. 468p.
ARIDE, P.H.R.; ROUBACH, R.; VAL, A.L. Water pH in central A m a z o n a n d i t s i m p o r t a n c e f o r t a m b a q u i (C o l o s s o m a macropomum) culture. World Aquaculture, v.35, p.24-27, 2 0 0 4 .
C A R N E I R O , D . J . ; WA G N E R , P. M . ; D I A S , T. C . R . E f e i t o d a densidade de estocagem e do nível de proteína bruta da dieta, no desempenho de produção do pacu (Piaractus mesopotamicus). I n : S I M P Ó S I O B R A S I L E I R O D E A Q Ü I C U LT U R A , 1 9 9 2 , Peruíbe. Anais... Jaboticabal: CAUNESP, 1992. p.52-61. FERNANDES, J.B.K.; CARNEIRO, D.J.; SAKOMURA, N.K. Fontes
e níveis de proteína bruta em dietas para alevinos de pacu (Piaractus mesopotamicus). Revista Brasileira de Zootecnia, v.29, p.646-653, 2004.
ITUASSÚ, D.R.; PEREIRA-FILHO, M.; ROUBACH, R. et al. Desenvolvimento de tambaqui submetido a períodos de privação alimentar. Pesquisa Agropecuária Brasileira, v.39, n.12, p.1199-1203, 2004.
ITUASSÚ, D.R.; SANTOS G.R.S.; ROUBACH, R. et al. Níveis de proteína bruta para juvenis de pirarucu. Pesquisa Agropecuária Brasileira, v.40, n.3, p.255-259, 2005.
L I A O , I . C . ; S U , H . M . ; C H A N G , E . Y. Te c h n i q u e s i n f i n f i s h larviculture in TAIWAN. Aquaculture, v.200, p.1-31, 2001. LUZ, R.K.; SALARO, A.L.; SIROL, R.N. et al. Influência do fotoperíodo no desenvolvimento inicial de surubim cachara (Pseudoplatystoma fasciatum).In: REUNIÃO ANUAL DA SOCIEDADE BRASILEIRA DE ZOOTECNIA, 37., 2000, Viçosa, MG. Anais... Viçosa, MG: Sociedade Brasileira de Zootecnia: [2000]. (CD-ROM)
MELO, L.A.S.; IZEL, A.C.U.; RODRIGUES, F.M. Criação de tambaqui (Colossoma macropomum) em viveiros de argila/ b a r r a g e n s n o e s t a d o d o A m a z o n a s. M a n a u s : E m b r a p a Amazônia Ocidental, 2001. 30p.
MOUSTAKAS, C.T.; WATANABE, W.O.; COPELAND, K.A. Combined effects of photoperiod and salinity on growth, survival, and osmoregulatory ability of larval southern flounder (Paralichthys lethostigma). Aquaculture, v.229, p.159-179, 2004.
MUÑOZ-RAMIREZ A.P.; CARNEIRO D.J. Suplementação de lisina e metionina em dietas com baixos níveis protéicos para o c r e s c i m e n t o i n i c i a l d o p a c u , P i a r a c t u s m e s o p o t a m i c u s (holmberg). Acta Scientiarum, v.24, p.909-916, 2002. PUVANENDRAN, V.; BROWN, J.A. Foraging, growth and survival
of Atlantic cod larvae reared in different light intensities and photoperiods. Aquaculture, v.214, p.131-151, 2002. REYNALTE-TATAJE, D.; LUZ, S.M.; ZAMBONI-FILHO, E. et al.
Influência do fotoperíodo no crescimento e sobrevivência de pós-larvas de piracanjuba Brycon orbignyanusi (Valenciennes, 1849) (Osteichthyes, Characidae). Acta Scientiarum, v.24, p . 4 3 9 - 4 4 3 , 2 0 0 2 .
SALARO, A.L; LUZ, R.K.; ZUANON, J.A.S. et al. Desenvolvimento de alevinos de trairão (Hoplias lacerdae) na ausência de luz.
Acta Scientiarum. Biological Sciences, v.28, p.47-50, 2006. SILVA, A.B.; CARNEIRO-SOBRINHO, A.; MELO, F.R. Desova induzida de tambqui, Colossoma macropomum, Cuvier, 1818, com uso de hipófise de curimatá comum, Prochilodus cearensis Steindachner. In: DNOCS (Ed). 2ª Coletânea de trabalhos técnicos. Fortaleza, 1981. p.519-532.
TRIPPEL, E.A.; NEIL, S.R.E. Effects of photoperiod and intensity on growth and activity of juvenile haddock (Melanogrammus aeglefinus) light. Aquaculture, v.217, p.633-645, 2003. TROTTER, A.J.; BATTAGLENE, S.C; PANKHURST, P.M. et al.
Effects of photoeriods and light intensity on initial swin bladder i n f l a t i o n , g r o w t h a n d p o s t i n f l a t i o n v i a b i l i t y i n c u l t u r e d stripped trumpeter (Latris lineatus) larvae. Aquaculture, v.224, p.141-158, 2003.
V I D A L J U N I O R , V. V. N í v e i s d e p ro t e í n a p a r a t a m b a q u i
(Colossama macropomum Curvier, 1818) dos 30 aos 250 g
de peso vivo. 1995. 49f. Tese (Mestrado em Zootecnia) -Universidade Federal de Viçosa, Viçosa, MG.