Does the tolerance of sugarcane to excess water in the soil depend on the stage
of development?
A tolerância da cana-de-açúcar ao excesso de água no solo depende do estádio
de desenvolvimento?
DOI:10.34117/bjdv5n11-380
Recebimento dos originais: 07/10/2019 Aceitação para publicação: 02/12/2019
Kelly Tagianne Santos de Souza
Doutora em Ciências (Irrigação e Drenagem) pela Escola Superior de Agricultura “Luiz de Queiroz” Instituição: Universidade Federal de Roraima
Endereço: Av. Cap. Ene Garcês, n° 2413 - Aeroporto, Boa Vista - RR, Brasil E-mail: kelly.souza@ufrr.br
Sergio Nascimento Duarte
Doutor em Engenharia Agrícola pela Universidade Federal de Viçosa Instituição: Universidade de São Paulo
Endereço: Avenida Pádua Dias, 11, Piracicaba - SP, Brasil E-mail: snduarte@usp.br
Nildo da Silva Dias
Doutor em Agronomia pela Escola Superior de Agricultura “Luiz de Queiroz” Instituição: Universidade Federal Rural do Semi-Árido
Endereço: Avenida Francisco Mota, 572, CEP 59525- 900, Mossoró - RN, Brasil E-mail: nildo@ufersa.edu.br
Hozano de Souza Lemos Neto
Doutor em Agronomia/Fitotecnia pela Universidade Federal do Ceará Instituição: Universidade Federal Rural do Semi-Árido
Bolsista de Pós-Doutorado Júnior (PDJ/CNPq; Proc.154458/2018-0) Endereço: Avenida Francisco Mota, 572, CEP 59525- 900, Mossoró - RN, Brasil.
E-mail: hozanoneto@hotmail.com
Antonio Clarette Santiago Tavares
Doutor em Ciências (Irrigação e Drenagem) pela Escola Superior de Agricultura “Luiz de Queiroz” Instituição: Instituto Federal do Norte de Minas Gerais
Endereço: Campus Almenara, BR 367, km 07, s/n, Zona Rural, Almenara - MG, Brasil E-mail: antonioirrigacao@yahoo.com.br
Osvaldo Nogueira de Sousa Neto
Doutor em Engenharia de Sistemas Agrícolas pela Escola Superior de Agricultura “Luiz de Queiroz”
Instituição: Universidade Federal Rural do Semi-Árido
Endereço: Rua Gamaliel Martins Bezerra, s/n, 59515-000, Angicos - RN, Brasil E-mail: osvaldo.neto@ufersa.edu.br
Bruno Goulart de Azevedo Souza
Engenheiro Agrônomo pela Universidade Federal Rural do Semi-Árido Instituição: Universidade Federal Rural do Semi-Árido
Endereço: Avenida Francisco Mota, 572, CEP 59525- 900, Mossoró - RN, Brasil E-mail: goulart.bruno@hotmail.com
ABSTRACT
Soil water logging reduces the availability of oxygen to the roots of the plants, which makes necessary an efficient drainage system for correction. Thus, the objective of this study was to evaluate the tolerance of sugarcane in flooded crop with different velocities of lowering the groundwater in three stages of ratoon sugarcane development. The experiment was carried out in a randomized complete block design (3 x 5 + 1), with three developmental stages (44, 210 and 305 days after planting) and five groundwater falling velocities (30 cm in 3, 6, 9, 12 and 15 days) and the control (irrigation without flooding the soil). There was a significant effect for groundwater retraction velocities and evaluation periods for leaf area (LA) and leaf area index. The treatments P1V4 and P2V3 presented the highest LAs (0.91 m²). The first sugarcane ratoon was tolerant to soil waterlogging at different stages of development and to different groundwater falling velocities, with no major losses in plant development and productivity, however, for total recoverable sugar cane ratoon was more sensitive when the flood occurred in the regrowth stage.
Key words: Waterlogging, water table, drainage, reducing sugar.
RESUMO
O encharcamento do solo reduz a disponibilidade de oxigênio às raízes das plantas, o que torna necessário um sistema eficiente de drenagem para correção. Objetivou-se avaliar a tolerância da cana-de-açúcar em cultivo inundado com diferentes velocidades de rebaixamento do nível freático em três estádios de desenvolvimento da cana-soca. O experimento foi conduzido no delineamento de blocos casualizados, em arranjo fatorial de (3 x 5 + 1), sendo três estádios de desenvolvimento (44, 210 e 305 dias após o plantio) e cinco velocidades de rebaixamento do nível freático (30 cm em 3, 6, 9, 12 e 15 dias) e o controle (irrigação sem inundação do solo). Houve efeito significativo para velocidades de rebaixamento do nível freático e períodos de avaliação para área foliar (AF) e índice de área foliar. Os tratamentos P1V4 e P2V3 foram os que apresentaram as maiores AFs (0,91 m²). A primeira soca da cana-de-açúcar mostrou-se tolerante ao encharcamento do solo nos diferentes estádios de desenvolvimento e para as diferentes velocidades de rebaixamento do nível freático, sem maiores prejuízos no desenvolvimento da planta e na produtividade. Entretanto, para o açúcar total recuperável, a cana-soca apresentou-se mais sensível quando a inundação ocorreu no estádio de rebrota.
Palavras-chave: Encharcamento, nível freático, drenagem, açúcar redutor do colmo.
1 INTRODUCTION
Brazil is the world's largest producer of sugarcane and in 2018 production reached about 620.44 million tons in an area 8.59 million hectares with 29.04 million tons of sugar and 33.14 billion liters of ethanol (CONAB, 2019). In the last years, with increasing global demand for ethanol from renewable sources, allied to large cultivated areas and favorable climate and soil conditions, Brazil
has become the main exporter of this agricultural commodity with an tendency in increase of cultivated area due its use in the production of refined sugar and ethanol, which generates high economic value (LIMA, 2012; GALON et al. 2012).
The longevity of the sugarcane field is important in many aspects, because the increase of cuts number and the renewal time of the sugarcane field, resulting in the economy of the activity.
The area under cultivation of irrigated sugarcane has increased worldwide a lot, mainly in arid and semi-arid zones. This increase brings an increment agricultural production, although due to the lack of proper irrigation management there is water accumulation in the underground zone caused by leakage and percolation losses. Thus, in many irrigated areas around the world, the rising groundwater levels cause soaking and salinity problems.
Waterlogging problems are associated with poor drainage of irrigated soils, which did not expand at the same rate as irrigation if irrigators neglect to maintain drainage facilities (TANJI; KIELEN, 2002). Thus, it is necessary to know the effects of stress due to excess moisture on successive cuts, both in cane plant and in ratoon.
In Brazil, there is availability of large areas potentially able to increase sugarcane cultivation. However, some have poor natural drainage such as floodplain or mid-slope areas, areas subject to temporary groundwater interference and unfavorable topography, subject to temporary accumulation of water from surface runoff, areas with recovering soils degraded by inadequate management, and also areas in highlands whose soils are of structure or texture that cause low water infiltration capacity (CALHEIROS et al., 2000). Correcting such problems requires the use of properly sized drainage systems, taking into account technical and environmental criteria.
Empirically adopting drainage systems is often responsible for sugarcane failure. Thus, for the use of artificial drainage, studies are required with values representative of the physical-water and geometric properties of the soil profile, as well as physiological (MINGOTI et al., 2006). Studies of this nature with ratoon crops are still non-existent; the few we have are with cane plant, such as those by (TAVARES et al., 2017a, b; TAVARES et al., 2018a, b). Thus, the objective of this study was to evaluate the tolerance of sugarcane in flooded crop with different velocities of lowering the groundwater in three stages of ratoon sugarcane development.
2 MATERIALS AND METHODS
The experiment was carried out in a protected environment of the Department of Biosystems Engineering of the Luiz de Queiroz College of Agriculture (ESALQ), Piracicaba-SP (22° 42 'S, 47° 38' W and 540 m altitude). The climate of the region, according to Koppen is CWa type (humid tropical), with the months of June, July and August being the driest, with summer rains and winter droughts, the warmest month average temperature over 22 ºC and the coldest month below 18 °C.
The experiment was carried out in a randomized block design using factorial scheme [(3 x 5) + 1], with 4 replications, totaling 64 plots. The treatments consisted of three developmental stages in which soaking was applied (44, 210 and 300 days after planting - DAP, P1, P2 and P3, respectively) and five groundwater lowering velocities: lowering to a depth of 30 cm at velocities of 3; 6; 9; 12 and 15 days (V1, V2, V3, V4 and V5, respectively) and one treatment with floodless irrigation (control, T).
The ratoon sugarcane (cultivar RB 867515) was grown in lysimeters installed inside the protected environment. These lysimeters consist of 1.2 m high and 0.5 m diameter waterproofed concrete pipes, totaling 0.20 m² of planted area and 240 liters of usable volume.
To supply the lysimeters with water, two 1000-liter asbestos cement reservoirs were used, containing a float key 1.8 m from the ground surface on a wooden platform (2.5 m lenght, 1.6 m width). and 1.6 m high) inside the protected environment interior. The water inlets of the lysimeters was connected to the auxiliary mobile reservoirs, allowing to maintain the water table inside the lysimeters at the desired depth.
Orifices near the base of the lysimeters were made for water inlet and drainage using 19 mm diameter PVC pipes. The pipes measured 0.60 m lenght and 5 mm perimeter spaced 0.05 m facilitating drainage and avoiding. In order to facilitate drainage and transport of soil particles Bidim type geotextile blanket (OP - 20) was used in the 0.10 m layer of gravel. Water supply to the plants occurred individually for each experimental plot at the bottom of the lysimeter connected to a PVC reservoir and float to control the depth of the water table.
Flooding of the first period (P1) occurred at 44 DAC (days after cutting), when the plants were in the regrowth stage. The second period (P2) flooding occurred at 210 DAC, when the plants were in production formation stage. In the third period (P3) at 300 DAC, the stage at which the cane was maturing, this period being close to harvest.
The effect of flooding on plants was studied by progressively lowering of the water level to a depth of 30 cm at 3, 6, 9, 12 and 15 days after maintaining a 2 cm slide above the soil surface by 12 hours. Then, the progressive lowering was performed until the total lysingrage drainage. Each lysimeter was flooded only once, when the plant reached the established phenological stage, except for the control (control) treatment, which was only irrigated by sub-irrigation.
To establish the intermediate depths of the water table, related to the different treatments during the lowering, the methodology of Boussinesq and Glover was used (SCHILFGAARDE, 1974).
The lysimeters were filled with Red Latosol soil, loam-sandy texture, taken from its natural profile in the 0 - 50 cm layer. The fertilization consisted of the application of 341 kg ha-1 of split
potassium nitrate in three times, at 29 DAC, 87 DAC, 135 DAC and another 83.33 kg ha-1 of splitted urea twice.
After cutting cane-plant, the water table of all lysimeters was raised and maintained at 0.40 m depth; and valves were opened for under-irrigation for a period of 24 hours without concern for applying a specific slide; only to provide adequate moisture for regrowth and new root development.
Sugarcane was under-irrigated throughout its cycle, except during the periods when treatment was being applied. At the end of the application of the treatments, which consisted of lowering the water level to a depth of 0.80 m, irrigation of these plants began again, at a time when the reading of tensiometers installed at 0.30 m depth reached 25 kPa. Tensiometers were read weekly using a digital tensiometer.
In the moment that the set voltage was reached, the reservoir valves were opened for under-irrigation for a period of 24 hours with the water table sustained at a depth of 0.50 m. Thus, the amount of water applied was sufficient to raise soil moisture to field capacity. The sub-irrigation system used was the same system used for lysimeter flooding. Irrigation was stopped one week before harvest.
The harvest of the ratoon cane was performed at 317 days after planting, when the number of stalks, number of internodes, stalk diameter, plant height, stalk dry mass, root dry mass and stalk technological characteristics were evaluated.
The stalks were cut close to the soil, cutting off the top for harvest, considering the +5 leaf. The aerial part were separated and weighed, including leaves, palm stalks and stalks; and later these materials were dried in a forced air circulation oven at 60 °C, until constant weight, for dry mass evaluation.
The roots were removed in shackles extracting the whole volume of soil; it was separated into two layers 0-0.40 m and 0.40-0.80 m. The roots placed on workbenches were properly washed and weighed and subsequently brought to the forced air circulation oven at 60 °C until a constant mass was obtained.
Seven evaluations of plant height, number of leaves, number of internodes, leaf area, leaf area index, number of tillers, and six stalk diameter evaluations were performed. The evaluation periods (EP) occurred at 91 DAC, 131 DAC, 194 DAC, 223 DAC, 256 DAC, 290 DAC and 317 DAC.
To estimate the leaf area (LA) we measured the length and width of the +3 leaf of all stems that had exposed internode, and the Hermann and Câmara equation (1999) was used:
Where: LAs = Leaf Area of Stalk, cm2; C = Lenght of the leaf +3, cm; W = largest leaf width +3 cm;
f = form factor (0.66); N = number of leaves fully open and with at least 20% green area (from leaf +1 to leaf +7); 2 = correction factor.
The leaf area index (LAI) was calculated by the equation:
LAI = (LA/SA) * Npp (2)
Where: LA – Leaf Area, cm²; SA – Soil Area, cm²; Npp - number of plants per plot.
The number of tillers was determined by counting the number of tillers of each plot, along the sugarcane first ratoon cycle. The tillers were considered the stalks that do not have the +3 leaf and internodes exposed.
The stalk diameter was obtained with the use of a digital caliper rule, being measured at the base of the stalk in the middle portion of the 3rd internode. Already the number of leaves was considered only the fully expanded leaves, that is, those with the visible collar with at least 20% of its green leaf area. The height of the plants was quantified with the help of a measuring tape, measuring the height from its base, close to the ground, until the leaf insertion +1.
To determine the technological characteristics, the stalks were sent to the Sugar and Alcohol Technology Laboratory of the ESALQ - USP Department of Agribusiness and Food Technology.
The determinations of °Brix, Pol, reducing sugars (RS), total recoverable sugar (TRS) and fiber, followed the methodology of CONSECANA (2006). The sample to be analyzed, resulting from the mixing of simple samples, was prepared in a disintegrating apparatus and then homogenized in a concrete mixer. The juice was extracted in a hydraulic press with a minimum and constant pressure after pressing of 250 kgf cm-2 over the sample for one minute.
The °Brix (percentage by mass of soluble solids) was performed in a digital refractometer with automatic temperature correction with a maximum resolution of 0.1 °Brix.
Juice Pol (S) was calculated by the following equation:
S = Lal (0.2605 – 0.0009882 * B) (3)
Where: Lal - saccharin reading, obtained with a clarifying mixture based on lead subacetate; B - °Brix of sugar cane juice.
Juice reducing sugars (RS) were determined by the equation: RS= (3.641 – 0.0343 * P); where: RS - juice reducing sugars (%); P - apparent purity. For sugarcane reducing sugars (SRS) was used the equation:
SRS = RSj * (1 – 0.01 * Fpcts) · (1.0313 – 0.00575 * Fpcts) (4)
Where: SRS – sugarcane reducing sugars, %; RSj – reducing sugars of juice, %;
Fpcts – cane fiber, %.
Finally, the theoretical recoverable sugar (TRS) was calculated using the equation:
TRS = (9.5263 * CP) + (9.05 * SRS) (5)
Where: TRS = theoretical recoverable sugar in kg mg-1 of sugarcane stalks; CP (saccharose) = cane pol (%); SRS = sugarcane reducing sugars, %.
Apparent purity (AP) refers to the percentage of sucrose in total soluble solids (°Brix), and is calculated by the equation:
AP = (POL/BRIX) * 100 (6)
In its turn the fiber consists of the woody part of the cane, insoluble in water. The determination was made from sugarcane fiber by the CONSECANA (2006) equation, that is:
F = 0.08*WBW + 0.876 (7)
Where: F - fiber, g; WBW - wet bagasse weight, g.
The obtained data were subjected to analysis of variance via F test and means compared by Tukey and Dunnett tests at 0.05 probability, for comparison of means between treatments and treatments as the control, respectively.
3 RESULTS
According to ANOVA there is a significant effect on the groundwater lowering velocities and developmental stages for the variables leaf area (LA), leaf area index (LAI), number of tillers (NT), stalk height and number of leaves (NL). The stalk diameter differed only in relation to the developmental stages.
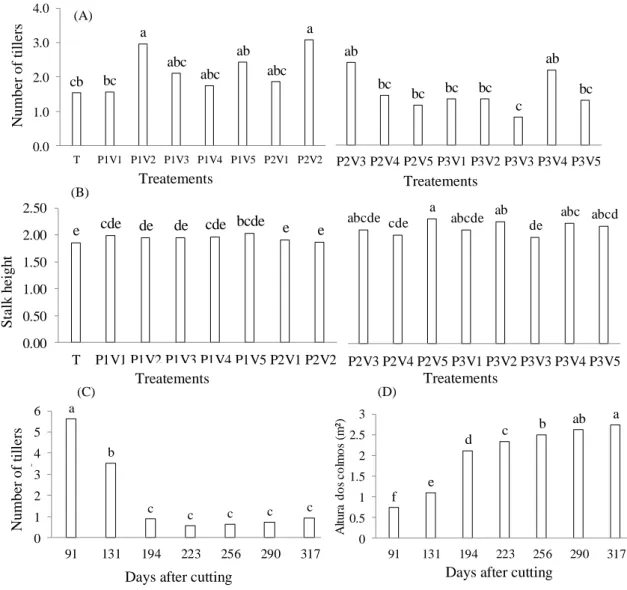
Plants submitted to the management of groundwater levels P1V4 (development stage at 44 DAP and lowering to a depth of 30 cm at 12 days velocity) and P2V3 (development stage at 210 DAP and lowering of 30 cm at 9 days velocity) reached the highest leaf area averages, being 0.91 m² and the lowest mean control (0.71 m²) (Figure 1A). The flood management applied at 44 DAPS (period P1) in the regrowth stage resulted in plants with higher LA averages. There was an increase in LA until 194 DAC, when the plants were at an early stage of development (Figure 1 C).
Figure 1 - Leaf area (LA) and leaf area index (LAI) of 'ratoon' sugarcane as a function of groundwater lowering speed and developmental stages. Means followed by the same letter do not differ statistically by the 0.05 probability tukey test.
The leaf area index (LAI) showed the same behavior as LA (Figure 1B). The plants of the plots of the first flooding period (P1) due to the different lowering velocities, presented higher indices, ranging between 3.84 and 4.48 for P1V1 and P1V4, respectively. Sugarcane plants submitted to the 0.30 m lowering velocity management in 9 days obtained higher LAI, for P2 and P3 (0.90 and 0.89). Considering only the days after cane plant cutting as the cause of variation, there was an increase in the LAI until 194 DAC, and subsequent reduction and stabilization until harvest (Figure 1D).
The largest number of tillers was obtained when the flooding occurred at 44 DAC (regrowth period) and 210 DAC (production formation period), for the 0.3 m lowering velocity in 6 days (V2) (Figure 2A). For the evaluated periods, highest means (5 and 3 tillers) were observed in the counts performed at 91 and 131 days after cutting, reducing to one in the other evaluations (Figure 2C).
d c a b b bc bc 0 1 2 3 4 5 6 91 131 194 223 256 290 317 IA F
Dias após o corte ab ab b ab ab ab ab ab 0.00 1.00 2.00 3.00 4.00 5.00 P2V3 P2V4 P2V5 P3V1 P3V2 P3V3 P3V4 P3V5 IA F Tratamentos a abc bc abc abc ab abc abc 0.00 0.20 0.40 0.60 0.80 1.00 P2V3 P2V4 P2V5 P3V1 P3V2 P3V3 P3V4 P3V5 Á re a F o lia r (m ²) Tratamentos c abc abc ab a ab bc abc 0.00 0.20 0.40 0.60 0.80 1.00 T P1V1 P1V2 P1V3 P1V4 P1V5 P2V1 P2V2 Á re a F o lia r (m ²) Tratamentos b ab ab ab a ab b b 0.00 1.00 2.00 3.00 4.00 5.00 T P1V1 P1V2 P1V3 P1V4 P1V5 P2V1 P2V2 IA F Tratamentos d c a b b c cb 0.00 0.20 0.40 0.60 0.80 1.00 1.20 1.40 91 131 194 223 256 290 317 Á re a F o lia r (m ²)
Dias apos o corte (A)
(B)
(C) (D)
Treatements
Treatements
Days after cutting
L ea f are a (m 2)
Days after cutting Treatements Treatements L ea f a re a (m 2) L A I Treatements
Figure 2 - Number of tillers and mean height of 'ratoon' sugarcane stalks as a function of groundwater lowering velocity and different stages of development. Means followed by the same letter do not differ statistically by the 0.05 probability tukey test.
In the plots of the control plants showed lower mean height of stalks, probably because it did not suffer flood stress with 1.85 m. The plants of P2V5 presented higher height, being recorded an mean of 2.26 m (Figure 2B). There were significant differences in average plant development over the evaluation periods, except at 290 DAC (Figure 2D); this period corresponds to maturation when the plant stops growing and begins to concentrate sugar.
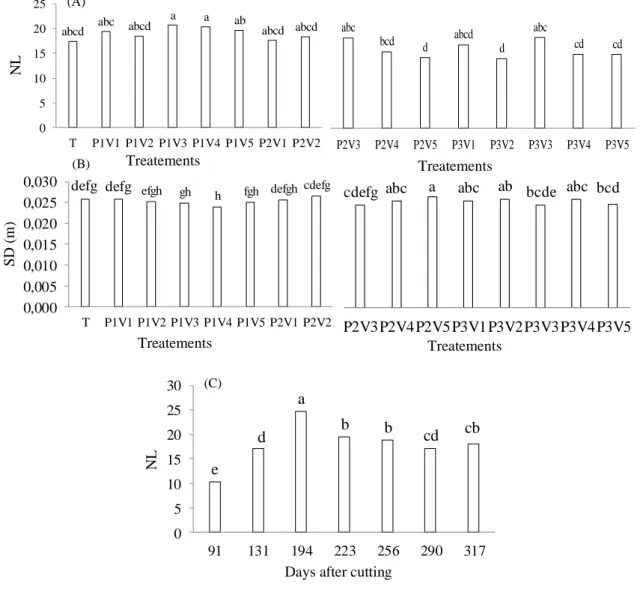
The largest number of leaves (NL) was found in the plants of treatment P1V3 (20 leaves) and the smallest for P3V2, with means of 14 leaves (Figure 3A). The NL increased until 194 DAC, with subsequent reduction in the following dates (Figure 3C). For the stalk diameter, P1V4 presented the lowest value at 0.024 m, and P2V5 provided the highest value at 0.029 m in diameter (Figure 3B).
abcde cde a abcde ab de abc abcd
0.00 0.50 1.00 1.50 2.00 2.50 P2V3 P2V4 P2V5 P3V1 P3V2 P3V3 P3V4 P3V5 A lt u ra d o s c o lm o s (m ) Tratamentos ab bc bc bc bc c ab bc 0.0 1.0 2.0 3.0 4.0 P2V3 P2V4 P2V5 P3V1 P3V2 P3V3 P3V4 P3V5 N ú m er o d e p er fi lh o Tratamentos cb bc a abc abc ab abc a 0.0 1.0 2.0 3.0 4.0 T P1V1 P1V2 P1V3 P1V4 P1V5 P2V1 P2V2 N ú m er o d e p er fi lh o Tratamentos
e cde de de cde bcde e e
0.00 0.50 1.00 1.50 2.00 2.50 T P1V1 P1V2 P1V3 P1V4 P1V5 P2V1 P2V2 A lt u ra d o s c o lm o s (m ) Tratamentos a b c c c c c 0 1 2 3 4 5 6 91 131 194 223 256 290 317 N ú m er o d e p er fi lh o s
Dias após o corte
f e d c b ab a 0 0.5 1 1.5 2 2.5 3 91 131 194 223 256 290 317 A lt u ra d o s c o lm o s (m ²)
Dias após o corte
(A)
(B)
(C) (D)
Treatements Treatements
Treatements Treatements
Days after cutting Days after cutting
N um be r of t il le rs S ta lk h e igh t N um be r of t il le rs
Figure 3 - Mean number of leaves (NL) and mean stalk diameter (SD) of 'ratoon' sugarcane as a function of groundwater lowering velocity and different stages of development. Means followed by the same letter do not differ statistically by the 0.05 probability tukey test.
Also, according to ANOVA, there was significant effect only for the developmental stages for fresh mass of the top (FMT) and dry mass for the top (DMT), when analyzed separately without the control treatment (control). Stalk fresh mass (SFM), stalk dry mass (SDM), total fresh mass (TFM) and total dry mass (TDM) did not differ significantly.
The flooding occurred in the budding stages, of maximum development and maturity stages did not interfere in the production of sugarcane phytomass, since the SFM values at 44, 210 and 300 DAC were 4.65, 4.12 and 4.43 kg, respectively (Figure 4A). SDM ranged from 1.01 to 1.44 kg (P2V1 and P1V5) (Figure 4B).
cdefg abc a abc ab bcde abc bcd
0,000 0,005 0,010 0,015 0,020 0,025 0,030 0,035 P2V3 P2V4 P2V5 P3V1 P3V2 P3V3 P3V4 P3V5 D C ( m ) Tratamentos defg defg efgh gh
h fgh defgh cdefg 0,000 0,005 0,010 0,015 0,020 0,025 0,030 T P1V1 P1V2 P1V3 P1V4 P1V5 P2V1 P2V2 D C (m ) Tratamentos abc bcd d abcd d abc cd cd 0 5 10 15 20 25 P2V3 P2V4 P2V5 P3V1 P3V2 P3V3 P3V4 P3V5 NF Tratamentos
abcd abc abcd
a a ab abcd abcd 0 5 10 15 20 25 T P1V1 P1V2 P1V3 P1V4 P1V5 P2V1 P2V2 NF Tratamentos e d a b b cd cb 0 5 10 15 20 25 30 91 131 194 223 256 290 317 NF
Dias após o corte
(A) (B) (C) NL S D (m ) NL Treatements Treatements Treatements Treatements
Figure 4 - Stalk fresh and dry mass (SFM and SDM), fresh and dry mass of the top (FMT and DMT), total fresh and dry mass (TFM and TDM) of cane stalk as a function of level lowering velocity of water and different stages of development. Means followed by the same letter do not differ statistically by the 0.05 probability tukey test and when compared to the Control, means followed by the same letter do not differ from each other by the Dunnet test at 0.05 probability.
For the FMT the highest value was 0.56 kg at 44 DAC (Figure 4C). A similar result to that obtained in the FMT was observed for the dry mass of the top, as this parameter is the dehydrated green mass, with the highest value of 0.151 kg at 44 DAC (Figure 4D). The TFM was higher in treatments P1V5 and P2V3 (5.54 and 5.45 kg). The first period (44 DAC) presented the highest dry mass value 1.5 kg and the control the smallest, with 1.2 kg (Figure 4E, F).
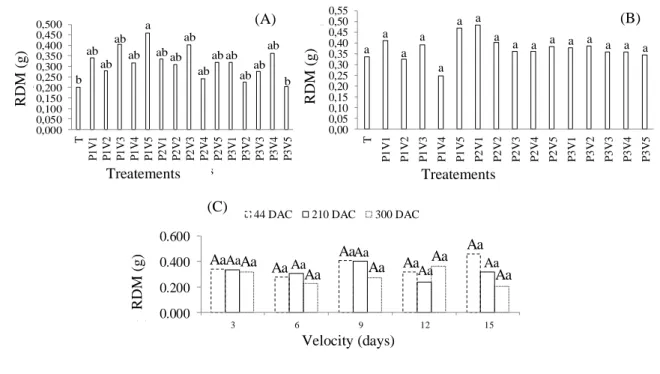
The root dry mass, when analyzed separately, without control treatment, revealed that there was interaction between the developmental stages and groundwater lowering velocity in the 0 to 0.40 m depth. The treatments with the highest and lowest means were P1V5 and P3V5 (0.46 and 0.21 kg) (Figure 5A). a a a a 0.00 1.00 2.00 3.00 4.00 5.00 T 44 210 300 M F C ( k g ) Períodos a a a a 0.00 0.50 1.00 1.50 T 44 210 300 M S C ( k g ) Períodos a a a a 0,00 0,10 0,20 0,30 0,40 0,50 0,60 T 44 210 300 M F P ( k g ) Períodos a a a a 0.00 0.05 0.10 0.15 0.20 T 44 210 300 M S P ( k g ) Períodos a a a a 0.00 1.00 2.00 3.00 4.00 5.00 6.00 T 44 210 300 MF T ( k g ) Períodos a a a a 0.00 0.50 1.00 1.50 2.00 T 44 210 300 M S T ( k g ) Períodos (A) (B) (C) (D) (E) (F) Periods Periods Periods Periods Periods Periods S F M (kg) S D M (kg) F M T (kg ) D M T (kg ) T M F (kg ) T D M (k g )
Figure 5 - Root dry mass (RDM) at a depth of 0-0.40 and 0.40-0.80 m of 'ratoon' sugarcane as a function of lowering groundwater velocity and different stages of development. Means followed by the same letter do not differ statistically by the 0.05 probability tukey test.
Root dry mass did not differ significantly (Figure 5B). It was noticed that there was a greater variation of root dry mass between flooding periods than between NL lowering velocities (Figure 5C).
For °Brix, Pol, sugarcane reducing sugar (SRS) and theoretical recoverable sugar (TRS) there was significant effect only between the developmental stages. Already the percentage of fiber showed no difference.
Treatments P2V5 and P1V2 had the highest and lowest mean °Brix (17.92 and 16.77%) and the treatment that did not suffer from excess water (control) had °Brix of 17.27 (Figure 6A). The °Brix means for the periods 44, 210, 300 DAC were 17.06; 17.43 and 17.34, respectively. An increase is seen at 210 and a slight decrease in ° Brix when the flood occurred at 300 DAC.
Figure 6 - Means of °Brix and Pol of 'ratoon' sugarcane as a function of lowering groundwater velocity and different stages of development. Means followed by the same letter do not differ statistically by the 0.05 probability tukey test.
a a a a a a a a a a a a a a a a 0,00 0,05 0,10 0,15 0,20 0,25 0,30 0,35 0,40 0,45 0,50 0,55 T P 1 V 1 P 1 V 2 P 1 V 3 P 1 V 4 P 1 V 5 P 2 V 1 P 2 V 2 P 2 V 3 P 2 V 4 P 2 V 5 P 3 V 1 P 3 V 2 P 3 V 3 P 3 V 4 P 3 V 5 M S R ( g ) 4 0 -0 .8 0 m Tratamentos b ab ab ab ab a ab ab ab ab ab ab abab ab b 0,000 0,050 0,100 0,150 0,200 0,250 0,300 0,350 0,400 0,450 0,500 T P 1 V 1 P 1 V 2 P 1 V 3 P 1 V 4 P 1 V 5 P 2 V 1 P 2 V 2 P 2 V 3 P 2 V 4 P 2 V 5 P 3 V 1 P 3 V 2 P 3 V 3 P 3 V 4 P 3 V 5 M S R ( g) 0 -0, 40 m Tratamentos Aa Aa Aa Aa Aa Aa Aa Aa Aa Aa Aa Aa Aa Aa Aa 0.000 0.200 0.400 0.600 3 6 9 12 15 M S R ( k g ) 0 -0 ,4 0 m Velocidade (dias)
44 DAC 210 DAC 300 DAC
(A) (C) (B) RD M (g) RD M (g) RD M (g) Treatements Treatements Velocity (days)
The P2V5 and P3V1 treatments presented the highest saccharose percentages (16.30 and 16.29%) (Figure 6B). The treatments composed by the flood period P1 (44 DAC) and the lowering velocities of 0.3 m depth at 3, 6, 9, 12 and 15 days presented the lowest mean values of Pol. Regarding the evaluation periods, the highest mean was 300 DAC (15.97%), while the flooding applied to 44 DAC provided lower values.
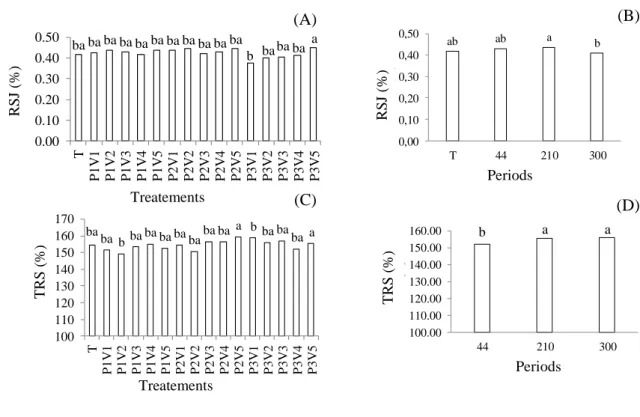
The P3V5 treatment presented the highest mean of reducing sugar of juice (RSJ) (0.45%) and the lowest P3V1 (0.38%) (Figure 7A). The flood applied at 300 DAC presented the lowest means. However, it is found that when the reduction in lowering velocities from 3 to 15 days occurs, the RSJ increases. As already reported, flooding at 300 DAC provided lower RSJ values when compared to other periods (Figure 7B).
ba ba b ba ba ba ba ba ba ba a ba ba ba ba ba 10 12 14 16 18 20 T P 1 V 1 P 1 V 2 P 1 V 3 P 1 V 4 P 1 V 5 P 2 V 1 P 2 V 2 P 2 V 3 P 2 V 4 P 2 V 5 P 3 V 1 P 3 V 2 P 3 V 3 P 3 V 4 P 3 V 5 B R IX (% ) Tratamentos b a ab 10,00 12,00 14,00 16,00 18,00 44 210 300 B R IX ( % ) Períodos ba ba b ba ba ba ba baba ba a a ba ba ba ba 10 11 12 13 14 15 16 17 T P 1V 1 P 1V 2 P 1V 3 P 1V 4 P 1V 5 P 2V 1 P 2V 2 P 2V 3 P 2V 4 P 2V 5 P 3V 1 P 3V 2 P 3V 3 P 3V 4 P 3V 5 P ol ( % ) Tratamentos b ab a 10.00 11.00 12.00 13.00 14.00 15.00 16.00 17.00 44 210 300 P ol ( % ) Períodos (A) (C) (B) (D) Treatements Treatements Periods Periods
Figure 7 - Means of reducing sugars of juice (RSJ) and total recoverable sugars (TRS) of sugarcane "ratoon" as a function of lowering velocity of the water table and different stages of development. Means followed by the same letter do not differ statistically by the 0.05 probability tukey test.
Treatments P2V5 and P3V4 had the highest and lowest mean TRS (159.32 and 152.28 kg mg -1 sugarcane-1) and the Control provided 154.64 kg mg-1 sugarcane-1. Flooding occurred at 44 DAC
(period when the plants were in regrowth), at different velocities, resulted in the lowest TRS values, suggesting that this period is the most sensitive. The lowest TRS value was obtained when flooding was applied at 44 DAC (Figure 7C, D).
4 DISCUSSION
Soils with waterlogging problems, reduced oxygen availability (hypoxia and anoxia) have direct effects on roots and indirectly on plants aerial part, which may affect growth and yield (MALIK; TOMER, 2003, YIN et al. 2009, ISLAM et al. 2011). It is important to point out that time of stress exposure, plant developmental stage, cultivar and environmental conditions are factors that define tolerance or sensitivity of plants to anoxitic stress (TAVARES et al. 2015). Thus, the focus of this study was precisely to evaluate the tolerance of sugarcane to waterlogging and to verify if the developmental stage interferes with this process.
The effects of flooding at different stages of sugarcane development (44, 210 and 300 DAC) and lowering velocities were not severe enough to impair plant development, with time to recover from stress and continue the process of flooding. Growth without physiological interference. From
ba ba ba ba ba ba ba ba ba ba ba b baba ba a 0.00 0.10 0.20 0.30 0.40 0.50 T P 1V 1 P 1V 2 P 1V 3 P 1V 4 P 1V 5 P 2V 1 P 2V 2 P 2V 3 P 2V 4 P 2V 5 P 3V 1 P 3V 2 P 3V 3 P 3V 4 P 3V 5 A R C ( % ) Tratamentos ab ab a b 0,00 0,10 0,20 0,30 0,40 0,50 T 44 210 300 A R C ( % ) Períodos ba ba b baba ba ba baba ba a b ba baba a 100 110 120 130 140 150 160 170 T P 1V 1 P 1V 2 P 1V 3 P 1V 4 P 1V 5 P 2V 1 P 2V 2 P 2V 3 P 2V 4 P 2V 5 P 3V 1 P 3V 2 P 3V 3 P 3V 4 P 3V 5 A T R ( % ) Tratamentos b a a 100.00 110.00 120.00 130.00 140.00 150.00 160.00 44 210 300 A T R ( % ) Períodos (A) (C) (B) (D) Treatements Treatements Periods Periods RS J (%) RS J (%) T RS ( %) T RS ( %)
flooding on P1, there was a reduction at 223 DAC and subsequent stabilization of LA due to early ratoon cane cycle. When working with sugarcane, Tavares et al. (2018b), using cane-plant, obtained LA values ranging from 0.56 to 0.74 m² for flooded treatments and, for the control, 0.70 m², values lower than those obtained for ratoon sugarcane.
It can be inferred that the intensity of the stress applied by the flood was not enough to impair the development of the sugarcane, since the main effect of flooding on the aerial plant area is the inhibition of leaf expansion and the reduction of leaf number (KOZLOWSKI, 1948).
Thus, the waterlogging of sugarcane cultivated soil at the different lowering velocities occurred at 44, 210 and 300 DAPS did not interfere with the production of fresh and dry stalks, tip and total fresh and dry mass. These results are similar to those found by Tavares et al. (2017a) when they conducted similar studies with cane-plant.
Hasan et al. (2003) evaluated the growth and yield of sugarcane cultivars under soils flooding conditions and concluded that due to the genetic potentiality of some cultivars tested, they presented similar performance to normal cultivation in terms of quality, yield and growth. Tavares et al. [20] worked with sugarcane-plant and also found that the biomass, yield and quality of sugarcane plants in flooded soil was similar to normal cultivation conditions.
In relation to the number of tillers, the variation in the different treatments can be attributed to the vigor of the buds present in the shoot, and not by the influence of the stress caused by the excess water in the soil. Tavares (2018b), working with sugarcane, did not find differences between treatments for the number of tillers.
The period when the sugarcane ratoon was sprouting was the most affected; however, with this small difference, it cannot be said that the initial stage is the most sensitive to waterlogging; it should also be considered that in recent periods sugarcane was closer to maturity.
The reduction in mean °Brix values at 300 DAC can be explained by the plant's absorption of water and, consequently, dilution of soluble solids content due to excess water in the soil at the time of harvest and not because it is the plant sensitive or not to soil drenching at this stage of development. Paula (2008), working with the ratoon under similar experimental conditions, obtained a reduction in the accumulation of soluble solids in the juice when the flood occurred at the final stage of maturation, regardless of the depth of the water table and the duration of treatment. This same author, obtained no difference between the cane-plant and the first ratoon; however, the values were higher than 18.78 and 18.58 °Brix, respectively.
In relation to Pol, Tavares (2009) found lower values for sugar cane plant when the flood occurred at 305 DAP and for the 0.3 m lowering velocity in 12 days, observing Pol of 14.18%. One possible explanation for this difference is due to the duration of the ratoon cane flood. Between
treatment application (lysimeter flooding in P3 period) and harvesting, 17 days elapsed in ratoon, while 50 days elapsed in sugarcane plant.
It is evident, as soon as for ratoon sugarcane, the period of stress applied in sprouting was what most affected the quality of production; similar behavior was observed with respect to °Brix. Paula (2008) found differences in SRS between cane plant and ratoon. According to the author, in treatments where water availability was higher, the accumulation of SRS was reduced. For the sugarcane plant, Tavares (2009) obtained the lowest TRS value, also with treatment, P3V4 with 139.67 kg Mg-1 sugarcane and the highest TRS value with treatment P3V3, with 155.70 kg Mg-1 sugarcane-1.
5 CONCLUSIONS
The first ratoon of sugarcane was tolerant of waterlogging at both developmental stages and lower groundwater velocities, without growth and yield losses.
The total recoverable sugar content was reduced when the plants were flooded at the regrowth stage.
ACKNOWLEDGMENTS
To the Conselho Nacional de Desenvolvimento Científico e Tecnológico (CNPq) for granting scholarships to the authors.
REFERENCES
CALHEIROS, R. O.; CRUCIANI, D. E.; ARRUDA, F. B.; VOLTAN, R. B. Q.; SAKAI, E.; PIRES, R. C. M. Efeito do manejo do lençol freático na adaptação fisiomorfológica de duas espécies de trigo ao encharcamento. Engenharia Agrícola e Ambiental, v. 4, n. 2, p.194-202, 2000. http://dx.doi.org/10.1590/S1415-43662000000200011
CONAB. Acompanhamento da safra brasileira de cana-de-açúcar. Quarto levantamento, Brasília, v. 5, n. 4, p. 1-75, 2019.
CONSECANA. Conselho dos Produtores de Cana-de-Açúcar. Açúcar e Álcool do Estado de São Paulo, Piracicaba, Brazil, 2006. 112 p.
GALON, L.; TIRONI, S. P.; SILVA, A. F.; BEUTLER, A. N.; ROCHA, P. R. R.; FERREIRA, E. A.; SILVA, A. A. Disponibilidade de macronutrientes em cultivares de cana-de-açúcar submetidas à competição com Brachiaria brizantha. Ciência Rural, Santa Maria, v. 42, n. 8, p.1372-1379, 2012.
HASAN, M. F.; ALAM, M. R.; JABBER, M. A.; BEGUM, M. K.; MIAH, M.A.S. Effects of water-logging on juice quality and yield of sugarcane. Pakistan Journal of Biological Sciences, v. 6, n. 13, p. 1151-1155, 2003. http://dx.doi.org/10.3923/pjbs.2003.1151.1155
HERMANN, E. R.; CÂMARA, G. M. S. Um método simples para estimar a área foliar da cana-de-açúcar. STAB, Piracicaba, v. 17, n. 5, p. 32-34, 1999.
ISLAM, M.S.; MIAH, M.A.S.; BEGUM, M.K.; ALAM, M.R.; AREFIN, M.S. Growth, yield and juice quality of some selected sugarcane clones under water-logging stress condition. World Journal of Agricultural Sciences, v. 7, n. 4, p. 504-509, 2011.
KOZLOWSKI, T. T. Flooding and Plant Growth. Academic Press, Inc. 1984. New York. 168 p. LIMA, R. A. A produção de energias renováveis e o desenvolvimento sustentável: uma análise no cenário da mudança do clima. Revista Eletrônica Direito E-nergia, v. 5 n. 4, 2012.
JAIN, R.; SINGH, A.; SINGH, S.; SINGH, C. P.; SINGH, R. K.; SINGH, S. P.; SRIVASTAVA, V. K.; CHANDRA, A.; PATHAK, A. D.; SOLOMON, S. Variation in Juice Quality Traits of Sugarcane Genotypes under Waterlogged Condition in Subtropical India. Climate Change and Environmental Sustainability, v. 5, n. 1, p. 50-58, 2017.
MALIK, S. S.; TOMER, B. S. Sugarcane varietal performance under high water-logging conditions. Indian Sugar, v. 53, n. 8, p. 585-588, 2003.
MINGOTI, R., DUARTE, S. N., MIRANDA, J. H., & CRUCIANI, D. E. Dimensionamento econômico de profundidades e espaçamentos de drenos para a produção de cana-de-açúcar. Revista Brasileira de Engenharia Agrícola e Ambiental, Campina Grande, v. 10, n. 3, 535-540, 2006. https://doi.org/10.1590/S1415-43662006000300001.
PAULA, A. L. Desenvolvimento e produtividade da cana-de-açúcar em ambiente protegido sob
diferentes níveis freáticos. Piracicaba, 2008, 149p. Tese (Doutorado) – Escola Superior de
Agricultura “Luiz de Queiroz”, Universidade de São Paulo. Rome, 2002.
SCHILGAARDE, J. V. Nonsteady flow to drains In: SCHILFGAARDE, J. V. Drainage for
agriculture. Madison: American Society of Agronomy, 1974. p. 245-270.
TANJI, K. K.; KIELEN, N. C. Agricultural drainage water management in arid and semi-arid areas. Food and Agriculture Organization of the United Nations, Rome, Italy, 2002.
TAVARES, A. C. S. Sensibilidade da cana-de-açúcar ao excesso de água no solo. Piracicaba, 2009, 220p. Tese (Doutorado) - Escola Superior de Agricultura “Luiz de Queiroz”, Universidade de São Paulo.
TAVARES, A. C. S.; DUARTE, S. N.; MIRANDA, J. H.; DIAS, N. S.; SOUZA, K. T. S.; ARRAES, F. D. D. Velocidade de rebaixamento do nível freático na qualidade do caldo da cana-de-açúcar. Irriga, Botucatu, v. 20, n. 3, p. 458-472, 2015.
TAVARES, A. C. S.; DUARTE, S. N.; DIAS, N. S.; SÁ, F. V. S.; MIRANDA, J. H.; FERNANDES, C. S. Produção e maturação de cana-de-açúcar submetida a encharcamento em diferentes estádios de desenvolvimento. Irriga, Botucatu, v. 22, n. 1, p. 154-166, 2017a.
TAVARES, A. C. S.; DUARTE, S. N.; MIRANDA, J. H.; DIAS, N. S.; GOMES, J. W. S.; FERNANDES, C. S. Parâmetros hídrico, químico e climático em ambiente cultivado com cana-de-açúcar sob excesso de água no solo. Revista Brasileira de Agricultura Irrigada, v. 11, n. 3, p. 1438 - 1447, 2017b.
TAVARES, A. C. S.; DUARTE, S. N.; DIAS, N. S.; MIRANDA, J. H.; ARRAES, F. D. D.; SOUSA NETO, O. N.; FERNANDES, C. S Efeito da inundação do solo nos índices fisiológicos da cana-de-açúcar. Revista de Ciências Agrárias, Lisboa, v. 41, n. 1, p. 229-235 229, 2018a.
TAVARES, A. C. S.; DUARTE, S. N.; DIAS, N. S.; SÁ, F. V. S.; MIRANDA, J. H.; SOUZA, K. T. S.; PIZANI, M. A. M.; SOUSA NETO, O. N.; FERNANDES, C. S. Growth of Sugar Cane Under Cultivation Flooded at Different Speeds Lowering of the Water Table. Journal of Agricultural Science, v. 10, n. 10, p. 122-131, 2018b.
YIN, D.; CHEN, S.; CHEN, F.; GUAN, Z. & FANG, W. Morphological and physiological responses of two chrysanthemum cultivars differing in their tolerance to waterlogging. Environmental and Experimental Botany, v. 67, n. 1, p. 87-93, 2009. https://doi.org/10.1016/j.envexpbot.2009.06.006