ISSN: 1809-4430 (on-line) www.engenhariaagricola.org.br
2 Federal University of São Carlos/ Araras - SP, Brazil.
Received in: 5-23-2017
Doi:http://dx.doi.org/10.1590/1809-4430-Eng.Agric.v38n2p 217-224/2018
SOIL SOLUTION DISTRIBUTION IN SUBSURFACE DRIP IRRIGATION IN SUGARCANE
Claudinei F. Souza
1*, Douglas R. Bizari
21*Corresponding author. Federal University of São Carlos/Araras - SP, Brazil. E-mail: cfsouza@ufscar.br
KEYWORDS
Fertigation
,
flow rate,
wetted soil volume,
TDR.
ABSTRACT
Given the lack of studies on subsurface drip irrigation in sugarcane plantations, there has
been a growing demand for such information, mainly regarding soil solution profile and
availability to plants. Thus
, this study aimed to evaluate the effects of soil-water solution
distribution on qualitative and quantitative traits of sugarcane irrigated by subsurface drip
irrigation at two flows (1.6 and 3.5 L h
-1).
For each application rate, four PVC containers
(500 L) were used and filled with sandy soil, where a set of 36 TDR probes was installed.
Drippers were placed at a depth of 0.30 m. Irrigation was managed based on TDR daily
measurements, maintaining soil moisture within the root zone at field capacity. Sugarcane
variety used was RB 845210, being fertigated according to soil chemical analysis. The
results showed that the distribution of soil-water solution became stable at different depth
layers during applications, highlighting a relationship between soil solution storage and
wetted soil volume. Moreover, irrigation flow rates had no effect on the distribution of
water and nutrients throughout the soil profile, neither crop yield, technological quality nor
root density.
INTRODUCTION
Sugarcane is a semi-perennial grass (Saccharum officinarum L.) native to Asia. Currently, the top producers
are Brazil, India, Cuba, Mexico, and Ch ina. In Brazil, this crop has a major socioeconomic importance as it provides income, employ ment, and foreign exchange, main ly fro m ethanol and sugar production (Gilio & Moraes, 2016).
Brazil is the largest exporter and producer world wide, with almost 34 million tons produced and 25 million tons exported in 2015/2016 season (UNICA, 2017). It has occupied around 9 million Brazilian hectares, of which 52.3 % in São Paulo state — the largest producer. Surprisingly, the estimated average yield is still lo w — around 76,313 kg ha-1 (CONA B, 2016) — as this plant
genetic potential is for 300 t ha-1.
Nowadays, modern irrigated agricu lture has required more than just an increasing agricultural production. The use of rational techniques for the conservation of soil, water, and nutrients are imperative to the maintenance of these resources over time in sufficient quantities and quality and aiming at further satisfactory yield levels (Wutke et al., 2000) by means of a sustainable agriculture.
Given the aforementioned assumption, drip irrigation can be used to achieve high efficiency in the use of water and nutrients. In this technique, part of the water is applied to the soil at s mall volu mes but at a high frequency,
directly to the root zone, keeping soil mo isture at field capacity (Bizari et al., 2016).
A drip irrigation system may be classified according to where dripping lines are installed. In a surface drip irrigation, drippers are set on the soil surface, while in subsurface dripping; they are placed beneath the surface. As the name imp lies, in the latter, water is emitted below the ground surface with a moisture front tangent to it (depending on depth), what avoids wet surface exposure and reduces further losses by evaporation, thus ensuring a highly efficient water application (Martínez & Reca, 2014). The use of subsurface drip irrigation in sugarcane crops is a major evolution in production technology since it increases crop yield and longevity. Moreover, in addition to watering, irrigation systems have been also used to improve nutrient application in many parts of the world (Borges & Silva, 2002).
Fertigation has been a great alternative to the conventional application of nutrients to the soil because, insofar as fertilizers are d issolved in water they become readily available, being absorbed as soon as in contact with the root system of p lants (Santoro et al., 2013).
distribution, plant root-system activity and irrigation management (Colo mbo et al., 2013; Gonçalves et al., 2014).
The misunderstanding of the aforementioned factors may lead the misuse of drip irrigation, carrying chemical substances in solution to layers below root system, which, in addition to causing an economic loss, compro mises the water quality of underground aquifers .
Drip irrigation can be improved by knowing the dynamics of water and solutes in an unsaturated soil, as well as wet bulb positioning and shape throughout the soil profile. In this context, the objective of this study was to evaluate the effect of soil-water solution distribution on qualitative and quantitative traits of sugarcane irrigated by subsurface drip irrigation at two flow rates (1.6 and 3.5 L h-1).
MATERIAL AND MET HODS
The experiment was conducted in a greenhouse located in the Federal Un iversity of São Carlos (UFSCar), Araras city, São Paulo state (Brazil) (latitude 22° 18'53.23” S, longitude 47° 23'00.91” W, and elevation of 701 m), between December 2014 and July 2015. The local climate is classified as Cwa (sub-tropical) according to Köppen’s classification, with rainy summers and an average rainfall of 1300 mm. A g reenhouse measuring 5 m high, 6.4 m wide, and 20 m long and covered with a polyethylene film polyethylene was used to place the experimental units.
Eight 500-L PVC containers (0.65 m h igh and 1.20 m in diameter) with a drainage system in the bottom were distributed inside the greenhouse; these tanks were arranged to form two rows of four containers, on opposite sides, as shown in the diagram below (Figure 1).
FIGURE 1. Diagram of the irrigation assembly and distribution of soil containers inside the greenhouse. (Ri - reservoirs; Bi - hydraulic pu mps)
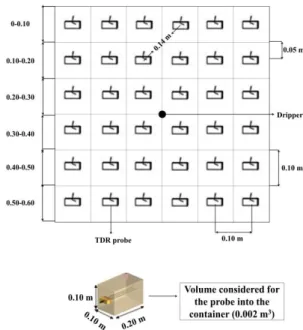
TDR probes were installed to a single central axis for soil water content () and electrical conductivity (EC) estimations. The probes were inserted horizontally through the sandy soil, forming a mesh of 36 probes per container, as can be seen in Figure 2.
FIGURE 2. Diagram of the TDR probe distribution and dripper placement inside soil containers.
Automatic subsurface drip irrigation was used to irrigate sugarcane plants. This system was div ided into two sectors (one for each flow), wh ich were controlled by solenoid valves. The same volume of water was irrigated in both treatments but alternately so that the containers V1i and V2i receive water at flow rates of 1.6 and 3.5 L h-1, respectively, as in Figure 1. For the irrigation of each container, only one dripper was installed at a depth of 0.30 m below ground surface (Dalri & Cruz, 2008).
The soil used in containers was a Quartzipsamment group collected from the surface layer (0 to 0.30 m) in the city of Leme, whose geographical coordinates are 22º11'08" S (latitude), 47º23'25" W (longitude) and 619 meters above sea level. Soil physical analysis was performed in undisturbed soil samples collected fro m the depth ranges of 0-0.15 and 0.15-0.30 m, with the aid of a volumetric ring. The analysis was performed in the Laboratory of Soil Physics, UFSCar, whose results are shown in Table 1.
TABLE 1.Soilphysical analysis of soil samp les fro m depth ranges of 0-0.15 and 0.15-0.30 m.
Sample Gr ain size (% )
Porosity (% )
Density (kg m-3)
Water content (m3 m-3) Depth range
(m) Clay Sand Silt Micro Macro Total Soil Particle Field capacity Wilting point
0.00-0.15 6 91 3 10.1 29.1 39.2 1660 2780 0.26 0.16
Sugarcane seedlings (Saccharum spp.) of the
variety RB 845210 were p repared in nurseries at CCA – UFSCar, being transplanted on December 06, 2014 to the containers in the greenhouse. Four seedlings were transplanted to each container, totaling 16 plants per treatment (flow rates) (Figure 3). The seedlings were planted at a depth of 0.25 m, 0.05 m above the dripper. Prior to transplantation, soil acid ity was corrected by liming according to previous analysis.
FIGURE 3. Seedlings transplanted to soil containers.
The monitoring of soil and EC was carried out using a TDR100 reflectometer (Campbell Scientific Inc.) along the channel plates multiplexing SDMX-50, wh ich analyzes the electromagnetic signal automatically by a data logger (CR1000-Campbell Scientific1). So il wet bulb formation and water and solute spatial distribution throughout the soil profile over time were evaluated by three readings at intervals of two weeks (repetitions) per container.
The equations described by Bizari et al. (2014) were used to estimate and EC, as follows:
(1)
where,
θ – water content (m3 m-3), and
Ka – apparent dielectric constant (non-dimensional).
(2) where,
ECPaste – electrical conductivity of saturated paste
(dS m-1), and
ECTDR– apparent electrical conductivity (dS m-1).
Irrigation was managed separately for each treatment based on TDR daily measurements, maintaining soil moisture within the root zone at field capacity (0.26 m3 m-3) and avoiding plant water stress. The TDR prov ides the soil apparent dielectric constant (Ka), wh ich is substituted in [eq. (1)]; the water depth was estimated by the average soil mo isture of each treatment (Equation 3).
(3)
where,
ID - irrigation depth (mm);
θFC – water content at field capacity (m3 m-3); θTDR – water content obtained (m3 m-3), and pef - effective depth of roots.
The amounts of nutrients to be applied by fertigation were estimated based on a soil chemical analysis performed at the Laboratory of Soil Fertility (CCA/UFSCar), fo llo wing the recommendations of the Technical Bulletin 100 (Raij et al., 1997). During the experiment, fertigation was split into six applications, made within 15-day intervals (Dalri & Cru z, 2008), using an injection pu mp installed outside the greenhouse.
The parameters evaluated in the soil profile, such as and EC, enabled the estimation of solution distribution for both tested flow rates.
After harvesting, sugarcane stalks were weighed. Then, a technological analysis was performed for 10 stalks per plot, through which the following variables were analyzed: ºBrix, pol broth, pol sugar, purity, and fiber, using the methods described by CONSECANA (2015). Both sugarcane yield and technological quality data were submitted to a variance analysis (ANOVA) and to Tukey’s test for the comparison of means.
Sugarcane roots were quantitatively evaluated by the auger-hole method (0.07 m in diameter), as described by Rodrigues et al. (2016), wh ich allo wed a greater number of repetitions without compromising the area. After sugarcane plants being harvested, the roots located at 0.05 m away fro m the planting rows were collected at depths of 0.20, 0.40, and 0.60 m, and at three points per depth, totaling six points sampled per container. Thereafter, these roots were placed in plastic bags and washed with water through a 0.1-mm mesh sieve. Afterward, they were left dry at room temperature, with impurities and organic matter removed by a forceps. After cleaned, these roots were placed in an oven at 65 °C for 48 hours, and thereafter, weighed to determine root density.
RES ULTS AND DISCUSS ION
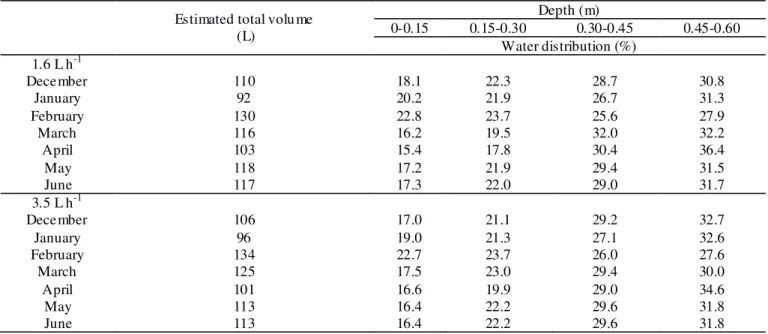
TABLE 2. Monthly evaluation of water volume distribution (L) along the soil profile, applied via subsurface drip at flow rates of 1.6 and 3.5 L h-1.
Estimated total volu me (L)
Depth (m)
0-0.15 0.15-0.30 0.30-0.45 0.45-0.60 Water distribution (%)
1.6 L h-1
December 110 18.1 22.3 28.7 30.8
January 92 20.2 21.9 26.7 31.3
February 130 22.8 23.7 25.6 27.9
March 116 16.2 19.5 32.0 32.2
April 103 15.4 17.8 30.4 36.4
May 118 17.2 21.9 29.4 31.5
June 117 17.3 22.0 29.0 31.7
3.5 L h-1
December 106 17.0 21.1 29.2 32.7
January 96 19.0 21.3 27.1 32.6
February 134 22.7 23.7 26.0 27.6
March 125 17.5 23.0 29.4 30.0
April 101 16.6 19.9 29.0 34.6
May 113 16.4 22.2 29.6 31.8
June 113 16.4 22.2 29.6 31.8
Water storage was not altered by the third layer of water (0.30-0.45 m), thus showing a relationship between wet bulb water storage and dripper depth. As the soil was sandy, the applied water percolated to a deeper layer.
When comparing both flow rates, the highest water storage was observed in the layer of 0.45-0.60 m (31.7 and 31.6 %, respectively); therefore, dripper position had no influence on the water distribution. For the other layers, the water storage in the second layer (0.15-0.30 m) was greater than that in the first layer (0-0.15 m) in both treatments, because of the rise of water in the soil p rofile. Accordingly, the dripper could be placed to a shallow
depth between 0.20 and 0.25 m in sandy soils. By evaluating the effect of different dripper depths on water storage in an Oxisol profile using subsurface drip irrigation, Santos et al. (2016) concluded that a 0.2 m drip depth was the most appropriate for an efficient water use when using treated sewage effluent. According to these authors, when drippers were installed at a 0.2 m depth, water content was mostly concentrated at a depth of 0.8 m.
For the same authors, drippers placed at a 0.4 m depth may
Figure 4 displays spatial and temporal co mparisons of the distribution of water irrigated at different flow rates. Both tested flow rates showed a similar trend in terms of water distribution between 0.0 and 0.15 m depth. However, in the other layers, this behavior was different, among which, the layer of 0.15-0.30 m stood out as the only layer whose flow rate of 1.6 L h-1 did not exceed the water distribution recorded by the flow of 3.5 L h-1 (exceeded 2.4% volu me of stored water). This observation can be exp lained through the relationship between dripper position (0.30 m) and flow increase during water infiltration. In this process, an increasing volume of saturated soil is necessary to adjust the movement of water through soil pores around the dripper; hence, there will be a higher water distribution within this layer than in areas
not wet by a smaller flow rate. Sou za & Folegatti (2010) describes a similar finding in studies of wet bulb formation in surface drip irrigation; they reported a larger wet soil volume by increasing dripper flow rate.
On average, the largest solution storage (32.5 %) was observed in the layer of 0.45-0.60 m when irrigation was done at 1.6 L h-1. Also, the use of a flow rate of 3.5 L
h-1 presented the same tendency of increase in solution
stored in the same layer (0.45-0.60 m), with an average value of 29.3 %. These results show the lack of difference between the tested drippers in terms of soil solution distribution; however, the dripper position (0.30 m fro m soil surface) influenced solution distribution and hence soil solution storage.
TABLE 3. Distribution of solution concentration throughout the soil profile fo r subsurface drip irrigation at flow rates of 1.6 and 3.5 L h-1.
Estimated solution concentration (dS m-1)
Depth (m)
0-0.15 0.15-0.30 0.30-0.45 0.45-0.60 Solution Distribution (%)
1.6 L h-1
December 0.959 21.5 22.4 27.4 28.6
January 0.326 20.7 21.2 26.5 31.6
February 1.241 18.7 21.1 27.3 32.9
March 1.204 14.7 16.6 35.3 33.5
April 1.271 14.5 17.0 31.9 36.7
May 1.327 19.5 23.5 26.5 30.6
June 0.356 21.8 17.3 27.6 33.5
3.5 L h-1
December 0.949 19.3 23.5 27.8 29.4
January 0.364 17.9 22.0 28.1 32.0
February 1.507 23.9 24.7 25.6 25.8
March 1.216 16.9 23.9 29.5 29.7
April 1.341 14.8 21.6 30.1 33.6
May 1.269 16.6 24.9 31.0 27.5
June 0.352 17.1 25.0 30.7 27.3
The distribution of irrigation solution in different layers became stable throughout the application for each flow rate; thus, we can infer that there is a relation between solution distribution and storage inside the wet bulb, where storage was greater in the deepest layers .
In the first layer, the amount of solution stored was similar fo r the different flow rates; however, in the second layer (0.15-0.30 m), the highest storage was observed for a rate of 3.5 L h-1.
A gradient soil solution distribution was observed with a greater concentration at deeper layers, Therefore, this gradient decreases as the wetting front approaches; however, it is still possible to find nutrients in the topmost layer. This might have occurred because of a mass flow distribution within the wet bulb under active gravitational effect (Souza & Fo legatti, 2010).
Through Figure 5 we can observe that there was no similarity between the applied flo w rates for the nutrient distribution in the soil. Yet, a h igher nutrient distribution was observed only in the layer 0.15 to 0.30 m when using a flow rate of 3.5 L h-1, corroborating the water distribution results. These results show that the distribution of nutrients is closely related to the flow rates of drippers. This behavior is also observed for a total soil profile analysis, for which regression had an R2 = 0.64 when comparing both flow rates. The flow rate of 1.6 L h-1 exceeded on average 2.3 % the distribution of fertigated nutrients if compared to that of 3.5 L h-1. Grecco et al.
(2016) also reported larger dimensions in wet bulb formation by irrigating at a flow rate 1.0 L h-1, when
compared to 1.6 L h-1 in simu lations using Hydrus 2D
FIGURE 5. Co mparative analysis of both tested flow rates (1.6 and 3.5 L h-1) according to the distribution of fertigation
solution in the soil profile.
Table 4 shows the averages of sugarcane yield obtained for each treatment. No statistical difference was observed between both flow rates (1.6 and 3.5 L h-1), reaching values of 16.2 and 18.9 kg m-2, what correspond to nearly 162.5 and 188.6 t ha-1.
Interestingly, these yield values are higher than the average for sugarcane production in the state of São Paulo, which is of around 86.0 t ha-1 (CONSECANA, 2015). Silva et al. (2014) evaluated stalk yield (TCH; tons of cane per hectare) for different sugarcane varieties "RB and SP" under drip irrigation in the state of São Paulo and found an average of 123 t ha-1.
Additionally, Gava et al. (2011) evaluated three sugarcane genotypes (RB 867515, RB 855536 and SP 803280) under subsurface irrigation and found a TCH of 132.2 t ha-1 for plants in first cultivation cycle and of 126.2 t ha-1 for those in the second cycle. Assessing sugarcane
grown in the state of São Paulo, Dias et al. (1999) observed yields varying from 84.8 to 171.2 t ha-1, which shows that this variable has different behavior depending on physical and hydraulic characteristics of each soil. Besides that, sugarcane yield may vary with plant variety, tillage system, irrigation management, water depth, or even the occurrence of pest and disease outbreaks, among others.
TABLE 4. Co mparison of sugarcane average yield (kg container-1) using the Tukey’s test (5 %) for both treatments (1.6 and 3.5 L h-1).
Treatment Average Yield
1.6 L h-1 16.24a
3.5 L h-1 18.86a
Note: The same letters indicate that means are not significantly different by the Tukey’s test at 5% probability, i.e. there is no difference between them.
Table 5 shows the results of the technological quality analysis of sugarcane. No statistical difference was found between the flow rates of 1.6 and 3.5 L h-1, which
corroborates the results observed for sugarcane yield.
TABLE 5.Comparison of technological quality variables using the Tukey’s test (5 %) for both treatments (1.6 and 3.5 L h-1).
o Brix broth Pol sugarcane Pol Purity sugarcane Fiber
%
1.6 L h-1 21.03a 18.10a 15.47a 86.05a 11.43a
3.5 L h-1 20.50a 17.80a 15.17a 86.82a 11.64a
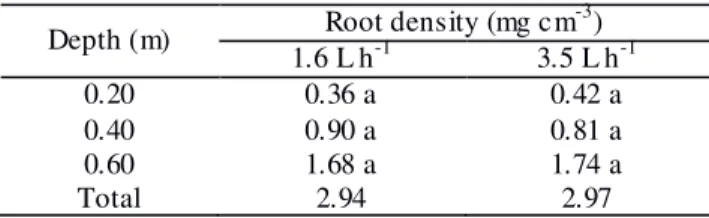
TABLE 6. Root density for sugarcane irrigated by subsurface drip irrigation at two d ifferent flow rates .
Depth (m) Root density (mg cm
-3)
1.6 L h-1 3.5 L h-1
0.20 0.36 a 0.42 a
0.40 0.90 a 0.81 a
0.60 1.68 a 1.74 a
Total 2.94 2.97
CONCLUS IONS
In this study, no differences were found regarding the distribution of water and nutrients throughout the soil profile under sugarcane irrigated by subsurface dripping at flow rates of 1.6 and 3.5 L h-1,and neither were found significant statistical differences for sugarcane yield, technological quality, nor root density.
ACKNOWLEDGMENTS
The São Paulo Research Foundation – FAPESP (2012/09481-9 and 2012/21151-4) and National Council for Scientific and Technological Development – CNPq for financial support.
REFERENCES
Bizari DR, Grecco KL, Oliveira PL, Querido DCM, Souza CF (2014) Soil solution distribution under subsurface drip fertigation determined using TDR technique. Revista Brasileira de Agricultura Irrigada 8(2):139-146. DOI: http://dx.doi.org/10.7127/rbai.v8n200222
Bizari DR, Grecco KL, Souza CF (2016) Bulbo mo lhado estimado pela técnica da TDR na irrigação por
gotejamento subsuperficial. Revista Brasileira de Agricultura Irrigada 10(2):477-485. DOI: http://dx.doi.org/10.7127/rbai.v10n200352 Borges AL, Silva DJ (2002) Fertilizantes para
Fertirrigação. In: Borges AL, Coelho EF, Trindade AV (eds). Fertirrigação em fruteiras tropicais. Cru z das Almas: Emb rapa Mandioca e Fruticu ltura/Emb rapa, p15-27. Colo mbo A, A lvarenga LA, Scalco MS, Ribeiro RC, Abreu GF (2013) Water storage in wetted strips under irrigated coffee trees with different criteria of irrigation management. Engenharia Agríco la 33(2):249-257, 2013. DOI: https://dx.do
i.org/10.1590/S0100-69162013000200004
CONA B – Co mpanhia Nacional de Abastecimento (2016) Segundo levantamento da safra. Acompanhamento da safra brasileira - cana-de-açúcar 2016. CONAB Available: http://www.conab.gov.br/OlalaCMS/uploads/arquivos/16_ 08_ 18_ 12_ 03_ 30_boletim_cana_portugues_-_2o_lev_-_16-17.pdf> Accessed: Aug 26, 2016.
CONSECANA - Conselho dos Produtores de Cana-de-Açúcar, Açúcar e Álcool do Estado de São Paulo (2015) Manual de instruções. CONSECA NA, 80p.
Dalri AB, Cru z RL (2008) Produtividade da cana-de-açúcar fertirrigada com N e K via gotejamento
subsuperficial. Rev ista de Engenharia Agríco la 28(3):516-524. DOI: http://d
x.doi.org/10.1590/S0100-69162008000300012
Dias FLF, Mazza JA, Matsuoka S, Perecin D, Mau le RF (1999) Produtividade da cana-de-açúcar em relação a clima e solos da região noroeste do estado de São Paulo. Revista Brasileira de Ciência do Solo 23(3):627-634. DOI: http://dx.doi.org/10.1590/S0100-06831999000300016
Gava GJC, Silva MA, Silva RC, Jerônimo EM, Cru z JCS, Kölln OT (2011) Produtividade de três cultivares de cana-de-açúcar sob manejos de sequeiro e irrigado por
gotejamento. Revista Brasileira de Engenharia Agrícola e Ambiental 15(3):250-255. DOI:
http://dx.doi.org/10.1590/S1415-43662011000300005
Gilio L, Moraes MAFD (2016) Sugarcane industry's socioeconomic impact in São Pau lo, Brazil: A spatial dynamic panel approach. Energy Economics 58:27–37. DOI: https://doi.org/10.1016/j.eneco.2016.06.005
Gonçalves ACA, Alves DS, Marques PAA, Folegatti MV, José JV (2014). Distribution of water in sandy soil applied by drip. Engenharia Agríco la 34(6):1175-1185. DOI: https://dx.doi.org/10.1590/S0100-69162014000600013
Grecco KL, Bizari DR, Souza CF (2016) Avaliação do modelo Hydrus-2D na distribuição do soluto no gotejamento subsuperficial. Irriga 1(1):113-125. DOI: http://dx.doi.org/10.15809/irriga.2016v1n 01p 113-125
Martínez J, Reca J (2014) Water Use efficiency of surface drip irrigation versus an alternative subsurface drip irrigation method. Journal Irrigation Drainage Engineering 140(10). DOI: https://doi.org/10.1061/(ASCE)IR.1943-4774.0000745
Raij BV, Cantarella H, Quaggio JA, Fu rlan i AMC (1997) Reco mendações de adubação e calagem para o Estado de São Paulo. Camp inas, Instituto Agronômico/Fundação IAC, 2 ed. 285p.
Rodrigues MOD, Santos AC, Santos PM, Sousa JTL, Alexandrino E, Santos JGD (2016) Mo mbasa grass characterisation at different heights of grazing in intercropping system with Babassu and monoculture. Semina: Ciências Agrárias 37(4):2085-2098. DOI: http://dx.doi.org/10.5433/1679-0359.2016v 37n 4p2085
Santoro BL, Sato LM, Brunhara JPB, Peres JG, Souza CF (2013) Monitoramento da distribuição de uma solução no solo via fertirrigação por gotejamento. Irriga 18(3):572-586. DOI:
http://dx.doi.org/10.15809/irriga.2013v18n3p 572
Santos LC, Leal DPV, José JV, Coelho RD, Barros THS (2016) Aplicação do modelo CSM-CANEGRO em estudo de viabilidade econômica da cana-de-açúcar irrigada por pivô central. Irriga 1(1):13-22. DOI:
Silva MA, Arantes MT, Rhein AFL, Gava GJC, Kölln OT (2014) Potencial produtivo da cana-de-açúcar sob irrigação por gotejamento em função de variedades e ciclos. Revista Brasileira de Engenharia Agrícola e Ambiental 18(3):241-249. DOI:
http://dx.doi.org/10.1590/S1415-43662014000300001 Souza CF, Fo legatti MV (2010) Spatial and temporal characterization of water and solute distribution patterns. Scientia Agricola 67(1):09-15. DOI:
http://dx.doi.org/10.1590/S0103-90162010000100002
UNICA - União da Indústria de Cana-de-Açúcar (2017) Principais números e crise do setor. Available:
http://www.unica.co m.br/download.php?idSecao=17&id = 35831777. Accessed apr 07, 2017.
Wutke EB, Arruda FB, Fancelli A L, Pereira JCVNA, Sakai E, Fusiwara M, A mbrosano GMB (2000) Propriedades do solo e sistema rad icular do feijoeiro irrigado em rotação de culturas. Revista Brasileira de Ciência do So lo 24(3):621-633. DOI: