Diogo Gonçalo Rolo Teixeira
Licenciado em Ciências da Engenharia Electrotécnica e de Computadores
Intelligent Management of Energy
Storage Systems in Buildings
Dissertação para obtenção do Grau de Mestre em
Engenharia Electrotécnica e de Computadores
Orientador: Professor Doutor Rui Neves-Silva,
Professor Auxiliar, Faculdade de Ciências e Tecnologia
da Universidade Nova de Lisboa
Júri:
Presidente: Prof. Doutor Luís Filipe Figueira de Brito Palma – FCT/UNL
Arguentes: Prof.ª Doutora Anabela Monteiro Gonçalves Pinto – FCT/UNL
Vogais: Prof. Doutor Rui Alexandre Nunes Neves da Silva – FCT/UNL
Intelligent Management of Energy Storage Systems in Buildings
Copyright © Diogo Gonçalo Rolo Teixeira, Faculdade de Ciências e Tecnologia da Universi-dade Nova de Lisboa.
“Give me a lever long enough and a fulcrum on which to place it, and I shall move the world”
vii
Acknowledgements
I would like to register here my most sincere gratitude to everyone, which in one way or another contributed to my success in performing this task.
Primarily, I am very thankful to my supervisor, Professor Doutor Rui Neves-Silva, who passed on his expertise to me, facilitating the understanding, development and implementation of this project. He exhibited his enthusiasm in diverse ways, helping me succeed in this challenge.
Appreciation is due, as well, to my research room colleagues, who gave me numerous advice regarding this dissertation.
To Marco, to Grilo, to Raka, to Bolos, to Dionísio, to Bravo, to Johny and to all the remaining friends I gained throughout this six-year journey in Faculdade de Ciências e Tecnologia, thank you very much. For your friendship, your patience and all the support that made this quest easier to accomplish.
I am indebted to Caeiro, Carlos, Quintino, Rochinha, Canêlhas and Catarina for the company, friendship, and time well spent together that carried me since day one to fulfil this dream. Especially to Gouveia, for the epic Italian adventure and the patience for the past 20 years and David, for the constant presence and capacity to make me focus on the important things.
Most importantly, to my Family. Mother, Father and Tiago, thank you for teaching me the val-ues that enabled me to be the Man I am today. All your support, patience and guidance are the main reasons that permitted this achievement.
ix
Abstract
The usage of electricity, nowadays, suffers from large fluctuations and is inefficient, creating load management issues and a considerable carbon footprint. Within this subject, buildings are one of the main culprits, due to the high percentage of time that people spend within them. In addition, elec-tricity plays a determinant role for the comfort within buildings, creating an intrinsic need for it.
Therefore, due to the occupant’s behavioural patterns, inefficiencies occur between electricity’s supply and demand. Consequently, to reach ambitious energy efficiency goals, the building sector must undergo through technological innovation enabling a better energy management.
Energy management is nowadays a subject of great importance and complexity, by choosing amongst a set of sources and loads that could minimize the losses and costs. Energy management sys-tems, coupled with energy storage syssys-tems, can optimize the electricity usage, making it more efficient.
Accordingly, the goal of this dissertation is to present a system able to, intelligently, manage energy storage systems, user consumptions within buildings and power sources through strictly defined strategies. This system bases itself on a decision system that, while maintaining the security, stability and quality of service of the power network, can enhance how buildings consume electricity, optimizing it and lowering the load management problems.
To conclude, this dissertation aims to develop computer software, a simulator, in order to test this system’s viability and if the results globally optimize the electricity usage.
xi
Resumo
Atualmente, o uso de eletricidade sofre de grandes flutuações e é ineficiente, criando problemas de gestão da carga e um considerável peso para o ambiente devido ao carbono libertado na produção. Os edifícios são um dos principais culpados, uma vez que constituem o local onde a maioria das pessoas despende grande parte do seu tempo. Além disso, a eletricidade desempenha um papel determinante para o conforto no interior dos edifícios, criando uma necessidade intrínseca para tal.
Por conseguinte, devido aos padrões de comportamento das pessoas dentro de edifícios, ocor-rem algumas ineficiências entre a oferta e a procura da eletricidade. Assim, para alcançar metas de eficiência energética ambiciosas, os edifícios devem ser sujeitos á inovação tecnológica, que permitirá uma melhor gestão de energia.
A gestão de energia, nos dias de hoje, é um assunto de grande importância e complexidade, pois escolhe de entre um conjunto de fontes e cargas que poderiam minimizar as perdas e os custos. Sistemas de gestão de energia juntamente com os sistemas de armazenamento de energia podem otimizar a utili-zação de eletricidade, tornando-a mais eficiente.
Deste modo, o objetivo desta dissertação é apresentar um sistema capaz de gerir de forma inte-ligente sistemas de armazenamento de energia, padrões de consumo dentro de prédios e fontes de ener-gia através de estratéener-gias bem definidas. Este sistema tem por base um sistema de decisão que, embora mantendo a segurança, a estabilidade e a qualidade do serviço da rede de alimentação, pode otimizar o consumo de eletricidade dentro dos edifícios e melhorar a gestão da carga elétrica.
Para concluir, esta dissertação visa desenvolver um software de computador, um simulador, a fim de testar a viabilidade deste sistema e se os resultados globalmente otimizam a utilização de eletri-cidade.
xiii
Table of Contents
ABBREVIATIONS LIST ... XVII
FIGURE LIST ... XIX
TABLE LIST ... XXIII
1. INTRODUCTION ... 1
1.1 Context ... 1
1.2 Motivation ... 1
1.3 Objective ... 2
1.4 Original Contributions ... 2
1.5 Outline ... 2
2. ELECTRICITY: THE INDISPENSABLE GOOD ... 5
2.1 Electricity’s share in energy versus environment ... 5
2.2 Renewable energy sources: solution or problem? ... 6
2.3 Electricity: consumption patterns ... 7
2.3.1 Portugal... 8
2.3.2 USA ... 9
2.4 Buildings: electricity utilization and consequences ... 10
2.4.1 Utilization ... 10
2.4.2 Contract conditions ... 10
2.4.2.1 Portugal ... 10
2.4.2.2 USA ... 12
2.4.3 Load management ... 13
3. ENERGY STORAGE SYSTEMS ... 15
3.1 Overview ... 15
3.2 Characteristics ... 17
3.3 Comparison between ESS technologies: Which are better suited for this project? ... 19
3.3.1 Size ... 19
3.3.2 Maturity ... 19
3.3.3 Environmental Impact ... 20
3.3.4 Performance characteristics ... 20
xiv
3.3.6 Summarize and conclusions ... 23
4. PREVIOUS WORK AND PROPOSED APPROACH ... 25
4.1 Previous work ... 25
4.2 Proposed Approach ... 26
4.2.1 Components ... 26
4.2.2 Algorithm ... 27
4.2.2.1 Specifications... 27
4.2.2.2 Justification ... 29
4.2.3 Simulator ... 30
4.2.4 System’s modus operandi ... 31
4.3 Relation between previous work and the proposed approach ... 31
5 IMPLEMENTATION ... 33
5.1 Simulator Components ... 33
5.1.1 Graphical User Interfaces ... 34
5.1.1.1 Plant Simulator’s GUI ... 34
5.1.1.2 Decision system’s GUI ... 39
5.1.2 Sources ... 41
5.1.3 User consumption patterns ... 43
5.1.4 Energy storage systems ... 45
5.2 Simulator’s Management System ... 48
5.2.1 Charging method ... 48
5.2.2 Discharging method ... 52
5.2.2.1 Peak shaving strategy ... 53
5.2.2.2 Maximize profit strategy ... 55
5.3 System’s modus operandi... 57
6 VALIDATION ... 59
6.1 Maximize Profit Simulations ... 59
6.1.1 First Simulation – one energy price per day and three ESSs for one day ... 60
6.1.2 Second Simulation – two energy prices per day and two ESSs for one day ... 62
6.1.3 Third Simulation – three energy prices per day and three ESSs for three days.... 65
6.1.4 Fourth Simulation – three energy prices per day and three ESSs for seven days . 67 6.2 Peak Shaving Simulations ... 69
6.2.1 First Simulation – one energy price per day and one ESS for one day ... 70
xv
6.2.3 Third Simulation – three energy prices per day and two ESSs for three days... 73
6.2.4 Fourth Simulation – three energy prices per day and two ESSs for seven days ... 75
6.3 Summary and conclusions ... 78
7 CONCLUSIONS AND FUTURE WORK ... 79
7.1 Conclusions ... 79
7.2 Future work ... 80
REFERENCES ... 81
APPENDIX I ... 85
xvii
Abbreviations List
Abbreviation
Meaning
AC Alternate current
AGM Absorbed glass mat
BOP Balance of plant
DC Direct current
EDP Energias de Portugal
ESS Energy storage system
EU European Union
GHG Greenhouse gas
GUI Graphical user interface
KPI Key performance indicator
LCoS Levelised cost of storage
PCS Power conversion system
QoS Quality of service
REN Redes energéticas nacionais SIC Specific investment cost
SOC State of charge
USA United States of America
VAT Value-added tax
xix
Figure List
Figure 2.1 – Lifecycle greenhouse gas emissions intensity by energy generation method. The error bars relate to the range between different studies. Adapted from (World Nuclear Association,
2011). ... 6
Figure 2.2 –Energias de Portugal (EDP) total installed capacity in MW of different types of renewable energy resources between 2005 and 2013 in Belgium, Brazil, France, Portugal, Spain and USA. This chart includes both special and conventional regimes. Adapted from (Energias de Portugal (EDP), 2014). ... 7
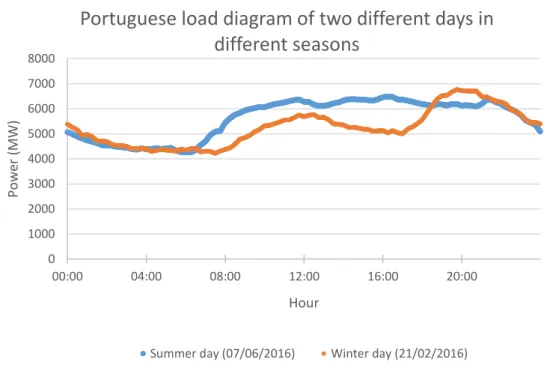
Figure 2.3 – Load diagram of two different days in different seasons. Consumption of the entire country. Adapted from (Redes Energéticas Nacionais, 2016). ... 8
Figure 2.4 – Electricity consumption by sector in Portugal, in 2013. Adapted from (Direção-Geral de Energia e Geologia, 2013). ... 9
Figure 2.5 – Example of a load diagram in New England, USA on a autumn’s day (U.S. Energy Information Administration, 2011a). ... 9
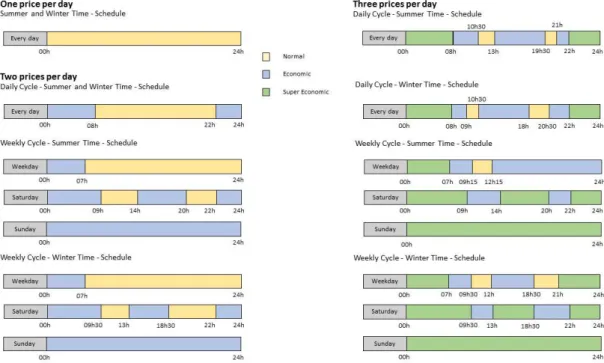
Figure 2.6 - Difference between types of schedules and the respective types of price in a specific energy provider (EDP Comercial). Adapted from (EDP Comercial, 2016). ... 12
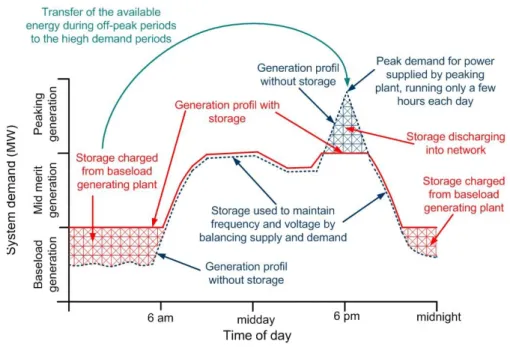
Figure 2.7 – Effects of energy storage on the electricity system demand (Ibrahim & Ilinca, 2013). .... 13
Figure 3.1 – Benefits of energy storage systems (Ibrahim & Ilinca, 2013)... 16
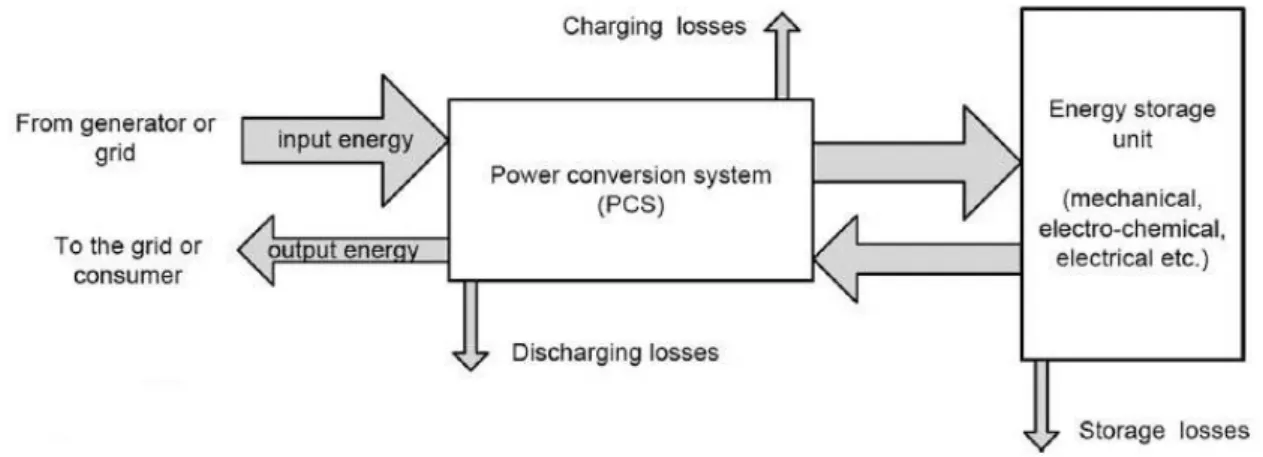
Figure 3.2 – Schematic of a possible composition of a ESS (Zakeri & Syri, 2015). This figure does not include the BOP. ... 16
Figure 3.3 – Maturity curve of different ESS technologies (SBC Energy Institute, 2013). ... 20
Figure 4.1 – Components of the system and its run-time perspective. ... 27
Figure 4.2 – Characteristics of the algorithm. ... 28
Figure 4.3 – Simulation platform operational method. ... 31
Figure 4.4 – Workflow diagram of the designed architecture. ... 32
Figure 5.1 – Logo created for the simulator. ... 34
Figure 5.2 –“Begin” subdivision of the simulator. This window shows up when starting the simulator. ... 34
xx
Figure 5.4 – Example of an object’s removal. ... 36
Figure 5.5 –Display of the “Add ESS” subdivision from the plant simulator. ... 36
Figure 5.6 –“Begin” subdivision of the simulator. It shows different text because of the ESSs, sources and user patterns insertion. ... 37
Figure 5.7 –Example of the plant simulator’s “Send To Decision System” tab divided by areas. ... 38
Figure 5.8 –“Help” tab of the plant simulator’s GUI. ... 39
Figure 5.9 –Layout of the “Strategy & Results” tab in the decision system interface. ... 40
Figure 5.10 –Design of the “Help” tab in the decision system module. ... 41
Figure 5.11 –Source insertion area of the “Configuration” tab of plant simulator’s GUI. ... 42
Figure 5.12 – Area that displays and enables the creation of a user consumption pattern. It includes the pop up that enquires for the monthly consumption. ... 44
Figure 5.13 – Workflow that demonstrates when to charge. ... 50
Figure 5.14 – Method of choice between ESSs for charging purposes. This applies to both charging periods. ... 51
Figure 5.15 – Workflow of the peak shaving strategy implemented. ... 54
Figure 5.16 – Workflow of the maximize profit strategy implemented. ... 56
Figure 5.17 – Workflow of the system’s process for a complete simulation. ... 58
Figure 6.1 – Graphical results of a maximize profit simulation with only one price per day, three ESSs and a contracted power of 10.35kVA. This relates to a building with nine houses during the summer, simulated throughout one day. ... 60
Figure 6.2 – Price results of a maximize profit simulation with only one price per day, three ESSs and a contracted power of 10.35kVA. This relates to a building with nine houses during the summer, simulated throughout one day. ... 62
Figure 6.3 – Graphical results of a maximize profit simulation with two prices per day, three ESSs and a contracted power of 13.8kVA. This relates to a building with twelve houses during the winter, throughout one day. ... 63
xxi
Figure 6.5 – Graphical results of a maximize profit simulation with three prices per day, two ESSs and a contracted power of 17.25kVA. This relates to a building with fifteen houses during the summer, throughout three days. ... 66 Figure 6.6 – Price results of a maximize profit simulation with three prices per day, two ESSs and a
contracted power of 17.25kVA. This relates to a building with fifteen houses during the summer, throughout three days. ... 67 Figure 6.7 – Graphical results of a maximize profit simulation with three prices per day, three ESSs
and a contracted power of 27.6kVA. This relates to a building with nine houses during the winter, throughout seven days. ... 68 Figure 6.8 – Price results of a maximize profit simulation with three prices per day, three ESSs and a
contracted power of 27.6kVA. This relates to a building with nine houses during the winter, throughout seven days. ... 69 Figure 6.9 – Graphical results of a peak shaving simulation with only one price per day, one ESS and a
contracted power of 13.8kVA. This relates to a building with twelve houses during the winter, simulated throughout one day. ... 70 Figure 6.10 – Price results of a peak shaving simulation with only one price per day, one ESS and a
contracted power of 13.8kVA. This relates to a building with twelve houses during the winter, simulated throughout one day. ... 71 Figure 6.11 – Graphical results of a peak shaving simulation with two prices per day, three ESSs and a
contracted power of 17.25kVA. This relates to a building with nine houses during the summer, simulated throughout one day. ... 72 Figure 6.12 – Price results of a peak shaving simulation with two price per day, three ESSs and a
contracted power of 17.25kVA. This relates to a building with nine houses during the summer, simulated throughout one day. ... 73 Figure 6.13 – Graphical results of a peak shaving simulation with three prices per day, two ESSs and a
contracted power of 20.7kVA. This relates to a building with fifteen houses during the winter, simulated throughout three days. ... 74 Figure 6.14 – Price results of a peak shaving simulation with three prices per day, two ESSs and a
contracted power of 20.7kVA. This relates to a building with fifteen houses during the winter, simulated throughout three days. ... 75 Figure 6.15 – Graphical results of a peak shaving simulation with three prices per day, two ESSs and a
xxii
xxiii
Table List
Table 3.1 – Explanation of calculation of LCoS variables (World Energy Council, 2016). ... 18 Table 3.2 – Performance characteristics of different ESSs for short-term storage. Adapted from
(Badwal, Giddey, Munnings, Bhatt, & Hollenkamp, 2014; H. Chen et al., 2009; Hadjipaschalis, Poullikkas, & Efthimiou, 2009; World Energy Council, 2016; Zakeri & Syri, 2015). ... 21 Table 3.3 – Investment and operational costs differences between ESSs technologies in 2015 and its
expected evolution until 2030. Adapted from (World Energy Council, 2016). ... 22 Table 3.4 – Levelised cost of storage between ESSs technologies in 2015 and its expected evolution
1
1.
Introduction
In the following subchapters, the author displays a brief contextualization of the problem that lead to the creation of this dissertation. In addition, the author presents below the motivation, the pro-posed objectives and a simple explanation of each chapter.
1.1 Context
Electricity consumption worldwide is currently an important topic, due to not only the amount, but also the variations within the day. These factors generate inefficiencies in supply and demand of electricity. Buildings, an important part in people’s lives, have a significant share in both amount and fluctuations, in behalf of the occupants’ behavioural patterns. Energy storage systems (ESSs) are key technologies to counter this problem by enabling efficient load management. These systems combined with a predictive model of the building occupants’ behaviour can improve the load management and optimize the end-user consumption. However, this improvement is only achievable through the creation of strategies that follow a well-defined set of rules.
1.2 Motivation
Energy affects us all. It is a major concern thanks to the greenhouse gas (GHG) emissions impact on the environment and on the dependency of fossil fuels (limited resource) to create energy, a good that most people take for granted. Electricity also participate heavily on human comfort, which enforces a need to optimize its supply-demand balance.
The building sector is an important target to optimize, due to its importance in people’s lives. If we take into account work offices, residences and commercial buildings, people generally spend 90% or more of their time indoors (EPA’s Green Building Workgroup, 2009). By spending so much time within buildings, these consume electricity actively. This happens to maximize our comfort, creating an intrinsic need for energy. Light, power or mobility are a few examples of electricity’s share on human comfort.
2
The author of this thesis desires to develop a system that has a positive impact on people’s lives, through enhancing efficiency between energy suppliers and consumers.
1.3 Objective
In this thesis, the proposed methodology is to manage different energy storage systems within buildings. This procedure means to improve the load management, optimize electricity consumption and minimize the costs without decreasing quality of service (QoS). To fulfil these objectives, this pro-ject requires distinctive components: a set of ESSs, a building with access to the power grid, predictive model of human behaviour within buildings and algorithms to resolve the interoperability between these components.
Each energy storage system (ESS) connects with the grid through the building’s energy supply, whether it comes from the power grid or local renewable resources. These are capable of energy storage and release whenever required. The above-mentioned have specific operational constraints that differ between individual units such as efficiency, capacity and charging times.
The human behaviour model has its foundation on statistical electricity consumptions (patterns), gathered from trustworthy sources (e.g. REN, Portuguese company that manages the national electrical system), and on-going energy consumption verification.
The algorithms controls the ESSs operational methods (charge and discharge periods) depend-ing on their individual attributes, through implemented strategies. In addition, it decides when to use energy from ESSs or the grid based on the supplied energy characteristics and prices, without the end-user realising any changes (maintain the QoS). In summary, routing, treating and managing all the com-munications between each component is the algorithm’s main purpose, ensuring QoS and minimal cost.
Therefore, to create this, there has to be a decision system with specific strategies that can im-plement this idea.
To test this decision system, a simulation platform is developed in Java programming language to demonstrate the results of the implementation in different situations.
1.4 Original Contributions
Although chapters 2 and 3 details the information that enabled its creation, the author developed a simulator exclusively for this thesis. This simulator enables the usage of the components required for the objectives by implementing the proposed system. It contains the management system that facilitates the usage of different strategies to obtain results.
1.5 Outline
3
Chapter 1– Introduction.
It contains the contextualization of the topic of this dissertation, referring the problems that lead to the creation of this system, the motivation behind it and the orig-inal contributions that this project implements.
Chapter 2– Electricity: the indispensable good.
This chapter addresses the importance of electricity on human life, its genera-tion, consumpgenera-tion, prices and consequences of its use.
Chapter 3– Energy storage systems.
An introduction of energy storage systems’ definition, their composition and characteristics. Contains a comparison between storage technologies to achieve the best-suited devices for this project.
Chapter 4– Previous work and proposed approach.
It has a brief description of some projects and designs created within the area of subject and details the architecture and method of operation of the system to imple-ment.
Chapter 5– Implementation.
An explanation of the components, methodologies and processes that the author implemented for this thesis.
Chapter 6– Validation.
Contains the demonstration and interpretation of the system’s results. Displays multiple simulations for diverse situations.
Chapter 7– Conclusions and future work.
5
2.
Electricity: the indispensable good
This chapter emphasizes on the importance of electricity as a consumer item and its impact on human life. It details its generation, consumption, prices and consequences of its use.
2.1 Electricit
y’s share in energy
versus
environment
Energy is an important factor in everyday human lives, whether it is through electricity, usage of fossil fuels for vehicle purposes or heating using natural gas. Its usage has been critical to maintain our comfort, through the majority of its forms, suffering a 49% growth in consumption between 1984 and 2004 (Pérez-Lombard, Ortiz, & Pout, 2008). Consequentially , electricity generation also experi-enced nearly a quadruple growth between 1973 and 2014 (International Energy Agency, 2016), with prospects of further increase around 43% until 2031 (World Nuclear Association, 2011).
This increase of electricity generation supports the discovery of technologies that enabled its production through renewable resources. However, coal remains as the fuel with the highest share of electricity generation (International Energy Agency, 2016). This creates an environmental impact, sup-ported by the growth of 𝐶𝑂2 (carbon dioxide) emissions by 43% between 1984 and 2004 (Pérez-Lombard et al., 2008), and the fact that it is a limited resource. In addition, electrical energy production is responsible for approximately 37% of the total of global 𝐶𝑂2 emissions (World Nuclear Association, 2011).
The increase of emissions developed into palpable climate changes and an increase worry for the planet’s sustainability. According to (Rissman, 2013), “The limiting factor on humans' fossil fuel use will not be the exhaustion of economically recoverable fossil fuels, but the exhaustion of the Earth's
capacity to withstand the harmful by-products of fossil fuel combustion”. This means that even before the drainage of all the planet’s fossil fuel reserves, irreversible changes would affect the environment.
Therefore, nowadays, renewable energy resources – any resource that regenerates naturally, over a human timescale, and derived directly or indirectly natural movements and mechanisms of the environment (e.g. sun and wind) – have an important role in global energy production.
6
2.2 Renewable energy sources: solution or problem?
Renewable energy sources, as clean energy, can help fulfil the end-users demands when the production is not enough, by taking some weight out of conventional energy production and helping with the diminishing of GHG emissions as observed in Figure 2.1
Figure 2.1 – Lifecycle greenhouse gas emissions intensity by energy generation method. The error bars relate to the range between different studies. Adapted from (World Nuclear Association, 2011).
A problem of renewable energy is the investment required for production infrastructures. How-ever, some technologies can achieve prices similar to fossil fuel currently. In 2014, fossil fuel delivered electricity regularly between 0.045 $/kWh and 0.14 $/kWh, with some solar photovoltaic projects capa-ble of reaching prices as low as 0.06 $/kWh and onshore wind reaching 0.05 $/kWh (Irena, 2015). The values presented are in American dollars.
The usage of natural resources, while being environmentally friendly, has some adjacent prob-lems. The most important is the reliability of supply. By depending on climacteric conditions, these sources are dependent on external factors. Any significant change in weather can alter the production of energy and possibly halting it all together. These resources, by not producing based on demand, lead to unnecessary production if not well managed.
The answer to the question: “Renewable energy sources: solution or problem?” is solutiondue to the environmental impact of fossil fuels. However, this solution does intake some problems, due to its unreliability. 0 200 400 600 800 1000 1200 1400 1600 G H G E m is si on s (T o n n e s CO ₂e /G W h)
Electricity generation sources
Lifecycle greenhouse gas emissions intensity per unit
of energy per source
7
Flagged as a solution, the European Union (EU) created a package, known as “2020 climate & energy package”, based on three key targets (European Comission, 2016):
20% cut in GHG emissions (from 1990 levels);
20% of EU energy from renewables;
20% improvement in energy efficiency.
Respecting this package, occurred an increase of renewable energy installed capacity as wit-nessed in Figure 2.2.
2.3 Electricity: consumption patterns
Electricity is a good that the vast majority of consumers specify as a personal need, with 99,9% of the houses in Portugal having electricity by being connected to the grid by 2010 (INE & DGEG, 2011). Also, by 2012, 84.6% of world population had access to electricity, with the majority of the European countries presenting a share of approximately 100% (The World Bank, n.d.).
Different applications use electricity, like a consumer item, to perform their tasks, such as light-ing, heating or coollight-ing, operating appliances and electronic devices. The consumption depend on human behaviour, which differs between seasons, because the consumers have different needs whether it is summer or winter, and between diverse geographic locations. Although it can be predictable on a large timescale, it incorporates an unpredictability factor.
Accordingly, the author displays below aspects of electricity consumption, for Portugal and USA.
Figure 2.2 –Energias de Portugal (EDP) total installed capacity in MW of different types of renewable energy resources between 2005 and 2013 in Belgium, Brazil, France, Portugal, Spain and USA combined. This chart includes both special and conventional regimes. Adapted from (Energias de Portugal (EDP), 2014).
0 5000 10000 15000 20000 25000
2005 2006 2007 2008 2009 2010 2011 2012 2013
In sta ll e d C ap aci ty (M W) Year
Total installed capacity of renewable energy
resources (wind, thermal and hydro) per year
Thermal
Hydro
8
2.3.1 Portugal
In Portugal, the day with the highest peak, is usually in the winter. Its consumption peaks reach up to almost twice the value of the lowest demand period (Redes Energéticas Nacionais, 2014), as cor-roborated by Figure 2.3.
Figure 2.3 – Load diagram of two different days in different seasons. Consumption of the en-tire country. Adapted from (Redes Energéticas Nacionais, 2016).
Since the electricity fully penetrated the market, its consumption has three main sectors: transport, industry and buildings (residential and commercial).
In Portugal, by 2013, electricity consumption divided itself as follows: industry (37%), services (34%) and domestic purposes (26%) as observed in Figure 2.4. The services share refer, mostly, to electricity usage within commercial or offices buildings (Direção-Geral de Energia e Geologia, 2013). This determines that, building-related expenses are the main reason for the consumption of electricity with near 60% (34%+26%) of its total.
0 1000 2000 3000 4000 5000 6000 7000 8000
00:00 04:00 08:00 12:00 16:00 20:00
Po
w
e
r
(MW)
Hour
Portuguese load diagram of two different days in
different seasons
9
Figure 2.4 – Electricity consumption by sector in Portugal, in 2013. Adapted from (Direção-Geral de Energia e Geologia, 2013).
2.3.2 USA
Changes in electricity demand levels are generally predictable and have daily, weekly and sea-sonal patterns. Daily fluctuations create consumption peaks, as seen in Figure 2.5, which vary between seasons. Summer and winter months tend to have higher demand levels than fall or spring due to space conditioning (heating or cooling) (U.S. Energy Information Administration, 2011b).
Figure 2.5 – Example of a load diagram in New England, USA on a autumn’s day (U.S. Energy Information Administration, 2011a).
37%
26% 34%
1% 2%
Electricity consumption by sector
Industry
Domestic
Services
Transportation
10
In the USA, the residential, or domestic, sector led the total consumption of electricity in 2014 with 36%, followed by commercial purposes with 35%, industry 28% and transportation 0.2% (U.S. Energy Information Administration, 2016). Since the commercial and residential sectors link with build-ings, they have a considerable impact on electricity consumption with 71% of its total (36%+35%).
2.4 Buildings: electricity utilization and consequences
As explained in 2.3, buildings have a high share of the total consumption of electricity, which embodies some consequences. Depending on the amount of consumption, it affects the payment bill and influences the load management problem. Both usage and price depend heavily on human behaviour patterns, geographic location and rules associated with said location. Accordingly, buildings represent an opportunity to optimize the load management and general energy efficiency.
2.4.1 Utilization
Concerning buildings’ consumption, the average annual consumption of a residence utility cus-tomer was 10 932 kWh in 2014, in the USA (U.S. Energy Information Administration, 2015b) and 3 673 kWh in Portugal in 2010 (INE & DGEG, 2011). Dividing equally, between twelve months, results in approximately 911 kWh and 300 kWh, respectively, per month. However, this calculation has an error attached because of significant differences in consumption between seasons, as explained in 2.3.1 and 2.3.2.
For possibility of consumption, the consumer establishes a contract agreement with the service provider for energy and power supply.
2.4.2 Contract conditions
Each contract has specific conditions: power supplied (in kVA) and its attached price per day (in € or $), type of schedule (how many different prices per day) and the various prices per energy (€/kWh or $/kWh).
Electricity’s prices depend on several variables. It may be, throughout a specific period, constant or variable, established by a single entity or different between service providers.
Such variables also vary between geographic locations, as displayed further below.
2.4.2.1
Portugal
11
Contract agreement’s total cost, for the consumer, depends on several variables such as con-tracted power, type of schedule, method of payment and type of receipt. Concon-tracted power is the maxi-mum power supplied to the consumer and, for households or small companies and offices, it ranges between 1,15 kVA and 41,4 kVA (EDP Comercial, 2016). The type of schedule is the amount of differ-ent prices per energy, throughout one day, while the method of paymdiffer-ent refers to ATM paymdiffer-ent or direct debit. The type of receipt is the choice between physical or virtual receipt.
For example, the price range, listed alphabetically by service providers, for a direct debit with virtual receipt electricity contract (between 1.15 kVA and 41.4 kVA) within different types of schedules can be:
EDP Comercial: Contracted power between 0.0832 and 0.8495 €/day and energy con-sumption between 0.0805 and 0.3192 €/kWh.
ELusa: Contracted power between 0.1536 and 1.6544 €/day and energy consumption between 0.0696 and 0.3047 €/kWh.
ENAT: Contracted power between 0.0832 and 2.1472 €/day and energy consumption between 0.0756 and 0.3227 €/kWh.
ENDESA: Contracted power between 0.1492 and 1.5242 €/day and energy consump-tion between 0.0705 and 0.2718 €/kWh.
Energia Simples: Contracted power between 0.0832 and 2.1472 €/day and energy con-sumption between 0.0750 and 0.3105 €/kWh.
GALP Energia: Contracted power between 0.1261 and 1.9278 €/day and energy con-sumption between 0.0762 and 0.2967 €/kWh.
The prices shown above are presented without the value-added tax (VAT) and were obtained from the (ERSE, 2016) report. Additionally, above the 41.4 kVA mark, prices are dependent on the situation, requiring a specific contact with the service provider.
The types of schedules used are identical between each provider, dividing up to three different periods the 24-hour cycle. Each of this division has a different price per unit of energy (e.g. €/kWh). There can be one (normal price), two (normal and economic) or three prices per day (normal, economic and super economic). However, the normal price is different between each division.
As an example, Figure 2.6 demonstrates a type of schedule from a specific service provider,
12
Figure 2.6 - Difference between types of schedules and the respective types of price in a specific energy provider (EDP Comercial). Adapted from (EDP Comercial, 2016).
Between the types, which have different price tags during the day, there are also two options: weekly or daily cycle. The consumer chooses the one which best fits his needs.
In every schedule, there is something constant: the attempt for the costumer to use electricity outside peak hours (late afternoon, early evening to beginning of night). This would lighten the demand during those periods, decreasing the demand’s fluctuations intensity.
2.4.2.2
USA
In the USA, prices per unit of energy can fluctuate within every minute, depending mostly on the current demand. Whenever the demand is highest, so is the price. This demand is usually higher during the afternoon and early evening (also known as peak hours). In general, these prices are higher in the summer due to the higher demand observed during that season (U.S. Energy Information Administration, 2015a).
During the year of 2014, the average retail price of electricity within the USA was different between sectors with the following:
Residential: 12,50 cents per kWh;
Commercial: 10,75 cents per kWh;
Industrial: 7,01 cents per kWh;
13
With these prices, the global average retail price for electricity was 10,45 cents per kWh (U.S. Energy Information Administration, 2015a). All the prices in 2.4.2.2 are in American dollars.
2.4.3 Load management
The increase of global electricity consumption, based on the easy access to electricity and its impact on personal comfort, united with the global human behaviour created fluctuations in its con-sumption.
During the hours of peak usage, the grid must be able to fulfil the needs of its users. Due to the users’ energy demand, the consumption will be continuously fluctuating, creating large differences in energy demand during the day. In order to brace those peaks, the distribution and transmission processes are over-dimensioned. By creating such an empowered energy delivery and transmission system, we acknowledge that, most of the time, the grid is working far from its maximum capabilities, proving the existence of energy inefficiencies. In extreme cases, the ratio between peak and lower power levels in end-user demand, can reach a value of 10 (Ibrahim, Ilinca, & Perron, 2008).
A valid solution to stabilise the energy daily grind and increase the usage efficiency is through load levelling.
Energy load levelling is a method for reducing the large fluctuations that occur in electricity demand. Storing energy during periods of low demand and releasing it later, when there are high demand periods (peaks), is key to implement load levelling as Figure 2.7 demonstrates.
14
15
3.
Energy storage systems
In this chapter, there is an explanation of the definition, virtues, characteristics and applications of energy storage systems. It also describes a comparison between several devices to discover which are better suited for the purpose of this thesis.
3.1 Overview
Energy storage systems, or ESSs, are devices installed within a power system that can store and release energy received by the power grid.
Inconsistencies in energy consumption-generation balance such as fluctuation in power usage and the unreliability of energy production by virtue of renewable resources created the need to develop such devices.
These devices, would not only enable the implementation of the energy load levelling method, as detailed in 2.4.3, but also ensure the reliability of renewable energy resources and power quality within the network, amongst others, as displayed in Figure 3.1.
Energy storage systems are categorised by the type of stored energy each one utilises. This categorisation is as follows:
Chemical energy Hydrogen, batteries and flow batteries;
Electrical energy Capacitors, supercapacitors and superconductors;
Mechanical energy Flywheels, compressed air and pumped hydroelectric;
Thermal energy Sensible and latent heat storage, cryogenic storage and pumped heat.
16
Figure 3.1 – Benefits of energy storage systems (Ibrahim & Ilinca, 2013).
These systems are divided into three primary components: storage medium or energy storage unit, power conversion system (PCS) and balance of plant (BOP) (Schoenung & Hassenzahl, 2003) as Figure 3.2 shows.
Figure 3.2 – Schematic of a possible composition of a ESS (Zakeri & Syri, 2015). This figure does not include the BOP.
17
The third component, BOP, is the protection of the system, its physical surrounding. It encloses the equipment, controls the storage facility environment and provides the connection between PCS and the grid.
In recent years, there has been a global attempt to improve the capacity of energy storage capa-bilities, resulting in the increase of nearly 40 GW in the last 14 years (International Energy Agency, 2015).
3.2 Characteristics
Before analysing in detail the different types of storage systems, the author discloses some con-cepts regarding these technologies and their respective units, if applicable. Some units are not in tandem with the international system of units for easier manipulation and visualisation.
Power Density (𝑊/𝑚3) – amount of power per unit of volume.
Energy Density (𝐽/𝑚3) – amount of energy per unit of volume. Also known as specific energy. Capacity (𝑊ℎ 𝑜𝑟 𝐴ℎ) – amount of available energy after a full recharge. It is the total of energy stored in a specific ESS.
State of charge (% 𝑜𝑓 𝑐𝑎𝑝𝑎𝑐𝑖𝑡𝑦) –percentage value of remaining energy within an ESS unit. Rated Power (𝑊 𝑜𝑟 𝑉𝐴) –value representing the operational power of charge or discharge. Both values are usually different.
Discharge Time (𝑚𝑖𝑛𝑢𝑡𝑒𝑠)– duration of a complete discharge. It is a relation between capacity and rated output power.
Recharge Time (𝑚𝑖𝑛𝑢𝑡𝑒𝑠)– duration of a complete charge. It is a relation between capacity and rated input power.
Efficiency (%) – ratio between the energy stored in the ESS and the energy supplied to it. Measures the energy loss by comparing its output with its input.
Durability– number of cycles, or years, the system can withstand. A cycle consists on a charge and a discharge of energy.
Self-discharge (𝑊ℎ 𝑜𝑟 𝐴ℎ) – amount of energy dissipated from the system while not in use. Maturity– whether the technology has developed enough for implementation. Expresses the degree of “technical and commercial readiness”.
18
Equivalent full-load hours (ℎ𝑜𝑢𝑟𝑠 𝑝𝑒𝑟 𝑦𝑒𝑎𝑟)– amount of hours per year an ESS operates to store energy.
Response Time (𝑠𝑒𝑐𝑜𝑛𝑑𝑠)– time that an ESS takes to react to a given input.
Specific investment cost (SIC) (€/𝑘𝑊)–cost value of one kilowatt. Investment cost per in-stalled power.
Levelised Cost of Storage (LCoS) (€/𝑘𝑊ℎ)(World Energy Council, 2016) – It is a fictitious average ‘net’ price that must be received per unit of output (kWh) for storing energy during its entire lifetime, in order to reach a specified financial return. This notion standardises the units of measuring the lifecycle costs of storing energy. It eases the comparison of the cost of storing one unit of stored electric energy by each technology.
LCoS takes into account different characteristics (detailed further in Table 3.1) of the technol-ogies as described in equation 1 and Table 3.1 (World Energy Council, 2016).
𝐿𝐶𝑜𝑆 =𝐼𝑜+ ∑
𝐴𝑡
(1 + 𝑖)𝑡 𝑛
𝑡=1
∑ 𝑀𝑒𝑙
(1 + 𝑖)𝑡 𝑛
𝑡=1
(1)
𝐿𝐶𝑜𝑆 − 𝐿𝑒𝑣𝑒𝑙𝑖𝑠𝑒𝑑 𝑐𝑜𝑠𝑡 𝑜𝑓 𝑠𝑡𝑜𝑟𝑎𝑔𝑒 [𝑘𝑊ℎ]€
Table 3.1 – Explanation of calculation of LCoS variables (World Energy Council, 2016).
Variables Definition Unit
Investment costs(𝑰𝒐) Specific investment cost (SIC)
* rated power Euro (€)
Annual total costs in year(𝑨𝒕) Operational costs (in %) *
in-vestment costs Euro (€)
Produced electricity in each year(𝑴𝒆𝒍)
Rated power * Equivalent
full-load hours * Efficiency kWh
Technical lifetime(𝒏) Durability of a device in years Years Year of technical lifetime(𝒕) “Age” of the specific device Integer(1,2,3,…n)
19
As detailed in Table 3.1, SIC is a part of the investment cost. This parameter describes the investment required per installed discharging capacity (€/kW).
The annual costs are a small part (usually between 1% and 5%) of the total investment costs. In addition, the weighted average cost of capital (WACC) is a tax value used to discount future electricity discharge. This equation assumes that there are no changes in parameters or prices during its lifetime and that there is no input for the price of charging power (can be added later for specific studies) (World Energy Council, 2016).
These concepts will be the basis of an informed decision on which systems are best for this thesis. The next sub-chapter, with these notions, compares different types of ESSs technologies regard-ing some rules.
3.3 Comparison between ESS technologies: Which are better
suited for this project?
Before being able to make a comparison between different energy storage systems, the author developed a review of existent technology to understand their operational process, their composition and their definition. The technologies in comparison are hydrogen energy storage, lead acid batteries, nickel-cadmium batteries, sodium sulphur batteries, sodium nickel-chloride batteries, lithium ion bat-teries, flow batbat-teries, supercapacitors, superconducting magnetic energy storage, flywheels, compressed air storage, pumped hydroelectric and thermal energy storage.
The comparison uses several characteristics that differentiate the technologies. Size, maturity, environmental impact, efficiency, rated power, discharge time, durability and cost are some specifica-tions that this analogy uses to reach a conclusion on the implementation of an intelligent energy man-agement system within buildings.
3.3.1 Size
Since the project designed is to use these technologies within buildings, size is crucial. There-fore, the devices chosen must have dimensions that a normal building can accommodate. With this in mind, the infrastructures of compressed air energy storage, pumped hydroelectric and thermal technol-ogies, preclude the usage of these devices within residential buildings.
3.3.2 Maturity
The possibility of implementation depends on already developed technologies. Maturity deter-mines which devices are capable of implementation.
20
stages of research and development, due to the lack of guarantees these might provide. Likewise, it only considers technologies in the decreasing part of the curve (capital requirement * technology risk). Through this decision, supercapacitors, superconducting magnetic energy storage, hydrogen technolo-gies, sodium-nickel chloride batteries and flow batteries are not suitable for this project at this time.
Figure 3.3 – Maturity curve of different ESS technologies (SBC Energy Institute, 2013).
3.3.3 Environmental Impact
The effect on the environment is an important factor on the choice of these technologies. Within the technologies studied, one contained an element that is toxic for the environment (cadmium). Conse-quently, nickel cadmium batteries are not useful. Although lead acid batteries are hazardous, there are technologies that recycle lead without consequences to the environment, reaching up to a total of 98.25% of lead content recycled (Exide Technologies, 2016).
3.3.4 Performance characteristics
These characteristics are capacity, rated power, discharge time, charging time, durability, effi-ciency, response time, self-discharge, maximum depth of discharge and operational temperature.
Table 3.2 presents the specifications’ values for different energy storage systems. The table show an interval of values for each technology’s parameter. However, depending on the usage of each ESS, it tends more to the beginning or end of that interval, depending on the application. For example, if a battery completes two cycles per day, its longevity should be shorter than if it only does it once per day.
21
the implementation of a sodium sulphur battery is difficult within a building due to the high operating temperature, precluding its use.
Table 3.2 – Performance characteristics of different ESSs for short-term storage. Adapted from (Badwal, Giddey, Munnings, Bhatt, & Hollenkamp, 2014; H. Chen et al., 2009; Hadjipaschalis, Poullikkas, & Efthimiou, 2009; World Energy Council, 2016; Zakeri & Syri, 2015).
Characteristics Technologies
Parameter Unit Lithium ion battery
Sodium sul-phur battery
Lead acid
battery Flywheel
Rated power kW up to 10 000 Up to 34 000 Up to 70 000 Less than 500 Discharge time at
rated power time
Minutes to 10 hours Seconds to 10 hours Seconds to 10 hours
Milliseconds to 15 minutes
Recharging time time Minutes to
hours ~9 hours 8-16 hours
Less than 15 minutes
Efficiency % 80 - 92 75 - 80 65 - 90 80 - 95
Maximum depth of
discharge % Up to 90 Up to 90 60 - 70 Up to 100
Self-discharge per
day % 0.1 - 0.3 ~20 0.1 - 0.3 100 (20 per hour)
Durability years 5 - 20 15 - 25 5 - 15 15 - 20
Durability cycles 1500 - 4500 2500 - 4500 2000-4500 105 to 107 Response time seconds 0.18 – 0.3 0.18 – 0.3 0.18 – 0.3 4 - 10 Operating
temper-ature °C -10 to 50 300 to 350 -5 to 40 20 to 40
3.3.5 Cost
22
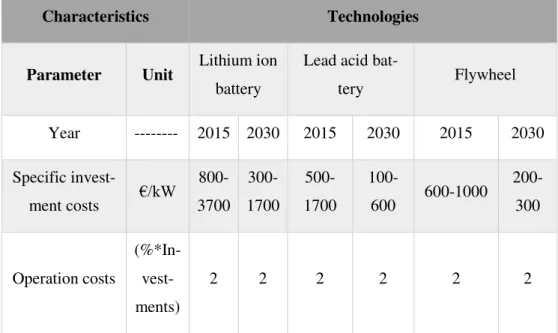
As displayed, the expectation is a decrease on investment costs until 2030, due to the increasing need and usage of these technologies in the near future. Hand in hand with this usage growth, are ex-pected several developments for every storage technology. This advancement anticipates the average increase of durability, efficiency and maximum depth of discharge (World Energy Council, 2016). Table 3.3 – Investment and operational costs differences between ESSs technologies in 2015 and its ex-pected evolution until 2030. Adapted from (World Energy Council, 2016).
Characteristics Technologies
Parameter Unit Lithium ion battery
Lead acid
bat-tery Flywheel
Year --- 2015 2030 2015 2030 2015 2030 Specific
invest-ment costs €/kW
800-3700 300-1700 500-1700
100-600 600-1000
200-300 Operation costs (%*In- vest-ments)
2 2 2 2 2 2
Based on SIC and LCoS notions, a technology financial review was developed in World Energy Council, 2016, which considered different possible implementation of ESSs. It resulted in a range of values for LCoS in 2015 and 2030 visible in Table 3.4 .
Table 3.4 – Levelised cost of storage between ESSs technologies in 2015 and its expected evolution until 2030. Adapted from (World Energy Council, 2016).
Characteristics Technologies
Parameter Unit Lithium ion battery
Lead acid
bat-tery Flywheel
Year --- 2015 2030 2015 2030 2015 2030 Levelised cost
of energy stor-age (LCoS) €/kWh 0.15-0.7 0.15-0.19 0.11-0.4
0.06-0.08 0.06-0.09
0.02-0.04
23
The calculations required to achieve these values, in Table 3.4, depend on the SIC and LCoS notions explained in 3.2 and Table 3.1. The discount rate (WACC) is 8% and there is no price variations throughout the durability of the system. Plus, the LCoS does not include the cost for input electric energy (World Energy Council, 2016).
Even so, to reach the values presented in Table 3.3 and Table 3.4 , the financial review assumed that the discharge time at rated power is between 1 and 4 hours for lithium ion and lead acid batteries and 0.25 hours (15 minutes) for flywheels (World Energy Council, 2016).
The calculation of LCoS (Table 3.4), for both 2015 and 2030, stipulated the values of equivalent full-load hours, efficiency, maximum depth of discharge and technical lifetime as represented in Table 3.5.
Table 3.5 – Assumptions for LCoS calculations. Adapted from (World Energy Council, 2016).
Characteristics Technologies
Parameter Unit Lithium ion battery
Lead acid
bat-tery Flywheel
Year --- 2015 2030 2015 2030 2015 2030 Equivalent
full-load hours
Hours/year 365-1460 365-1460 365-1460
365-1460 1825 1825
Efficiency (%) 85 92 77 82 88 88
Maximum depth of
dis-charge
(% of
ca-pacity) 70 80 65 75 100 100
Technical
lifetime years 6 12 5 15 15 15
The results obtained through the LCoS calculation are not perfectly accurate, because it can change depending on its application. It is noteworthy that the BOP is not included in the final cost. Nonetheless, it is a good method for comparing costs between ESSs.
3.3.6 Summarize and conclusions
24
25
4.
Previous work and proposed approach
This chapter enlists some previous work within the field of this project and specifies the general idea behind this project by enumerating its subparts and explaining its main functionalities.
4.1 Previous work
Several researchers have conducted studies for intelligent management systems in the past few years. Within this field, building simulation tools are the whole-building energy simulation programs that provide users with key building performance indicators, such as energy use, demand and costs. In addition, most of these programs rely on assumptions referring to human behaviour (Robinson, 2006).
In (Crawley, Hand, Kummert, & Griffith, 2008) there is a comparison between twenty simula-tion programs such as EnergyPlus, which this article considers as the state of the art regarding building energy simulation software. However, these do not support energy storage systems, basing themselves on the optimization of utilities usage within buildings. Another example is (Byun, Hong, & Park, 2012), which proposes intelligent cloud home energy management systems to establish dynamic priorities to household appliances.
However, some designs implement energy storage systems for energy optimization, as in (C. Chen, Duan, Cai, Liu, & Hu, 2011; Cirrincione et al., 2009; Huang, 2010).
The FREEDM system (Huang, 2010), on one hand, attempts to change the entire power network with the help of solid-state transformers and energy storage systems, using renewable energy resources to provide “cleaner” energy with guaranteed stability. The possibility of plug-and-play within the power network is the main objective within this system. It uses management systems throughout the grid for decision-making purposes, in order to achieve distributed generation.
Another proposition is a system able to self-regulate a heterogeneous set of power sources and loads with the help of energy storage systems to optimize cost and efficiency (Cirrincione et al., 2009). It uses a multi-agent system to perform the communication between the load demand, the sources and
26
the grid. Although the strategy is always the same, the researchers are designing new techniques to improve the decision-making and enable the creation of new and more efficient management strategies. In (C. Chen et al., 2011), a smart energy management system , accompanied by energy storage systems, has application on improving the reliability of photovoltaic modules, in different weather con-ditions.
Other propositions, as (Hajizadeh & Golkar, 2007; Wai & Jhung, 2013) limits the use of energy storage systems by adopting specific technologies for hybrid distributed generation.
Some studies have also applied this methodology to optimize vehicular energy optimization as (Amjadi & Williamson, 2010; Lukic, Jian Cao, Bansal, Rodriguez, & Emadi, 2008) propose, in order to improve electric propulsion, battery life and overall vehicle efficiency.
4.2 Proposed Approach
This subchapter details the approach, or architecture, of the proposed system to implement, through explanation of its components and respective method of operation.
4.2.1 Components
This project’s objective is the development of a system, with methodologies and an algorithm, which enables the interoperability between diverse energy storage systems and optimizes energy sumption in buildings. Such ambition requires different components with dissimilar operational con-straints. These components are storage systems, the source that supplies the energy and the energy usage. This system tests its viability through a simulator, employing user interfaces and algorithms to achieve its goals.
Consequentially, Figure 4.1 displays the above-mentioned components and the system’s run -time perspective.
27
Figure 4.1 – Components of the system and its run-time perspective.
The energy supplier, or source, depends on the contract agreement established between the sumer and the energy provider. It contains the type of schedule and respective energy prices, the con-tracted power and its price per day. Likewise, renewable sources, connected to the building, can produce energy, possibly precluding the supply from the power grid.
Energy usage depends on human behaviour patterns. These patterns, aligned with predictive models, will allow some predictability on future behaviour. Perfect precision is impossible to achieve due to unpredictable factors, however the models are adaptive to prevent fluctuations between predicted and real patterns.
4.2.2 Algorithm
4.2.2.1
Specifications
As seen in Figure 4.1, each component communicate with each other. This communication re-quires the creation of algorithms, due to the interoperability between the different components.
Such an algorithm craves specific characteristics, which Figure 4.2 exhibits.
28 Figure 4.2 – Characteristics of the algorithm.
For example, if peak shaving is the chosen strategy, the system establishes a KPI that is a max-imum usable instantaneous power value. This will enable to maintain a desirable quality of service (QoS).
For energy usage optimization, the system’s management includes ways to limit and negotiate the user energy demand. It knows when to use the ESSs or the grid, to supply the user, and from which specific device within the set of storage units. In this part, the most important factors are price and time. The ESSs charge during the lowest-priced period of the day, in order to lower the cost of storage.
In order to supply the users with energy, the storage units discharge in appropriate periods, enabling energy usage whenever required.
Since the energy usage depends on, somewhat unpredictable, human behaviour, the algorithm has predictive capabilities. The impact of the instantaneous balance between supply and demand is not as important as its cumulated value, so, the system predicts, along a moving extended horizon, the de-mand response and usage consumptions. Ergo, this predictable engine requires reliable patterns of usage. This engine includes learning capabilities of the energy usage, provides the estimated values for user demand and foresees the status of the balance, between demand and supply, in an extended horizon.
Management
and Control
Usage
Perfor-mance
Modelling
and
Simula-tion
Security and
Stability
Model-based Decision and ControlDemand Side Management Demand Response Prediction Engine Control strategies Levelised cost of storage
29
This system requires physical devices, which connect to the power grid through the electrical installation of the building. Accordingly, it has to maintain security and stability measures. The security and stability factor relies on a set of operational restrictions applied to the system. This includes the protection of the ESS (BOP) and the power electronics required for grid integration. An example of a security measure is the input/output current and voltage limitations of each ESS.
For device comparison information, the algorithm produces a financial review of each ESS through the LCoS notion, cost of energy for the simulated time and the possible gains between using and not using ESSs. This knowledge provides insight on the final viability of the intelligent management of energy storage systems within buildings.
4.2.2.2
Justification
The specifications for the proposed algorithm in subchapter 4.2.2.1, detail its characteristics. However, it does not explain why these characteristics can optimize the energy consumption.
First, the system requires security and stability measures so that the grid-building connection is not impaired due to the addition of energy storage systems. Therefore, it includes power electronics to facilitate this connection and not incur in additional expenses related to equipment damage.
In addition, the system optimizes the energy consumption through the usage of its several com-ponents, depending on the implemented strategies.
For example, using a schedule of a daily cycle, from Figure 2.6 in subchapter 2.4.2.1, with three prices per day within the summer, the system manipulates the schedule to its own advantage. It can charge the ESSs within the cheapest periods, and discharge them when the price is the most expensive.
A possibility of prices, obtained from (ERSE, 2016), can include the lowest price as 0.0927 €/kWh, the average price as 0.1632 €/kWh and the highest price as 0.3179 €/kWh (with 10.35kVA contracted power). This way, if a specific ESS has a 75% global efficiency, it can store 7.5 kWh, using 10 kWh (75% of efficiency), with the cost of 0.927 € (within the lowest price period). If this energy is, later, discharged during the higher priced period, it saves around 2.384€ (7.5 kWh * 0.3179 €/kWh) of grid-supply cost. Therefore, through this transaction the user saved almost 1.5€ by using this algorithm, without including the cost of the storage systems that the LCoS notion represents.
The system can achieve this through the manipulation of charging and discharging the energy storage systems, predicting the user pattern of energy consumption and creating the KPIs based on the specific storage devices and the source that is available.
30
Consequentially, this proposed algorithm can optimize the energy consumption by using energy when the price is the cheapest of the day and use it whenever required. Even if this functionality uses more energy than the required for usage consumption (due to storage devices efficiency), it enables the creation of multiple and diverse strategies, which can improve energy usage in different manners, such as the load management problem, expressed in subchapter 2.4.3, or the possibility of lowering the annual energy costs within a building.
None the less, the proposed approach ensures the maintenance of QoS by ensuring that if there is not enough stored energy, the grid outputs the remaining, even if it leads to a negative financial result. This is crucial, because the user should not notice if the energy comes from the storage system or the grid. The important factor is that usable energy is constantly available.
To test the viability of this proposed approach, the system implements a simulator, which is described below.
4.2.3 Simulator
As stated before, this system contains a simulation platform to check the results of the operations and the algorithms’ behaviour. This platform produces the proof-of-concept of the proposed methodol-ogies and consists on the following components: management system, knowledge repository, the plant simulator and a specific graphical user interface (GUI) for each component, except the knowledge re-pository (Figure 4.3).
The management system implements and executes the algorithm, transports information to and from the knowledge repository and sends actuator commands to the plant. The plant simulator includes the storage systems, energy sources and the user patterns and transmits the sensorial data back to the management system, containing the state of the plant.
The plant simulator is a physical plant of connections between ESSs and the energy source. However, for proof-of-concept testing and research, the author develops it as software. Through its GUI, the user can create usage patterns, ESSs and sources to emulate their real-life behaviour.
31
Figure 4.3 – Simulation platform operational method.
4.2.4
System’s
modus operandi
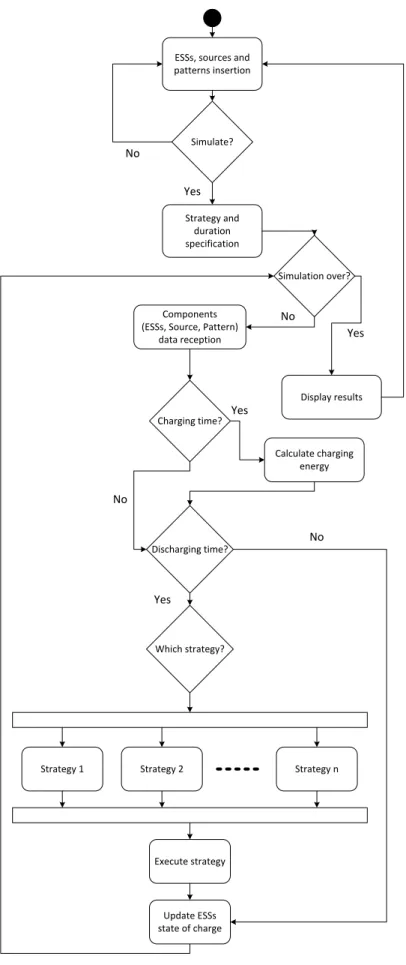
After the system’s components explanation, this subchapter demonstrates the workflow of the designed architecture in Figure 4.4. This workflow represents the operational methodology of the algo-rithm to be developed, contained within the management system.
The user inserts, at least, one of every component through the plant simulator’s GUI. After-wards, to perform a simulation, the desired strategy and simulation duration is required. Next, when the simulation starts, for every iteration, the management system receives sensorial data from the plant sim-ulator and checks if it is appropriate to charge or discharge the ESSs. The devices’ specific characteris-tics influences the charging and discharging order, while the strategy chosen also affects the latter. At the end of each iteration, the charged and discharged energy update each unit’s state of charge. The system updates the state of charge by subtracting the charging and discharging values. This cycle repeats itself until the simulation finishes as detailed in Figure 4.4. At the end of the simulation, the management system GUI displays the obtained results. If, in a specific iteration, it is not time to charge or discharge, both these values are zero, maintaining the same state of charge.
4.3 Relation between previous work and the proposed approach
The architecture proposed within chapter 4 differs from the previous work due to the combina-tion of diverse energy storage systems to optimize energy consumpcombina-tion and lower the costs through multiple strategies. It includes the behavioural patterns in the form of energy consumption, without requiring utility specification and it applies to buildings with distinct necessities.Therefore, this simulator can embrace the user’s situation and test which storage devices are better suited for that specific application, providing a financial review regarding its viability.
32
ESSs, sources and patterns insertion
Strategy and duration specification Yes No
Display results Yes Components
(ESSs, Source, Pattern) data reception
No
Yes
Calculate charging energy
No
No
Yes
Strategy 1 Strategy 2 Strategy n
Execute strategy
Update ESSs state of charge
Simulate?
Charging time?
Discharging time?
Which strategy?
Simulation over?