Luz Catarina Neves Fernandes
MSc. in Technology and Food Quality
Development of new analytical methods for
Matrix Assisted Laser Desorption Ionization Mass
Spectrometry-based applications. Focus on
proteins, polymers and small molecules
Dissertação para obtenção do Grau de Doutor em Química Sustentável
Orientador: Prof. Doutor José Luis Capelo Martinez, Professor Auxiliar Faculdade de Ciências e Tecnologia
Universidade Nova de Lisboa, Portugal
Co-orientadores: Prof. Doutor Carlos Lodeiro Espiño, Professor Auxiliar Faculdade de Ciências e Tecnologia
Universidade Nova de Lisboa, Portugal
Prof. Doutora Isabel Maria Andrade Martins Galhardas de Moura, Professora Catedrática Aposentada
Faculdade de Ciências e Tecnologia Universidade Nova de Lisboa, Portugal
Júri:
Presidente: Prof. Doutor José Júlio Alves Alferes
Arguentes: Prof. Doutor Francisco Manuel Lemos Amado Doutora Deborah Penque
Development of new analytical methods for Matrix Assisted Laser
Desorption Ionization Mass Spectrometry-based applications, focus on
proteins, polymers and small molecules.
Copyright © Luz Catarina Neves Fernandes, Faculdade de Ciências e Tecnologia, Universidade Nova de Lisboa.
“Sometimes we feel that what we do is nothing but a drop in the sea. But the ocean
would be less if it lacked a drop.”
Mother Teresa
“… podemos muito mais do que imaginamos.”
In Portuguese
Quando dei o primeiro passo estava longe de pensar que me iria entregar a uma tarefa que iria demorar anos… Foram muitos os altos e baixos ao longo deste percurso, muitas vitórias, mas também algumas derrotas. Termino assim esta etapa, onde ultrapassei muitos desafios e dificuldades imensas, com o sentimento de dever cumprido.
Estou muito reconhecida por tudo quanto recebi e estarei eternamente grata a todos os que me ajudaram neste desafio. Ainda assim, gostaria de agradecer particularmente :
Ao Professor Doutor José Luis Capelo Martinez, orientador deste trabalho, expressando a minha profunda admiração e reconhecimento. Um simples agradecimento não será porventura suficiente para expressar a minha gratidão por tudo quanto me ensinou e proporcionou. Agradeço a excelente orientação científica, a ajuda, o apoio, a paciência, a compreensão manifestada, as suas críticas e reflexões únicas e sobretudo, a confiança que em mim depositou quando me iniciou no mundo da espectrometria de massa MALDI-TOF e da proteómica, confiando-me o serviço de análises em 2006, de onde, posteriormente nasceu o convite para realização deste projeto. Sempre me soube motivar com a sua forma única de ser. Com a sua enorme generosidade, sempre se recusou deixar-me desfalecer nos momentos mais difíceis, servindo inúmeras vezes de trampolim para alcançar objetivos. Reconheço-lhe sem dúvida notáveis capacidades de liderança sendo, para mim, um exemplo claro de dedicação genuína à Ciência. Para sempre, obrigada!
Ao Professor Doutor Carlos Lodeiro Espiño, co-orientador, agradeço o apoio incondicional, a disponibilidade e encorajamento que sempre demonstrou ao longo deste trabalho, assim como as barreiras que, ao longo deste percurso, me foi ajudando a erguer. Foi sem dúvida a pessoa que mais me incentivou e motivou desde o primeiro dia. A força e confiança que sempre me transmitiu transformou-se em energia positiva necessária para tudo conseguir. Agradeço ainda a sincera amizade que ao longo destes anos se foi criando e consolidando. Sinto-me imensamente privilegiada por isso. Muito muito obrigada!
Agradeço à Professora Doutora Isabel Moura, co-orientadora, pelo apoio, disponibilidade, simpatia, amizade e a ajuda proporcionada durante todos estes anos, quer no período em que presidia ao DQ, quer posteriormente.
À FCT/UNL, na pessoa do Senhor Diretor, Professor Doutor Fernando Santana, pela oportunidade facultada que permitiu levar a cabo este trabalho de Doutoramento nesta instituição, onde exerço funções de Técnica Superior no laboratório de análises da REQUIMTE desde 2003.
Ao Doutor Hugo Santos e à Doutora Elisabete Oliveira, colegas do grupo Bioscope, agradeço a amizade sincera, dedicação, disponibilidade e paciência sempre demonstrada ao longo destes anos. Um agradecimento muito especial ao Doutor Hugo Santos, pelos preciosos ensinamentos; amigo a quem recorrentemente bati à porta para resolver muitas questões de ordem técnica entre outras, auxiliando-me com preciosas indicações sempre com a paciência, disponibilidade e a calma que o caracteriza. Um imenso obrigado Hugo!
Aos restantes colegas do grupo Bioscope, que viram crescer este trabalho e que com paciência e amizade deram resposta à minhas questões intermináveis. Assim agradeço aos ex-membros (Doutora Raquel Rial, Doutor Ricardo Carreira, Doutor Gonçalo Vale, Doutor Marco Galésio, Doutor Bruno Pedras, Doutora Cristina Nuñes e Doutor Mário Diniz), e aos actuais membros (Javier, Eduardo, Adrián, Susana, Joana, Jessica, aos Gonçalos, Ana, Marta e Jamila ). Muito obrigada por toda a ajuda ao longo destes anos!
Agradeço à Professora Doutora Ana Lourenço, coordenadora do laboratório de análises, pela oportunidade que me concedeu de poder conciliar, sempre que necessário, o meu trabalho diário do laboratório de análises com a finalização deste projeto.
Aos meus colegas do laboratório de análises, Carla Rodrigues e Nuno Costa, agradeço o companheirismo diário e o incentivo.
Um especial agradecimento à Ana Teresa Lopes pela amizade e pelas palavras de incentivo.
Agradeço às amigas de batalhas, Alaíde Agripino e Isabel Pinto, que como eu também tiveram que percorrer este caminho até ao fim. Muito obrigada pela amizade, carinho, paciência, disponibilidade, ajuda e pelas inúmeras palavras de incentivo.
Finalmente um agradecimento essencial à minha família que é o meu combustível e me ajudou na conquista de mais um sonho. Assim agradeço aos meus irmãos pelo amor que nos une e por serem quem são. Agradeço à minha mãe, sempre! Por tudo, pelo amor incondicional, pela ajuda, pelo incentivo, mesmo estando longe. Pelas inúmeras viagens feitas para Lisboa para acorrer ao meu auxílio sempre que era solicitada. Obrigada Mãe!
sido minha mãe na ausência da minha; mãe dos meus filhos na minha ausência e com quem sempre pudemos contar nos dias mais complicados. Ser-lhe-ei eternamente grata. O meu agradecimento é extensível ao meu sogro, Sr. Guido, que muito admiro. Muito obrigada.
Ao Nuno, o meu marido, pela paciência e por conseguir como ninguém suportar com grande sabedoria os meus desabafos, o meu mau humor e falta de paciência, que ao longo destes últimos tempos foram uma constante. Obrigada para sempre!
Às pessoas que não precisam de me dar motivos para sorrir, elas já são o motivo do meu sorriso, os meus filhos Tiago e André. Obrigada por serem o sol dos meus dias mesmo quando a vida está nublada. Mil e uma desculpas pelas longas horas de ausência, não tanto física mas sobretudo em espírito. Obrigada meus amores por existirem!
Por fim agradeço a todas as pessoas que direta ou indiretamente, embora não
expressamente referidas, contribuíram para que este trabalho tivesse sido elaborado.
A todos, um sincero, muito obrigado!
Pelo suporte com o financiamento agradeço:
- À FCT-MCTES, projecto PTDC/QUI/6650/2006, pelo financiamento do trabalho desenvolvido nos capítulos IV e V.
- À InOu 2009-UVIGO and Canterbury Christ Church University Research Fund, pelo financiamento do trabalho desenvolvido no capítulo IV.
-À FCT, projectos POCI/QUI/55519/2004 FCT-FEDER e PTDC/QUI-QUI/099907/2008, pelo financiamento do trabalho desenvolvido no capítulo VI.
Development of new analytical methods for Matrix assisted Laser Desorption Ionization Mass Spectrometry-based applications
During the early life of Matrix-assisted laser desorption/ionization (MALDI), it took the (bio)scientific community a while to realize the great potential of the technique over a wide range of analytical problems, from the discovery or identification of (mostly) organic (macro)molecules through to structure analysis and function. Since then, the practical use of MALDI-MS has grown almost exponentially and it is today an indispensable laboratory tool, particularly in the life sciences.
Matrix-assisted laser desorption/ionization (MALDI) is a “soft” ionization technique, which allows for the sensitive detection of large, non-volatile and labile molecules by mass spectrometry. It is fast, allowing the analysis of hundreds of samples per day. It is expensive, as almost all mass spectrometry techniques, yet it is cost-effective. Currently the tandem MS and ion different fragmentation capabilities of most MALDI systems add an extra value to this technique as it allows for structural characterization of (bio)molecules. In addition to molecular identification and characterization, MALDI is an invaluable tool to profile and classify complex samples.
In spite of its many advantages, MALDI has one achilles tendon. If the sample is not conveniently prepared, the ionization is hampered and then the analysis is not possible. This is the reason why sample treatment for MALDI analysis is a never-ending hot topic in analytical chemistry. Thus, the methods used to identify proteins do not work with polymers and vice versa. In other words, for each new molecule a sample treatment optimization is needed so an adequate, well-defined, method of analysis is obtained. For this reason this thesis focused in the development of new sample treatments for MALDI-based applications. To this end and when possible, ultrasonic energy is used as a tool to simplify the sample handling by matching the analytical minimalism concept as defined by Halls1. The molecules for which the new sample treatments were developed were
proteins, polymers and small inorganic molecules.
MALDI is the technique of preference for the analysis of polymers as with one single analysis the polymer´s typical values of number-average molecular weight, Mn,
1 D. J. Halls, “Analytical minimalism applied to the determination of trace elements by atomic spectrometry. Invited lecture,” J. Anal. At. Spectrom, vol. 10, pp. 169–175, 1995.
and weight-average molecular weight, Mw, can be obtained. A detailed characterization of these materials is important to relate their chemical structure and composition to their functions. In this work a rapid sample treatment based on ultrasonic energy for the characterization of polymers was developed. Thus, a number of variables affect the efficiency of the ultrasonic energy and thus they were investigated over different polymers to study their influence in the Mn and Mw values. Different ultrasonic devices including ultrasonic bath with dual frequency, sonoreactor and ultrasonic probe were used. The selected variables were (i) Utrasonic frequency (35 kHz, 40 kHz and 130 kHz), (ii) ultrasonic amplitude and (iii) time of ultrasonication. This study was done over three standard polymers: poly(styrene) 2000 Da and 10,000 Da and poly(ethylene glycol) 1000 Da. Furthermore, two common standard matrices, dithranol and 2,5-dihydroxybenzoic acid were used throughout the study. The results obtained show that the ultrasonic bath at 35 kHz is the best option for the purpose of fast sample treatment for polymer characterization. The Mn and Mw values obtained for this ultrasonic device and for the three polymers tested using dithranol as MALDI matrix, were not statistically different from the ones acquired with vortex mixing and also were in concordance with the values recommended by the polymer manufacturers.
and spectroscopic studies of two new schiff-base bithienyl pendant-armed 15-crown-5 molecular probes.
Complex proteomes are deciphered using gel- or off-gel based protocols. In this work an ultrasonic multiprobe was assayed as a tool to develop a fast method to identify proteins from complex proteomes. The optimization is done using a pool of standard proteins and complex proteome derived from D. Desulfuricansa and Cyprinus carpio. Proteins are first separated from complex proteomes using gel electrophoresis. The gel spots containing the protein(s) are then excised, washed and submitted to the action of the enzyme trypsin, that cleaves the protein in small peptides. The pool of peptides obtained is used to identify the protein using peptide mass fingerprint. When compared to the traditional method, the use of the ultrasonic multiprobe allows the following features: (i) the number of steps and the handling is greatly reduced; (ii) the total time since the spot is excised till the protein is ready to be identified is reduced from twelve hours to eight minutes and (iii) the risk of contamination is greatly reduced.
A espectrometria de massa com ionização e dessorção a laser assistida por matriz (MALDI-TOF MS) é uma tecnologia extremamente poderosa e amplamente usada na análise de macromoléculas, embora não limitada a estas, por se tratar de uma técnica com inúmeras vantagens na obtenção de um espectro de massa: é rápida, de elevada sensibilidade e seletividade. Apesar destas vantagens, uma das principais limitações da técnica prende-se com a preparação da amostra que necessita de um tratamento especifico prévio à análise. Neste sentido, o trabalho desta tese pretende contribuir para o desenvolvimento de novos tratamentos de amostra, mais simples e eficientes. Foram escolhidos três tipos de analises, (i) identificação de proteínas por Peptide Mass Fingerprint (PMF), (ii) caracterização de polímeros e (iii) caracterização de moléculas pequenas.
No tratamento de amostras para a caracterização de polímeros foram testados diversos dispositivos ultrassónicos. Foram explorados os efeitos das seguintes variáveis sobre a distribuição dos pesos moleculares: (i) frequência de ultrassons, (ii) amplitude de ultrassons, e (iii) tempo de sonicação. Procedeu-se à avaliação do efeito destas variáveis em três polímeros padrão, recorrendo a duas matrizes MALDI. Os resultados obtidos demonstram que o banho de ultrassons a 35 kHz é a melhor opção para o tratamento célere das amostras. Os valores de Mn e Mw obtidos para este dispositivo de ultrassons e para os três polímeros testados usando ditranol como matriz, não foram estatisticamente diferentes dos adquiridos com a metodologia padrão de agitação com vortex.
No âmbito das moléculas pequenas, a tecnologia MALDI-TOF MS foi empregue no estudo de novas moléculas orgânicas com absorção no ultravioleta, verificando-se a sua capacidade de sensor, em fase gasosa, relativamente a catiões tais como Cu2+, Zn2+ e Al3+, e a aniões como F- e CN- , comportando-se de forma estável nas condições da análise MALDI-TOF MS.
permite (i) diminuir o número de etapas do tratamento e a manipulação da amostra, (ii) diminuir os tempos necessários para completar o tratamento, (iii) diminuir o riscos de contaminação. O tratamento completo desde que a proteína é separada no gel até à sua identificação é realizado em poucos minutos comparado com o método clássico. Foi ainda usado o método de marcação isotópica com 18O para estudar o tipo de péptidos extraídos dos géis, assim como a eficiência da extração. A otimização da metodologia foi feita com recurso a proteínas padrão, sendo que proteínas separadas por eletroforese em gel, a partir de extratos de D. desulfuricans, e de Cyprinus carpio, foram utilizadas como “proof of concept”.
ACKNOWLEDGEMENTS ... ix
ABSTRACT ... xiii
RESUMO ... xvii
INDEX ... xix
LIST OF FIGURES ... xxiii
LIST OF TABLES ... xxvii
LIST OF SYMBOLS AND ABBREVIATIONS ... xxix
CHAPTER I. INTRODUCTION ... 1
I.1 MASS SPECTROMETRY WITH MATRIX-ASSISTED LASER DESORPTION IONIZATION ACCOMPLISHED TO TIME OF FLIGHT ANALYSERS. ... 3
I.1.1 BASICS ON MASS SPECTROMETRY APPROACHES ... 3
I.1.2 MATRIX ASSISTED LASER DESORPTION IONIZATION ... 4
I.1.2.1 THE MALDI CONCEPT ... 4
I.1.2.2 THE MATRIX ... 5
I.1.2.3 LASERS FOR MALDI ... 7
I.1.2.4 THE IONIZATION PROCESS ... 7
I.1.2.5 THE FRAGMENTATION PROCESS ... 8
I.1.2.6 MASS ANALYSERS: TOF MASS SPECTROMETER ... 9
I.1.2.6.1 LINEAR TOF MASS SPECTROMETER ... 9
I.1.2.6.2 REFLECTRON TOF MASS SPECTROMETER ... 9
I.1.2.6.3 TANDEM TOF MASS SPECTROMETER ... 10
I.2 MALDI-MS FOR PROTEOMICS ... 11
I.2.1 BASICS ON MALDI-MS FOR PROTEOMICS ... 11
I.2.2 PEPTIDE MASS FINGERPRINTING ... 12
I.2.2.1 SAMPLE TREATMENT FOR PROTEIN IDENTIFICATION THROUGH PMF ... 15
I.2.3 CLASSIC PROTOCOLS ... 16
I.2.3.1 IN-GEL PROTEIN DIGESTION ... 16
I.2.3.2 IN-SOLUTION PROTEIN DIGESTION ... 19
I.2.3.3 IN-COLUMN PROTEIN DIGESTION ... 20
I.2.4 ACCELERATED PROTOCOLS ... 21
I.2.4.1 BASICS ON ULTRASONICS ... 22
I.2.4.2 THE USE ULTRASONIC ENERGY TO PROTEOMICS ... 27
I.3 MALDI-MS FOR POLYMER CHARACTERIZATION ... 28
I.3.1 BASICS ON POLYMER CHARACTERIZATION USING MALDI-MS ... 28
I.4.1 INTRODUCTION ... 32
I.4.2 TYPE OF MATRICES FOR SMALL MOLECULE ANALYSIS USING MALDI-MS ... 32
I.4.3 SAMPLE TREATMENT FOR SMALL MOLECULE ANALYSIS USING MALDI-MS ... 33
I.4.2 THE DERIVATIZATION OF THE MATRIX: TOWARDS NEW ACTIVE MATRICES. ... 34
I.5 BIBLIOGRAPHY ... 35
CHAPTER II. OBJECTIVES, WORKING PLAN AND THESIS OUTPUT ... 45
II.1 OBJECTIVES ... 47
II.2 WORKING PLAN ... 48
II.3 THESIS OUTPUT ... 49
II. 3.1 PAPERS PUBLISHED IN INTERNATIONAL SCIENTIFIC JOURNALS ... 49
II. 3.2 PARTICIPATION IN NATIONAL AND INTERNATIONAL CONFERENCES ... 50
CHAPTER III. ULTRASONIC ENERGY AS A TOOL IN THE SAMPLE TREATMENT FOR POLYMERS CHARACTERIZATION THROUGH MATRIX-ASSISTED LASER DESORPTION IONIZATION TIME-OF-FLIGHT MASS SPECTROMETRY ... 51
III.1 ABSTRACT ... 53
III.2 INTRODUCTION ... 54
III.3 EXPERIMENTAL ... 57
III.3.1 CHEMICALS, SOLVENTS, DISPOSABLES AND APPARATUS ... 57
III.3.2 SAMPLE PREPARATION ... 58
III.3.3 MALDI ANALYSIS ... 59
III.3.4 DATA ANALYSIS METHODS ... 60
III.4 RESULTS AND DISCUSSION ... 60
III.4.1 POLY(STYRENE), PS, 2000DA ... 60
III.4.1.1 MALDI SPECTRA ... 60
III.4.1.2 POLYMER CHARACTERIZATION ... 62
III.4.2 POLY(STYRENE), 10,000DA ... 64
III.4.2.1 MALDI SPECTRA ... 64
III.4.2.2 POLYMER CHARACTERIZATION ... 64
III.4.3 POLY(ETHYLENE GLYCOL), PEG, 1000DA ... 64
III.4.3.1 MALDI SPECTRA ... 64
III.4.3.2 POLYMER CHARACTERIZATION ... 66
III.5 CONCLUSIONS ... 68
III.6 ACKNOWLEDGMENTS ... 69
III.7 REFERENCES ... 70
IV.2 INTRODUCTION AND DISCUSSION ... 74
IV.3 ACKNOWLEDGMENTS ... 85
IV.4 APPENDIX A. SUPPLEMENTARY MATERIAL ... 85
IV.5 REFERENCES ... 86
CHAPTER V. SYNTHESIS, CHARACTERIZATION AND FLUORESCENCE BEHAVIOR OF FOUR NOVEL MACROCYCLIC EMISSIVE LIGANDS CONTAINING A FLEXIBLE 8-HYDROXY-QUINOLINE UNIT ... 93
V.1 ABSTRACT ... 95
V.2 INTRODUCTION ... 96
V.3 RESULTS AND DISCUSSION ... 100
V.3.1 SYNTHESIS AND CHARACTERIZATION OF THE FREE LIGANDS L1-L4 AND METAL COMPLEXES ... 100
V.3.1.1 SCHIFF-BASE MACROCYCLES L1 AND L3 ... 100
V.3.1.2 SYNTHESIS AND CHARACTERIZATION OF THE AMINE MACROCYCLES L2 AND L4101 V.3.1.3 SYNTHESIS AND CHARACTERIZATION OF THE METAL COMPLEXES ... 102
V.3.2 SPECTROPHOTOMETRIC AND SPECTROMETRIC STUDIES ... 103
V.3.2.1 SPECTROPHOTOMETRIC STUDIES: UV-VIS AND FLUORESCENCE EMISSION SPECTROSCOPY ... 103
V.3.2.2 SPECTROMETRIC STUDIES BY MALDI-TOF-MS SPECTROMETRY ... 109
V.4 CONCLUSIONS ... 112
V.5 EXPERIMENTAL ... 113
V.5.1 GENERAL ... 113
V.5.2 CHEMICALS AND STARTING MATERIAL ... 114
V.5.3 SYNTHESIS ... 114
V.5.3.1 SYNTHESIS OF 2,2-(1,3-PHENYLENEBIS(METHYLENEOXY))-DIBENZALDEHYDE .. 114
V.5.3.2 TEMPLATE SYNTHESIS OF THE MACROCYCLIC LIGAND L` ... 115
V.5.3.3 SYNTHESIS OF THE IMINE MACROCYCLIC LIGANDS L1 AND L3: GENERAL METHOD ... 116
V.5.3.4 SYNTHESIS OF THE AMINE MACROCYCLIC LIGANDS L1 AND L4: GENERAL METHOD ... 117
V.5.3.5 GENERAL PROCEDURE FOR METAL COMPLEXES WITH LIGANDS L1 AND L3 ... 118
V.5.3.6 GENERAL PROCEDURE FOR COMPLEXES WITH THE AMINE MACROCYCLES L2 AND L4 ... 118
V.6 ACKNOWLEDGMENTS ... 120
V.7 REFERENCES AND NOTES ... 121
CHAPTER VI. ULTRASONIC ENHANCED APPLICATIONS IN PROTEOMICS WORKFLOWS: SINGLE PROBE VERSUS MULTIPROBE ... 127
VI.1 ABSTRACT ... 129
VI.2 INTRODUCTION ... 130
VI.3.1 APPARATUS ... 130 VI.3.2 ULTRASONIC DEVICES ... 131 VI.3.3 STANDARDS AND REAGENTS ... 131 VI.3.4 SAMPLE TREATMENT ... 132 VI.3.4.1 PROTEIN SEPARATION BY 1D-SDS-PAGE ... 132 VI.3.4.2 IN-GEL SAMPLE TREATMENTS ... 132 VI.3.5 CASE STUDIES ... 133 VI.3.5.1 DESULFOVIBRIO DESULFURICANS ATCC27774 ... 133 VI.3.5.2 PLASMATIC VITELLOGENIN FROM CYPRINUS CARPIO ... 134 VI.3.6 INVERSE 18O LABELING OF PEPTIDES ... 134 VI.3.7 MALDI-TOF MS ANALYSIS ... 135 VI.4 RESULTS AND DISCUSSION ... 136 VI.4.1 96 WELL PLATE METHOD FOR PROTEINS SEPARATED BY GEL
ELECTROPHORESIS ... 136 VI.4.2 EFFECT OF ULTRASONICATION IN THE RELEASE OF PEPTIDES FROM GELS . 139 VI.5 FUTURE PROSPECTS ... 141 VI.6 CONCLUSIONS AND PERSPECTIVES ... 141 VI.7 ACKNOWLEDGMENTS ... 142 VI.8 REFERENCES ... 143
Fig. I.1 – The principle components of a MALDI time-of-flight mass spectrometry consisting of the ionization source followed by the mass analyser and detector. A computer is used to generate a spectrum with the data provided by the detector………...4 Fig. I.2 – Schematic representation of the linear time-of-flight mass analyser.. ….………...……..9 Fig. I.3 – Schematic representation of the reflectron time-of-flight mass analyser. …………...10 Fig. I.4 – Schematic representation of the tandem time-of-flight mass analyser.. ………...10 Fig. I.5 – MALDI spectrum of a proteins mixture. ………...….11 Fig. I.6 – Principle of protein identification by MALDI mass spectrometry-based peptide mass
fingerprint. The experimentally determined MALDI-MS peptide mass map is compared to the “in-silico” (theoretical) peptide mass map of all proteins included in a biological database using computer-based search algorithms. A scoring scheme is used to retrieve the best match. Protocol A corresponds to the classical protein analysis, in which proteins are initially separated according to their isoelectric point and then according to their molecular weight. Protocol B corresponds to the typical gel-free approach, in which proteins are digested prior to any separation step and then the whole peptide pool is separated using multi-dimensional chromatography in tandem with mass spectrometry. Protocol C represents the new trends in protein digestion using immobilized trypsin. Firstly, proteins can be separated using different chromatography steps, and are then digested in-column, and, finally, the peptide pool is separated and analysed. (Adapted with permission from reference [24])………..13 Fig. I.7– Detailed description of an in-gel protein digestion protocol. (Figure reproduced with
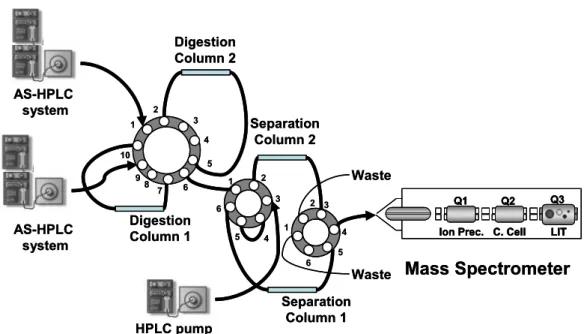
permission from reference [24])...………. …….17 Fig. I.8 – An on-line protein digestion system. comprising three HPLC pumps (two gradient and
one isocratic), three switching valves, and four columns (two used for protein digestion and two other for peptide separation). The whole system is connected on line to a mass spectrometer. To increase throughput of the analysis, each gradient HPLC pump is connected to one digestion column and one separation column through switching valves. These are synchronized to separate (separation-column 1) the digested peptides coming from digestion-column A using one of the gradient HPLC systems. In the meantime, the second gradient system delivers a protein mixture to digestion-column B, while separation-column 2 is being conditioned with the solvent delivered by the isocratic pump (Figure reproduced with permission from reference [24]...21 Fig. I.9 – Sound frequency ranges. (from Mason et al. [61]).…...………..………...…….22 Fig. I.10 – Development and collapse of cavitation bubbles. (from Mason et al. [61])..………...23 Fig. I.11 – Disruption effect of ultrasound in solid material. Different beads (200mg) were suspended in 1mL of Milli-Q water and ultrasonicated for 2min with an ultrasonic probe at different ultrasonic amplitudes. The microscopic pictures were taken with a magnification of 100 × and the scale corresponds to 200 mm. (A) silica particles; (B)
disrupted particles; 3, aggregated particles (Figure reproduced with permission from reference [66])...………..…...24 Fig. I.12 – This figure shows the new ultrasonic multiprobe coupled to the 96-well plate (Figure reproduced with permission from reference [67]).……...………...25 Fig. I.13 –Advances on ultrasonic probe technology: (a) silica glass probe; (b) spiral probe; (c)
dual probe; (d) multi probe; (e) cup horns; (f) sonoreactor; (g) microplate horns. (a–d) are reproduced with permission of BandelinCompany; (e) and (g) are reproduced with permission of MisonixCompany; (e) is reproduced with permission of dr. Hielscher Company (Figure reproduced with permission from reference [70]). ………...……..26 Fig. III.1 – MALDI mass spectra in dithranol matrix with sample treatment done with the ultrasonic bath at 35 kHz sonication frequency of poly(styrene) standard 2000 Da (A); poly(styrene) standard 10,000 Da (B) and poly(ethylene glycol) standard 1000 Da (C). …………...61 Fig. III.2– Statistical analysis of means at 95% confidence level for the Mn and Mw values obtained for the poly(styrene) standard 2000 Da in DHB. LSD intervals display the least significant difference intervals for the two-factor interactions………..………..63 Fig. III.3 – Statistical analysis of means at 95% confidence level for the Mn and Mw values obtained for the poly(ethylene glycol) standard 1000 Da in dithranol (A and B) and DHB.………...……….………...….65 Fig. IV.1 – ChemDraw reaction-pathway of compound L and its complexes.………...76 Fig. IV.2 –Spectrophometric (A) and spectrofluorimetric (B) titrations of ligand L in DMSO as a function of increasing amounts of Cu(CF3SO3)2. The insets show the absorption at 445 and 472 nm, and the normalized fluorescence intensity at 506 nm. [L] = 1.00E-5M ; λexc= 445nm………...77 Fig. IV.3 –Spectrophometric (A) and (C) and spectrofluorimetric (B) and (D) titrations of ligand L in DMSO as a function of added (Bu4N)F and (Bu4N)CN respectively. The insets show the absorption at 275 and 377 nm for fluoride and at 470 and 520 nm for cyanide additions; and the normalized fluorescence intensity at 504 nm (F-) and at 506 nm (CN-) [L] = 1.00E-5M ;λexc= 445nm.. ………...…78 Fig. IV.4 –MALDI-TOF mass spectra of ligand L in positive (A) and negative (B) modes in
acetone. Panel C shows the spectrum (positive mode) after titration with Cu(CF3SO3)2 (one equivalent of metal). Panel D shows the spectrum (negative mode) after the addition of ten equivalents of (Bu4N)CN solution.. ………...82 Fig. IV.5 –ISOTOP model for the peak at 660.09 m/z observed in the MALDI-TOF mass spectrum of ligand L upon addition of one equivalent of Cu(II); the peak can be attributed to the [LCu]+ complex……….………...…..83 Fig. IV.6 –Ball-and-stick representation of the structure of the free ligand (L) and its copper(II)
Fig. V.1 –Macrocyclic ligands with quinoline pendeant arms reported for Pb2+ (I, II, II, VII), Co2+(I), Ni2+(I), Cu2+(I, II), Zn2+(I, II, III, V, VII), Cd2+(I, II, III,VII), Hg2+(VI), K+(IV.b), Mg2+(VI.a), and Ba2+(IV)...……….……...97 Fig. V.2 –Schematic synthetic route for ligands L1-L4 in absolute ethanol...99 Fig. V.3 –Ligands L1-L4 with numbered atoms...102 Fig. V.4 –Absorption, emission, and excitation spectra of ligand L2 in absolute ethanol solution
([L2]=1.0×10⁻⁵ M, λexc=400nm, λem=530nm)...104
Fig. V.5 –Absorption (A and C) and fluorescence emission (B and D) titration of absolute ethanol solution of L2 as a function of increasing amounts of Zn2+ (A and B) or Cd2+ (C and D) ions. The inset shows the absorption at 248 and 270 nm, and the normalized fluorescence intensity at 555 nm ([L2]=1.00×10⁻⁵ M, λexc=400nm)………...107
Fig. V.6 –Absorption (A) and fluorescence emission (B) titrations of absolute ethanol solution of L2 as a function of increasing amounts of Cu2+ ions. The inset shows the absorption at 249 and 257 nm, and the normalized fluorescence intensity at 555 nm. ([L2] = 1.00xE-5 M, λexc = 400 nm )...108 Fig. V.7 –(A) MALDI-TOF-MS spectra of L2 using dithranol as MALDI matrix, (B) in the presence of 1 equiv of Zn(II), and (C) in the presence of 2 equiv. of Zn(II)...110 Fig. V.8 –MALDI-TOF-MS fragmentation peak observed for L2 and L2Zn(II) complex...111 Fig. VI.1 –Number of peptides matched and sequence coverage for BSA and α-lactalbumin as a
function of time, amplitude and frequency of sonication. Proteins were separated by Gel electrophoresis. Peptides matched and sequence coverage for the overnight method was 42±6 and 70±4 respectively for BSA and 11±2 and 51±1 for α-lactalbumin…...137
Table I.1 – Exemple of common matrices used in MALDI-MS. (Reproduces from references [2], [3]) ………..……….6 Table I.2 – Types of Ions in LDI and MALDI-MS. (Reproduces from [1])…………..……...…..7 Table I.3 – Computational services and tools for protein mass spectrometry. (Adapted from [3])…...………...……14 Table I.4 – Analytical parameters for enzymatic protein digestion. (Reproduced with permission
from reference [24].………...……….…16
Table III.1 –Mn and Mw values ± standard deviations of the three polymers in dithranol and DHB matrices for each one of the seven sample treatments tested. ………...62 Table V.1 – 1H NMR shifts (ppm) for L1, L2, L3, and L4 in CD3Cl solutions (see Figure V.3 for labeling). ……..………...………...101 Table V.2 – Optical data for the metal complexes of L1, L2, L3 and L4 in absolute solutions
(λexc=400nm; 25ºC)………..………...……...….105
Table VI.1 –Number of peptides matched and protein sequence coverage for in gel-protein digestion by the overnight method and accelerated method.………...……..138 Table VI.2 –Comparison of handling and time consumed for the five methods studied with the 96 well plate ultrasonic method …………...………...…….138 Table VI.3 –Results from the BSA 18O-inverse labeling experiments. All peptides were manually (n=2). ………...…………...138
Symbols
A Absorbance
λem Emission wavelength!
λ
exc Excitation wavelength
λ
max Wavelength of maximum emission or absorption!
m/z Mass-to-charge ratio
Abbreviations
ACN Acetonitrile
A&D Aspirate and dispense
AgTFA Silver trifluoroacetate
ALSs Acid-labile surfactants
AmBic Ammonium Bicarbonate
ATT 6-Aza-2-thiothymine
CDCl3 Deuterated Chloroform
α-CHCA α- Cyano-4-hydroxycinnamic acid (matrix for MALDI-MS)
CHEF Chelation Enhanced Fluorescence
CID Collision induced dissociation
DFT Density funcional theory
2-DE Two dimensional electrophoresis
1D-PAGE One-dimensional polyacrylamide gel electrophoresis 2D-PAGE Two-dimensional polyacrylamide gel electrophoresis
D&I Direct and Inverse
DHB 2,5-Dihydroxibenzoic acid (matrix for MALDI-MS)
DMSO Dimethyl sulfoxide
DNA Deoxyribonucleic acid
DTT DL-Dithiothreitol
EDTA Ethylenediamine tetraacetic acid
Equiv. Equivalent
ESI Electrospay ionization
ESI-MS Electrospray ionization mass spectrometry
FAB Fast atom bombardment
Fig. Figure
FD Field desorption
FT Fourier transform
GE Gel elctrophoresis
GPC Gel permeation chromatography
8-HQ 8-Hydroxyquinoline
HABA 2(4-Hydroxyphenylazo) benzoic acid (matrix for MALDI-MS)
3-HPA 3-Hydroxypicolinic acid (matrix for MALDI-MS)
HPLC High performance liquid chromatography
IAA Iodoacetamide
IEF Isoelectric focusing
IR Infrared
L Ligand
LC Liquid chromatography
LC/MS Liquid chromatography coupled to mass spectrometry
MALDI Matrix Assisted laser desorption/ionization
MALDI-TOF MS Matrix Assisted laser desorption/ionization time-of-flight mass spectrometry
MeOH Methanol
Milli-Q Ultrapure water
Mn Number-average molecular weight
MRM Multiple reaction monitoring
MS Mass spectrometry
MS/MS mass spectrometry/mass spectrometry
Mw Weight-average molecular weight
MW Molecular weight
NMR Nuclear magnetic resonance
PBS Phosphate buffer solution
PDI Polydispersity
PEG Polyethylene glycol
PET Photo-induced electron transfer
PFF Peptide fragment fingerprint
pI Isoeletric points
PMF Peptide mass fingerprint
PPT Photo-induced pronton transfer
PS Polystyrene
PSD Post-source decay
Q-TOF Quadrupole time-of-flight (mass analyzer)
QIT Quadrupole ion trap (mass analyzer)
RSD Relative Standard Deviation
SDS Sodium dodecyl sulfate
SIMS Secondary ion mass spectrometry
S/N Signal-to-noise ratio
Super-DHB 2,5-Dihydroxibenzoic acid and
2-hydroxy-5-methoxybenzoic acid(matrix for MALDI-MS)
TCA Trichloroacetic acid
TFA Trifluoroacetic acid
THAP 2,4,6-Trihydroxyacetophenone (matrix for MALDI-MS)
TDDFT Time Dependent Density Functional Theory
TOF Time-of-flight (mass analyzer)
UE Ultrasonic energy
UP Ultrasonic probe
USB Ultrasonic bath
UTR Sonoreactor
UV Ultraviolet
Chapter I
I.1 Mass Spectrometry with matrix-assisted laser desorption ionization accomplished
to time of flight analysers.
I.1.1 Basics on Mass Spectrometry approaches
The beginning of mass spectrometry can be traced back till the end of the XIX century, when Eugen Goldstein did the first experiments about canal rays in 1886. Later, in 1898, Wilhelm Wien and J. J. Thomson further developed the canal rays experiments using low pressure, being able of measuring the mass-to-charge ratio of electrons and protons [1], [2]. Currently, mass spectrometry is used to measure masses of molecules, to unravel their composition as well as for elucidating their chemical structure.
A mass spectrum is obtained from gaseous molecules or species desorbed from
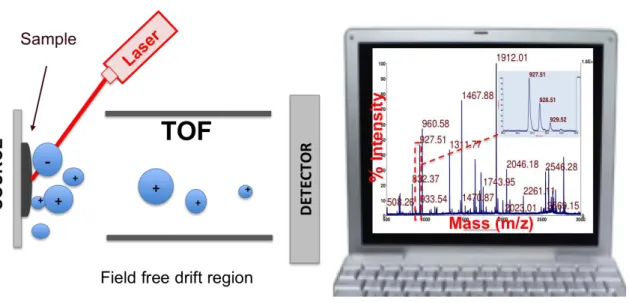
condensed phases that are first ionized, then accelerated by an electric field and finally separated according to their mass-to-charge ratio, m/z. Figure I.1 shows a matrix assisted laser desorption ionization, MALDI, mass spectrum of an enzymatic digest of BSA protein along with a comprehensive scheme of the working of a MALDI mass spectrometer. As a general role a mass spectrometer is build with three main components: an ion source, to convert in ions the molecules of the sample; a mass analyser, which separates the ions according to their mass-to-charge ratio using electromagnetic fields; and a detector, which transforms the current of ions in a measurable signal. Figure I.1 identifies those components for the case of a MALDI-TOF mass spectrometer, the most common interfaces is between a MALDI source and a time-of-flight (TOF) mass analyser.
The most intense peak in the spectrum (see Fig. I.1) is called the base peak and the intensities of other peaks are expressed as a percentage of the base peak intensity.
isotopic distributions can be an additional headache for data interpretation, making data interpretation difficult [3].
Figure I.1 The principle components of a MALDI time-of-flight mass spectrometry consisting of the ionization source followed by the mass analyser and detector. A computer is used to generate a
spectrum with the data provided by the detector.
I.1.2 Matrix assisted laser desorption ionization.
I.1.2.1 The MALDI concept
It was believed during long time that molecules with large masses, e.g. 1000 Da,
In brief, the sample containing the analyte of interest is mixed with a large excess of a small chemical compound, generally known as matrix. The matrix helps in the ionization of the sample favouring the absorption of the laser as well as promoting the protonation of the molecules of interest. Once into the apparatus, the sample is irradiated with a laser, which transfers energy to form a plume of molecules, which is transferred to a mass analyser, where the molecules are separated as a function of their mass-to-charge ratio. Finally, the molecules reach the detector, promoting a signal that is recorded and transformed in the characteristic mass spectrum [3], [7].
I.1.2.2 The Matrix
Table 1.1 Exemple of common matrices used in MALDI-MS. (Reproduces from references [2], [3])
Matrix Structure λ (nm) Application
3-Amino-4-hydroxybenzoic acid 337 Oligosaccharides
2,5-Dihydroxibenzoic acid
(DHB) 337, 353
Proteins, peptides, carbohydrates, synthetic polymers
5-Hydroxy-2-methoxybenzoic acid 266, 337,
355 Lipids, Proteins, 2(4-Hydroxyphenylazo)benzoic acid
(HABA) 266, 337 Proteins, lipids
Cinnamic Acid 337 General
4-Methoxycinnamic acid 337 Proteins
Ferlulic acid 337, 266,
355 Proteins
Sinapinic acid 266, 337,
353, 355 Proteins, peptides,
α- Cyano-4-hydroxycinnamic acid (CHCA)
337, 353,
355 Peptides fragmentation
6,7-Dihydroxycoumarin 337 Lipids, peptides
3-Hydroxypicolinic acid (3-HPA) 337, 353, 355 Oligonucleotides, Synthetic polymers
Nicitinic acid 266 Proteins, peptides, adduct
formation
Picolinic acid 266 Oligonucleotides
3- Aminopicolinic acid 337, 355 Oligonucleotides
6-Aza-2-thiothymine 337, 353
Proteins, peptides, non- covalent complexes; near-neutral pH
2,6-Dihydroxyacetophenone 337, 353
Proteins, peptides, non- covalent complexes, Oligonucleotides
2,4,6-Trihydroxyacetophenone 337, 353
Proteins, peptides, non- covalent complexes, Oligonucleotides
3-Aminoquinoline 337 Oligosaccharides
1,5-Diaminonaphthalene 337 Lipids
Trans-3-indoleacrylic acid
(IAA) 337 Synthetic polymers
Dithranol 337 Synthetic polymers,
Lipids, small molecules
COOH NH2 HO OH HO COOH OCH3 HO COOH N N OH COOH H C C H COOH H C C H COOH
H3CO
H C C H COOH HO OCH3 HO H C C H COOH O O HO H C C COOH CN O HO HO O N OH COOH N COOH N COOH N COOH NH2 N N N H3C
SH OH C O OH OH C O OH OH HO N OH NH2 NH2 N OH O
I.1.2.3 Lasers for MALDI
The two main types of laser used in MALDI are based on infrared, IR, or ultraviolet, UV, wavelength [1], [10]. The absorption coefficient of common IR-matrices, such as glycerol, are high enough to guarantee a penetration depth of the laser beam of about 1 µm, more than 20-fold than a typical penetration achieved with an UV laser. As consequence, the mass of sample ablated for the same exposure time is 10 times higher for an IR laser than for an UV laser, being the sample consumption proportionally higher in IR-ablation as well [3].
I.1.2.4 The ionization process
The ionization process takes place after laser has ablated the surface of the matrix-analyte sample. However, it seems that the majority of the material that becomes part of the plume of molecules is present in neutral form. The ablation process itself is not well understood yet, although some interesting works have been done to this end. Such works suggest that ions are formed only within the first 300 ns after laser interaction with the material [11], [12]. However, the mechanism involved in the ion formation are even less understood that the laser ablation itself. Currently, two models are found in literature explaining the ionization process. The first model assumes two main steps for ion formation: (i) neutral analyte molecules and photoionization of the matrix molecules and (ii) charge transfer to the analyte molecules in the plume [13]. The second model assumes analytes as charges species within the matrix which becomes mostly neutralized during the ablation process due to interactions with the matrix [14].
Table I.2 Types of Ions in LDI and MALDI-MS. (Reproduced from reference [1])
Analytes Positive Ions Negative Ions
Non-polar M+ M−
Medium polarity M+ and/or [M+H]+
, [M+alkali]+ ,
{clusters[2M]+ and/or [2M+H]+ ,
[2M+alkali]+
, adducts[M+Ma+H]+ ,
[M+Ma+alkali]+}b
M− and/or [M-H]−,
{clusters[2M]− and/or [2M-H]−,
adducts[M+Ma]−, [M+Ma-H]−}
Polar [M+H]+
, [M+alkali]+ , Exchange[M-Hn+alkalin+1]
+ , High-mass anal.[M+2H]2+
, [M+2alkali]2+ ,
{clusters[nM+H]+ ,
[nM+alkali]+
, adducts[M+Ma+H]+ ,
[M+Ma+alkali]+}
[M-H]−,
Exchange[M-Hn+alkalin-1]−,
{clusters[nM-H]−,
adducts[M+Ma-H]−}
Ionica
C+, [C n+An-1]
+,{[CA]+} A−,[C
n-1+An]−,{[CA]−
}
a
Comprising of catión C+
and anion A−. b
I.1.2.5 The Fragmentation process
The fragmentation process depends on many different variables, such as laser fluence and focus, ion extraction field strength and delay, as well as the choice of an adequate matrix [15]. Matrixes favouring high degree of fragmentation are classified as hard whilst matrixes that do not promote fragmentation are called “soft”. For instance α -cyano-4-hydroxycinnamic, the matrix of choice for peptide mass fingerprint, is one of the hardest matrices used whilst “super DHB” is one of the softest matrices, used for the measured of intact proteins [7].
Three different process account for fragmentation. First, ions absorb energy from
the laser. Laser´s energy promotes collisions with the matrix molecules. Second, the electric field in the source will accelerate the ions make them crash within them and against other molecules present in the plume [7]. In addition to this processes, the plume is a very reactive medium where hydrogen and proton transfers between molecules takes place. All this factors contribute to the breaking of many molecules. Thus phosphor- or sulfo- peptides or glycolipids get dissociated before or during detection [3].
Tandem mass spectrometry is the process of selecting an ion, causing it to fragment and recording a mass spectrum of the fragments ions. Fragment ions carry information about the ion structure. One ion can be selected and isolated and then fragmented n times [1]–[3], [7], [16]. Through this method the amino acid sequence of one peptide can be elucidated.
fragmentation is rather complex. The recent availability of MALDI sources for analyzers such as the Q-TOF, TOF/TOF, FT and QIT, enable far more efficient production and detection of product ions than is possible with PSD [3], [7].
I.1.2.6 Mass analysers: TOF mass spectrometer
I.1.2.6.1 Linear TOF mass spectrometer
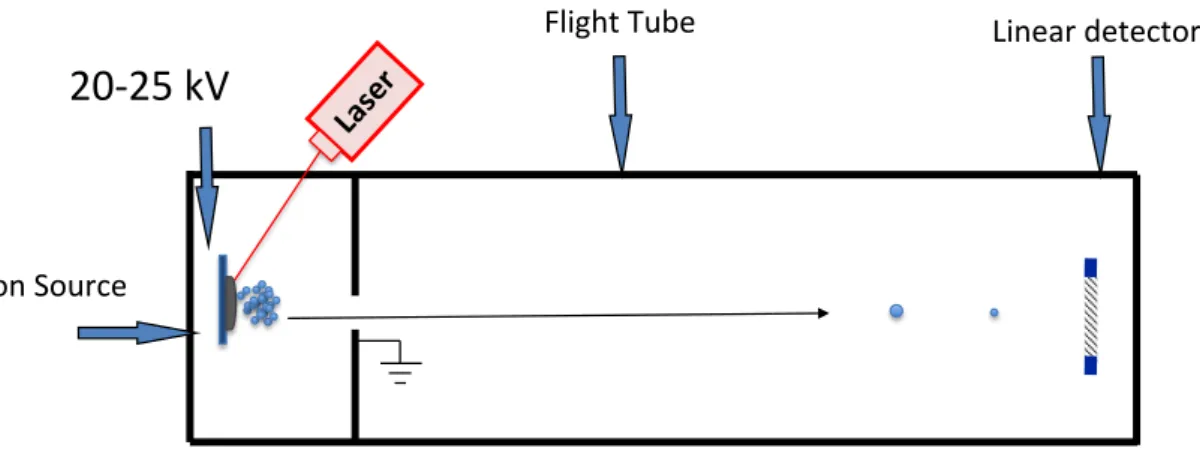
Figure I.2 shows a typical linear TOF mass spectrometer. In this type of instruments all charged ions are first accelerated by a potential difference, between the sample support and a nearby grid. This accelerated the ions, which then travel down a field free path of variable length, generally 1m. This TOF render mass resolutions below
20 000.
Figure I.2. Schematic representation of the linear time-of-flight mass analyser
.
I.1.2.6.2 Reflectron TOF mass spectrometer
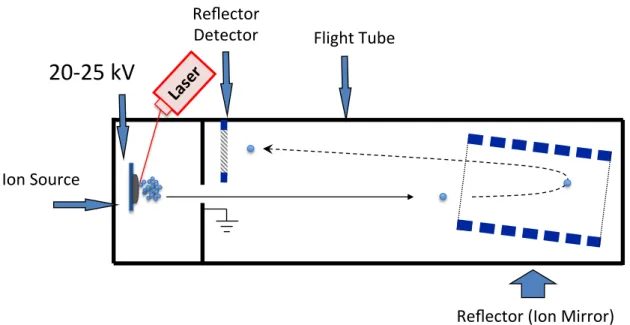
Figure I.3 shows a typical reflecton TOF Mass spectrometer. In this type of instruments the travel path distance is increased by using one reflector, also known as ion mirror, that reflects the ions from the first field free drift region to the second field free
drift region. In addition, the reflector also compensates differences in ion travel energies, making the same m/z ions travel to more similar speeds. This type of TOF render mass resolutions higher than 20 000 and mass accuracy of 2-5 ppm [3].
Ion$Source$
20,25$kV$
Flight$Tube$
Lase r$
Figure I.3 Schematic representation of the reflectron time-of-flight mass analyser.
I.1.2.6.3 Tandem TOF mass spectrometer
Figure I.4 shows a typical tandem TOF mass spectrometry. Tandem procedure requires the selection of an ion, called precursor ion, fragmenting it, and the recording of the signal of all fragments in a single spectrum. This type of analysis reveals structural information. Fragmentation, for instance, allows knowing the sequence of a peptide, it allows determination of sites of deamidation, phosphorylation or sequence variation from mutation of the peptide´s parent DNA [3], [7].
Flight'Tube'
Ion'Source'
20425'kV'
Lase r'
Reflector' Detector'
Reflector'(Ion'Mirror)'
Ion$Source$
20,25$kV$
Lase r$
Reflector$ Detector$
Reflector$(Ion$Mirror)$
+$ +$ +$
+
+$
+$ + +$
Collision$Cell$
First$field$free$dri@$region$
I.2 MALDI-MS for proteomics
I.2.1 Basics on MALDI-MS for proteomics
MALDI-MS is a helpful tool in all type of studies involving proteins, from individual proteins to the analysis of large complex proteomes. It must be mind that proteins constitute the elemental block of the living organisms. Proteins are involved in all living processes and can be linked to diseases as well as to genetic mutations. Therefore the analysis of proteins using MALDI mass spectrometry is nowadays an important tool in many different fields of knowledge, such as biology, biomedicine or biotechnology.
Proteins can be studied using MALDI in three different ways. Intact proteins are
studied using linear MALDI-TOF. Depending on the mass of the protein, the actual one may be obtained within and error of some Da. Figure I.5 shows a MALDI spectrum of a mixture of proteins. It may be noted that as the mass of the protein increases so it does the error in the mass determination.
Figure I.5 MALDI spectrum of a proteins mixture.
The identification of a protein, and therefore its sequence, can be obtained using two different strategies. The first strategy entails the purification and isolation of the proteins by gel electrophoresis or by HPLC, and its subsequent digestion using one enzyme, generally trypsin. The digested protein is summited to MALDI-MS and one spectrum with a number of peptides is obtained. This spectrum is introduced in a searching engine (Generally MASCOT), which matches the experimental spectrum against a large database of millions of sequences of proteins “in silico” derived from genetical data. If the protein we are interested in is in the database, and the spectrum has enough quality, the protein and its sequence is retrieved. This methodology is known as
peptide mass fingerprint, PMF. The second strategy uses tandem mass spectrometry over a peptide belonging to the protein, which is being identified. The peptide is sequenced by tandem mass spectrometry. The sequence of amino acids is introduced in the search engine (again, MASCOT) and then is matched against billions of sequences of peptides. Finally, the peptide is linked to one protein. This method is also called peptide fragment fingerprint, PFF or protein identification by MS/MS [3], [7], [22]–[24].
1.2.2 Peptide mass fingerprinting
Figure I.6 Principle of protein identification by MALDI mass spectrometry-based peptide mass fingerprint. The experimentally determined MALDI-MS peptide mass map is compared to the
“in-silico” (theoretical) peptide mass map of all proteins included in a biological database using
computer-based search algorithms. A scoring scheme is used to retrieve the best match. Protocol
A corresponds to the classical protein analysis, in which proteins are initially separated according
to their isoelectric point and then according to their molecular weight. Protocol B corresponds to
the typical gel-free approach, in which proteins are digested prior to any separation step and then
the whole peptide pool is separated using multi-dimensional chromatography in tandem with mass
spectrometry. Protocol C represents the new trends in protein digestion using immobilized trypsin.
Firstly, proteins can be separated using different chromatography steps, and are then digested
in-column, and, finally, the peptide pool is separated and analysed. (Adapted with permission from
reference [24])
Protocol B Protocol C
Complex peptide pool Protocol A Protein denaturation 1D or 2D-SDS-PAGE protein separation Spot excision Enzyme digestion (4-12 hours, 37 ºC)
Stop hydrolisis (acid addition) Peptide Pool Isolated Proteins Protein precipitation Protein denaturation
Reduction & alkylation Steps
Enzyme digestion (4-12 hours, 37 ºC)
Stop hydrolisis (acid addition) 2D-HPLC peptide separation HPLC protein separation Isolated Proteins Pass throught inmobilized trypsin cartridges Peptide Pool HPLC peptide separation Mass Spectrometry Analysis Protein Cell Extract
Cell lysis Database of
Known Sequences
….LVCDYHL
The ionization process is different for each peptide and this is reflected in the ionization efficiencies [7], which may vary over several orders of magnitude. For this reason, some peptides can be not detected in the spectrum [3]. The causes for those differences in the ionization efficiency are not well understood yet and they need to be elucidated. As an example, arginine containing peptides ionize very well as compared with peptides with a lack in arginine [7], [26]. This is the reason why an in-deep analysis by MALDI-MS of a mixture of peptides requires a previous separation using HPLC or Gel electrophoresis.
Table I.3 Computational services and tools for protein mass spectrometry. (Adapted from reference [3])
Name Website Purpose References
ExPASy www.expasy.org
Resource/software for protein
sequence and mass analysis Public
EBI www.ebi.ac.uk
Biological databases and query
tools Public
NCBI www.ncbi.nlm.nih.gov
Biological databases and query
tools Public
GPMAW www.gpmaw.com
Protein sequence and mass
analysis Commercial
Mascot www.matrixscience.com
Computational tool for protein identification by MS and MS/MS data. For links to more
search engines, see ExPASy
Public/Com mercial
X! Tandem www.thegpm.org/TANDEM/
Computational tool for protein identification by MS/MS data
Public/Com mercial
Phenyx
www.ionsource.com/functional_r eviews/Phenyx/phenyx-web.htm
Computational tool for protein identification by MS/MS data,
quantitation
Commercial
MSQuant
msquant.sourceforge.net Tool for protein quantitation
Freeware
Protein-Prospector Prospector.ucsf.edu/
Various tools for protein analysis and identification by
MS and MS/MS data
Public
ProteinCenter www.proxeon.com
Computational tool for analysis
of large proteomic data sets Commercial
NetPhos
Cbs.dtu.dk/services/NetPhos Predictions for phosphorylation sites. For links to other
Protein identification using data retrieved from mass spectrometry in combination with protein sequence database searching was first proposed by a number of research groups [26]–[30]. Different methods of work are found to this end, which are summarized in Figure I.6. As stated above, the main aim of any PMF-based method consists in to obtain an experimental list of peptide masses belonging to the same protein. This list is compared with all the ones presented in a database. The protein whose theoretical, also known as in-silico, list of peptide masses best matched the experimental one is retrieved as the protein identified by the searching engine. A list of computational services and tools for protein mass spectrometry is presented in Table I.3.
I.2.2.1 Sample Treatment for protein identification through PMF
Proteins are cleavage on their constituents peptides by enzymatic digestion or chemical cleavage with acids [24], [31], [32]. The type of enzyme selected, or the type and concentration of acid depends on the protein and on the type of analysis to be done. For instance, the sample treatment to study phosphorylation is different from the sample treatment used to study glycosylation. The enzymes used to digest proteins for protein identification belongs to the family of proteases and comprises the following groups [32]: serine; aspartic; cysteine; or metalloproteases. Each enzyme cleaves the proteins at specific sites in a reproducible manner. As a general role for proteins identification the serine enzyme trypsin is used. This enzyme cleavages the protein at each arginine and lysine residue, each 10-12 aminoacids approximately, leading to the production of peptides with masses comprised between 800 to 2000 Da, which are very appropriated for mass spectrometry analysis [24]. Such peptides can be further fragmented in the mass spectrometer using different approaches, being the most frequent the named collision-induced dissociation, CID. This fragmentation allows the sequencing of peptides in a reproducible and fashion manner, allowing the identification of proteins trough the sequencing of peptides [7]. The variables affecting the protein cleavage performance are enzyme concentration, temperature and pH.
protein digestion [33]. Other possibility entails the direct cleave of all the proteins present in a complex proteome by adding the enzyme to the sample. Thus, a highly complex solution of peptides is obtained which is subsequently separated by multi-dimensional chromatography [34]. Finally, the digestion of a protein or a complex proteome can be done in an automated mode using chromatography [25], [35], [36]. Table I.4 shows the advantages and drawbacks of the aforementioned approaches.
Table I.4 Analytical parameters for enzymatic protein digestion. (Reproduced with permission from reference [24].
Variable In gel digestion In-solution
digestion
In column
digestion
Treatment time up to 12 h up to 12 h up to 10 min.
Handling high medium low
Sample throughput low medium high
On-line application no yes yes
Protein digestion yield low medium high
Robustness low high medium
Protein/enzyme ratio low very low medium
Cost low low medium
I.2.3 Classic protocols
I.2.3.1 In-gel protein digestion
This methodology is time consuming, it requires operator skills and in handling intensive. However, it is not expensive if compared with the HPLC-based methods. The major advantages are its cost-effectiveness and that protein post-translational modifications can be seen at a glance. Figure I.7 shows how complicated the pipeline is for a Gel-based method. First proteins need to be purified and prepared to be separated using the gel [37]. Further preparation it requires protein concentration as well as the
Figure I.7 Detailed description of an in-gel protein digestion protocol. (Figure reproduced with permission from reference [24])
Sa m p le Pr e p a ra ti o n
Classical Protein Analysis Treatment for 1D Gels:
total time 20-24 h.
Intended Effect
Removal interferences Cut off protein spots and slight slicing the gel with the scalpel
Wash with water (3 x 100µl) and acetonitrile (3 x 100µl)
Dry in a dried speed- vacuum
Add NH4HCO3 buffer 12,5mM (10µl)
Incubate at 37ºC for 4 h or overnight. (HIFU sonication for 2 minutes)
Maintain pH during incubation time Wash with water (3 x 100µl) and acetonitrile (3 x 100µl)
Add formic acid 0,3% (15µl)
Digestion of proteins into peptides
Stop trypsin activity Treated with DTT (40 µl, 25 min) and IAA (30µl, 35 min) Reduction and alkylation di-sulphide
bonds
Removal interferences
Dehydrate the gel Facilitate Trypsin penetration into the
gel Pu r if ic a ti o
n Protein denaturation
Protein separation and purification
Remove the excess of colouring solution
5µl of protein + 5µl of Sample buffer for SDS-PAGE prepared as follows: tris-base 0,5M at pH=6,6–6,8 (5ml) +10% SDS (8ml) + β-mercaptoethanol (1ml) + glicerol (2ml) + bromophenol blue (4mg) + H
2O till 20ml of total volume
Boiling in water bath for 5 min
Electrophoresis (60/70 min) at constant voltage of 120V and 400mA
Staining with coomassie blue R-250 (1g) + glacial acetic acid (15ml) + methanol (90ml) + H
2O till 200ml of total volume
De-staining with a decolouring solution prepared with: glacial acetic acid (75ml) + methanol (450ml) + H2O till 1000 ml of total volume
− Reduction of disulfide bonds (β
-mercaptoetanol)
Visualize the sample electrophoretic front (Bromophenol Blue)
− Optimize pH for trypsin activity (Tris-Base 0,5M)
Visualize the proteins bands through staining
Add Trypsin (15 µl) and left in a ice bath for 1 h Penetration of the enzyme into the gelTrypsin penetration in the gel
Proteins are denatured and solubilized in urea/thiourea solutions at concentrations up to 9 M [39]. This helps to obtain a subsequent in-gel efficient separation of proteins. In a typical 2D gel electrophoresis experiment the proteins are first separated as a function of their isoelectric points, pI, (first dimension). After the completion of the first dimension, and in order to avoid further re-oxidation, it becomes necessary to reduce cystine residues using dithiothreitol (DTT). The resulting cysteines are then obstructed with iodoacetamide (IAA). Afterwards, proteins are then separated following their size (second dimension). [40]. Once the proteins have been separated, they need to be visualized. This is done using Coomassie Blue, fluorescent dyes, or with MS-compatible silver nitrate [41]. An example
of a typical electrophoretic separation is given in Figure I.6, protocol A, where a gel corresponding to the second dimension is presented. Each dark spot corresponds to one or to some proteins, that can be extracted intact using (i) passive elution [42], (ii) electro elution [43], or (iii) the ultrasonic-assisted elution [44]. After elution, proteins are digested in solution, then analysed by PMF and finally, identified.
Protein elution from gels is troublesome, however, a faster and easiest approach is done where the protein is digested in the own gel, then the peptides are eluted from the gel into a solution, sometimes with the aid of ultrasonication. As a result, solid protocols have been developed for in-gel digestion [45], [46]. Furthermore, automated protein digestion is available in a large number of proteomic facilities.
Whatever the method of choice, the procedure is always the same. First, the bands (1D) or the spots (2D) are cut from the gel and then the staining chemicals are removed. For this, there are some specific protocols depending on the type of staining [47]. Then, an adequate amount of enzyme is introduced in the solution and the enzyme is allowed to reach the protein trapped in the gel, sometimes with the aid of microwave energy or ultrasonic energy. For this purpose, it is fundamental that the solvent composition inside the gel be rigorously controlled. Therefore, gel slides must firstly be dehydrated using acetonitrile and finally dried in a speed vacuum [36], [48], [49].
The pH and temperature are also controlled during all the procedure to ensure enzyme activity. Digestion is done in a couple of hours or during overnight incubation at 30 ºC or 37 ºC [24]. Lastly, the supernatant which contains the peptides is acidified in
[51]. The in-gel digestion protocol presents, however, various disadvantages, as (i) inaccessibility of some peptide bonds to the enzyme as a result of the process of trapping protein substrates in the gel, and (ii) inability of some peptides produced during the digestion to be diffused freely from the gel. The aforementioned disadvantages clarify different results between in-gel and in- solution digestion methods [36].
I.2.3.2 In-solution protein digestion
In-solution protein digestion of complex proteomes and subsequent protein identification (shotgun proteomics), developed by Link et al. [34], is currently the most popular and powerful method to identify proteins in large scale. It is very simple: the
whole proteome under study is cleavage at once. This produces a solution containing hundreds of thousands of peptides. Some precautions must be taken into consideration, namely (i) that the more abundant proteins are normally easier to identify; (ii) that some fractionation is needed in order to get the identification of less abundant proteins easier; and, (iii) that variation in the yield of digestion observed from sample to sample might happen due to the quantity and number of proteins, heterogeneity in the matrix, and its physical and chemical properties [7].
separeted and desalted using Multi dimensional liquid chromatography and then analyzed by MS.
In-solution digestion has the advantage of being suitable for on-line applications and the sample treatment is easier than the in-gel approach stated earlier. Yet, there are still some disadvantages, such as time-consuming enzymatic digestion and the background noise in MS analysis introduced by enzyme autolysis products [24], [55].
A special mention is needed for membrane proteins, with low solubility in water. Cyanogen bromide, methanol or the use of acid labile surfactants are generally used to
handle membrane proteins successfully [56], [57], [58]. Then, the complex mixture of peptides produced by the in-solution digestion procedure is separated using multi-dimensional chromatography coupled to tandem mass spectrometry [1], [7]. Proteins are then identified by the fragmentation spectra (amino acid sequence) of the peptides. This procedure is known as peptide fragment fingerprinting (PFF) [59].
1.2.3.3 In-column protein digestion
Several drawbacks can be pointed for the in-solution and in-gel digestion methods. First, long digestion time, typically overnight, is required. Second, the trypsin undergoes autolysis, what makes the solution reach in peptides of this enzyme, which may affect the analysis [7]. Third, if the protein concentration is low, in the micromolar range, low digestion yields are obtained. Fourth, they are time consuming and handling intensive and fifth, peptide losses by adsorption can occur [24].


![Figure I.7 Detailed description of an in-gel protein digestion protocol. (Figure reproduced with permission from reference [24])](https://thumb-eu.123doks.com/thumbv2/123dok_br/16496249.733574/49.892.130.793.102.1001/figure-detailed-description-digestion-protocol-reproduced-permission-reference.webp)
![Figure I.10 Development and collapse of cavitation bubbles. (from Mason et al. [61])](https://thumb-eu.123doks.com/thumbv2/123dok_br/16496249.733574/55.892.217.702.110.397/figure-i-development-collapse-cavitation-bubbles-mason-et.webp)


