Diana Maria Patacas Viegas Vieira
MSc. Biotecnologia
Crystallographic studies of proteins involved in the
mRNA localization mechanisms in
Drosophila melanogaster
and
amidation of the peptidoglycan residues in
Staphylococcus aureus
Dissertação para obtenção do Grau de Doutor em
Bioquímica, Especialidade Bioquímica Estrutural
Orientador:
Doutor José Trincão
Senior Beamline Scientist, Diamond Light Source, UK
Co-orientador: Doutora Maria João Romão
Professora Catedrática, FCT/UNL
Doutor Thomas Edwards
Associate Professor, Leeds University, UK
Júri:
Presidente: Doutor José Paulo Barbosa Mota
Arguentes:
Doutor Sérgio Raposo Filipe
Doutora Sandra de Macedo Ribeiro
Vogais:
Doutora Maria Luísa Santos de Sousa Cyrne
Doutora Teresa Sacadura Santos Silva
Diana Maria Patacas Viegas Vieira
Crystallographic studies of proteins involved in the
mRNA localization mechanisms in
Drosophila melanogaster
and
amidation of the peptidoglycan residues in
Staphylococcus aureus
Dissertação apresentada para a obtenção do grau de Doutor em Bioquímica,
Especialidade Bioquímica Estrutural, pela Faculdade de Ciências e Tecnologia da
Universidade Nova de Lisboa
Monte da Caparica, 16 de Dezembro de 2014
iii Título: “Crystallographic studies of proteins involved in the mRNA localization mechanisms in
Drosophila melanogaster and amidation of the peptidoglycan residues in Staphylococcus aureus”
Copyright em nome de Diana Maria Patacas Viegas Vieira.
vii
Agradecimentos
(Acknownledgements)
Agradeço ao meu orientador Dr. José Trincão por ter-me entrevistado em 2009 e ter confiado em mim desde então para levar a bom porto os seus projectos científicos e por te-los tornado meus, por ter-me dado liberdade para encontrar a minha personalidade no mundo da ciência, sem imposições, fazendo com que crescesse e aprendesse com os próprios erros.
À minha co-orientadora, Professora Maria João Romão por ter-me aceite na sua família científica e
por ter-me dado todas as condições para concretizar os meus objectivos.
To my co-supervisor, Dr Thomas Edwards thank you for being present even with the geographical distance and thank you for helping me to overcome myself to always do better and know better and specially for instigating my scientific curiosity.
Aos meus colegas no grupo XTAL.
Foi um prazer ter partilhado o 605 e o 621 convosco!
Um obrigado especial à Cecília, à Benedita, à Márcia e ao Filipe por toda a ajuda ao longo destes anos de convivência.
Não esquecendo o David pela paciência nos jogos de ténis e,
the last but not the least, o inigualável Sr. Marino
pela sua imensa boa-disposição e por ser um exemplo de coerência e, já sabes, stand-up comedy!..
To Professor Paul Raithby for welcoming me in his workgroup and for all the support; without it would have been impossible to fulfil my objectives. My utmost sincere acknowledgments!
To OPPF and its entire staff: I had the time of my life working with you.
Às pessoas que conheci durante a melhor/pior experiência … ser emigrante! Fizeram de 18 meses da minha existência algo leve de se suportar. Obrigada por terem partilhado comigo o sorriso, o olhar, palavras e atitudes…
A todos os meus amigos… vocês são e serão o pilar da minha insanidade mental.
Às pessoas que conheci pelo caminho, às que ficaram e às que se perderam…
Àquela pessoa brilhante que desde os meus 5 anos sempre esteve ao meu lado - a minha melhor amiga Sandra.
viii Aos meus miúdos pela fonte inesgotável de energia.
Pelas gargalhadas e por tudo o que as crianças nos ensinam, desde que estejamos dispostos a aprender.
Ao meu Myke, o meu baby. O meu pequeno pedacinho de amor. A minha riqueza.
À fundação “Vieira” por todo o apoio logístico.
E nada disto, nem qualquer outra etapa da minha vida, teria sido possível sem a minha família. Somos apenas quatro mas para mim somos o mundo.
À minha irmã, por ser quem é e, por fazer-me sentir mais do que realmente sou.
Ao meu Pai por ter-me dado um porto seguro onde sempre pude retornar, por nunca me limitar, por ter-me ensinado a integridade, que a nossa palavra é o que nos define e que “o capitão é o último a abandonar o navio”.
E, um MUITO OBRIGADA à minha Mãe. A pessoa mais importante!
Um exemplo de Mulher.
Uma Força da Natureza e uma Guerreira. Se sou quem sou, a ti o devo!
ix
Index
Agradecimentos ...vii
Index...ix
Figures Index ...xi
Table Index ... xvii
Equations Index ... xix
Abbreviations... xxi
Abstract ... 25
I. mRNA localization mechanisms... 25
II. Amidation of S. aureus peptidoglycan residues ... 26
I. Chapter I ... 29
X-Ray Protein Crystallography ... 29
Overview of Protein Crystallography ... 30
Crystal Production ... 31
Data Collection and X-Ray Diffraction ... 33
Synchrotron radiation ... 33
Electron Density and Structure Determination ... 37
The Phase Problem ... 37
Refinement, Validation and Publication... 38
II. Chapter II ... 41
II.1. mRNA localization mechanisms in Drosophila melanogaster ... 41
Drosophila melanogaster ... 41
mRNA localization mechanisms ... 43
II.2. mRNA localization mechanisms in Drosophila melanogaster: experimental procedure 49 Ypsilon-Schachtel ... 50
Exuperantia ... 54
Exu-Yps complex ... 58
II.3. mRNA localization mechanisms in Drosophila melanogaster: results and discussion ... 59
II.4. mRNA localization mechanisms in Drosophila melanogaster: conclusions and future work ... 65
III. Chapter III ... 69
III.1. Amidation of S. aureus peptidoglycan residues: general introduction ... 69
Bacterial Cell Wall ... 69
The Biochemistry of Peptidoglycan ... 70
Peptidoglycan amidation - genetic determinants and enzymes ... 74
III.2. Amidation of S. aureus peptidoglycan residues: experimental procedure ... 77
GatD ... 78
Source organism ... 78
x
MurT-GatD complex ... 86
Data collection and structure determination ... 91
III.3. Amidation of S. aureus peptidoglycan residues: results and discussion ... 95
Overall Structure Description ... 96
Comparison with homologous structures ... 99
Ligand binding prediction ... 101
Proposed mechanism for GatD-MurT ... 104
III.4. Amidation of S. aureus peptidoglycan residues: conclusion and future work ... 105
References ... 107
Appendix ... 115
A. DNA and protein sequences ... 115
A.1. Translation of exuperantia (exu) ... 115
A.2. Translation of ypsilon-schachtel (yps) ... 116
A.3. Translation of gatD ... 117
A.4. Translation of murT ... 118
B. Exuperantia and Ypsilon-Schachtel cloning and expression assays... 119
C. OPPF construct design – Exuperantia and Ypsilon-Schachtel ... 133
D. OPPF construct design – GatD and MurT ... 189
E. Folding of proteins expressed as inclusion bodies ... 199
Protocol 1... 199
Protocol 2... 200
xi
Figures Index
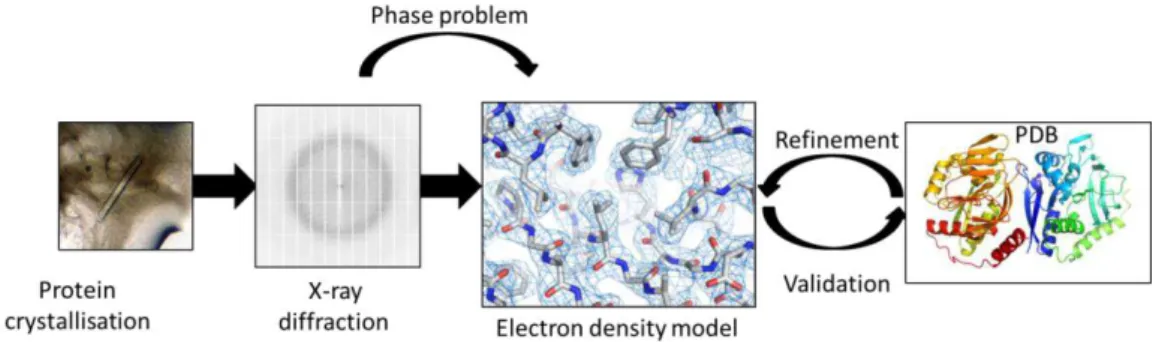
FIGURE I.1 - X-ray protein crystallography process overview. The description is detailed on the text above. ... 30
FIGURE I.2 – Vapour diffusion techniques: Hanging drop and sitting drop. Both methods require a protein solution drop with buffer and precipitant to equilibrate with a reservoir solution containing buffers and precipitants at higher concentrations. ... 31
FIGURE I.3 - Crystallization phase diagram. Schematic representation of a phase diagram illustrating the variation of protein concentration with the precipitating concentration. ... 32
FIGURE I.4 - Schematic representation of an X-ray experiment. The X-rays are generated by a source. The crystal mounted on the goniometer and when it’s hit by the X-rays, diffracts them. The diffracted beam is then recorded on a detector. ... 33
FIGURE I.5 – On the left: Diamond Light Source is the UK national synchrotron. On the right: Diamond Macromolecular Crystallography (MX) village overview. MX village currently has five beamlines: three high brilliance MAD beamlines (I02, I03, I04), a fixed wavelength
beamline (I04-1) and a microfocus MAD beamline (I24). Image from
http://www.diamond.ac.uk/Beamlines/Mx.html. ... 33
FIGURE I.6 –Schematic representation of the Bragg’s Law. In this model, each set of parallel planes is treated as an independent diffractor and produces a single reflection – constructive interference. Adapted from [7] ... 35
FIGURE I.7 – Elementary representation of an X-ray experiment. A crystal when submitted to an X-ray beam produces reflections which are recorded in the detector creating a diffraction pattern. The diffraction pattern is the result of a Fourier transformation of the crystal real space into reciprocal space and vice-versa. ... 36
FIGURE I.8 – Structure factor equation and schematic representation (F). Fhkl is a mathematical
relation of the scattering factor and the positional terms of each atom; is represented as a vector which length is the intensity of the reflection (F ∞ 𝐼) and α is the phase angle. Adapted from [7] ... 38
FIGURE II.1 – Representation of the axis that define Drosophila body pattern:
Anterior-Posterior (A→P) and dorsal-ventral (D→V). Image adapted from www.insectslimited.com. .... 41
FIGURE II.2 – Maternal effect genes that establish polarity creating a protein gradient throughout the oocyte. The four genes: hunchback (hbc), caudal (cdl), bicoid (bcd) and nanos
(nos) are transferred from the ovarian nurse cells into the oocyte: bicoid is trapped in the
anterior pole while nanos is transported into the posterior pole. When translated, Bicoid protein
creates a gradient A→P whilst Nanos protein creates an inverse gradient P→A. Caudal and Hunchback proteins gradient are responsible for the inhibition of the bcd and nos translation.
Adapted from [32] ... 42
FIGURE II.3 – Body segmentation in Drosophila: comparison between the larval and adult fly.
Image from [32] ... 42
FIGURE II.4 – Distribution of Exuperantia protein in Drosophila wild-type egg chambers. A-D:
xii FIGURE II.5 - Basic local alignment of Exuperantia amino acid sequence with its homologous based on NCBI Blast. [40], [41] and possible PEST (Proline-Glutamate-Serine-Threonine) sequence based on EMBOSS epestfind. [42] ... 45
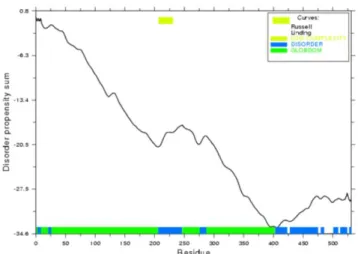
FIGURE II.6 - GLOBPLOT (Intrinsic Protein Disorder, Domain & Globularity Prediction) for Exuperantia. This software (http:// globplot.embl.de) is a web service that allows plotting the tendency within the query protein for order/globularity and disorder. [43] ... 46
FIGURE II.7 – Basic local alignment of Yps primary sequence with four other proteins that share a high level of homology. In red are the highly conserved residues among species - the cold shock domain. The green rectangle highlights the residues that form the RNA recognition motifs - RNP1 and RNP2. [28][29] ... 47
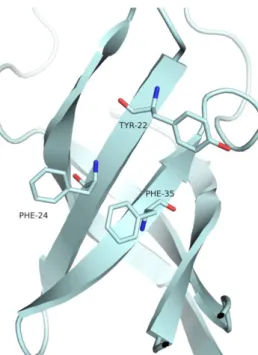
FIGURE II.8 – Schematic representation of the typical topology of the RRM: four-stranded β -sheet with the position of the conserved RNP1 and RNP2 aromatic residues. Adapted from [51] ... 47
FIGURE II.9 – Representation of the three conserved aromatic residues which are responsible for the RNA binding surface in proteins that hold a cold shock domain. The model used is the cold shock domain from Y-box protein 1 from Homo sapiens (PDB entry: 1H95). [46] ... 48
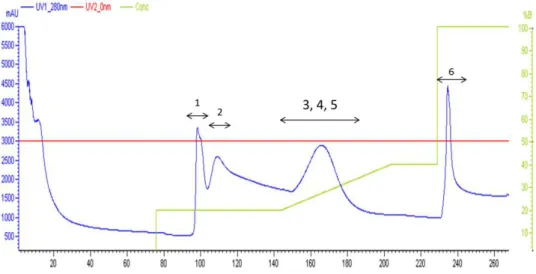
FIGURE II.10 - Typical chromatographic profile of N-His6-Sumo-Yps_CSD after the IMAC
purification step. Injected sample volume of 50ml; Binding buffer: 20mM Tris HCl pH7.9, 500mM NaCl, 10mM imidazole, 3% glycerol. Elution buffer: 20mM Tris-HCl pH7.9, 500mM NaCl and 500mM imidazole, 3% glycerol. The fractions 1 to 6 were aliquoted and analysed by SDS-PAGE. Blue line represents the A280nm and green line represents the elution gradient. ... 50
FIGURE II.11 - SDS-PAGE analysis of the purified protein – run at 40V for 30 minutes in Tris buffer and stained with a Coomassie based-solution. Lane 1 – molecular weight marker (kDa) and following lanes have the same nomenclature as the figure II.10 chromatogram. N-His6
-Sumo-Yps_CSD expected molecular weight: 25kDa. ... 51
FIGURE II.12 – Left: Typical chromatographic profile of Sumo-Yps_CSD after the SEC purification step. Injected sample volume of 0.5ml; Elution buffer: 20mM Tris HCl pH8, 100mM NaCl, 1mM DTT and 3% glycerol. The fractions 1 to 3 were aliquoted and analysed by SDS-PAGE. Right: SDS-PAGE analysis of the purified protein – run at 40V for 30 minutes in Tris buffer and stained with a Coomassie based-solution. Lane 1 – molecular weight marker (kDa) and following lanes have the same nomenclature as the corresponding chromatogram. Yps_CSD expected molecular weight: 9kDa. ... 51
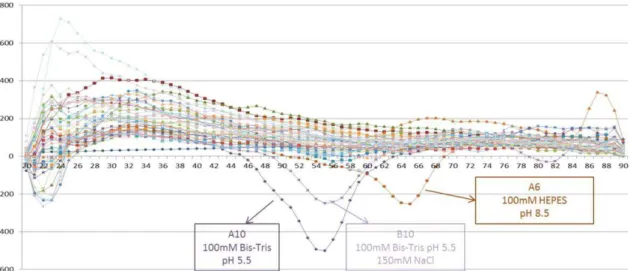
FIGURE II.13 - Thermal shift assay result for Yps_CSD in the 36 buffer conditions listed on appendix F. The more stable the protein is in solution, the more likely it is to produce a crystal. In this sense, the buffers that yield the most promising results were used to solubilize Yps_CSD before proceeding to the crystallization trials. ... 52
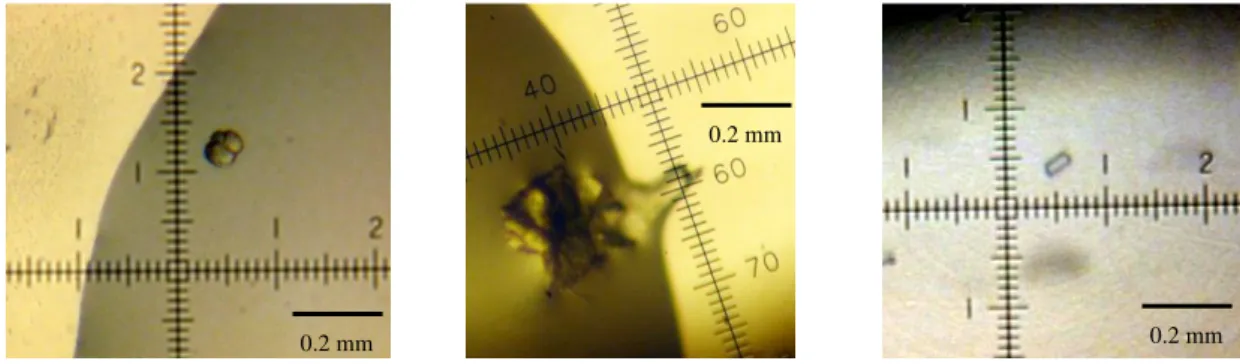
FIGURE II.14 – Possible Yps_CSD crystal obtained for the crystallization trials of Yps_CSD, using CaCl2 (left), PEG 8K (middle) and 12.5% w/v 12.5% PEG 1000, 12.5% w/v PEG 3350,
12.5% v/v MPD (right) as precipitant. ... 53
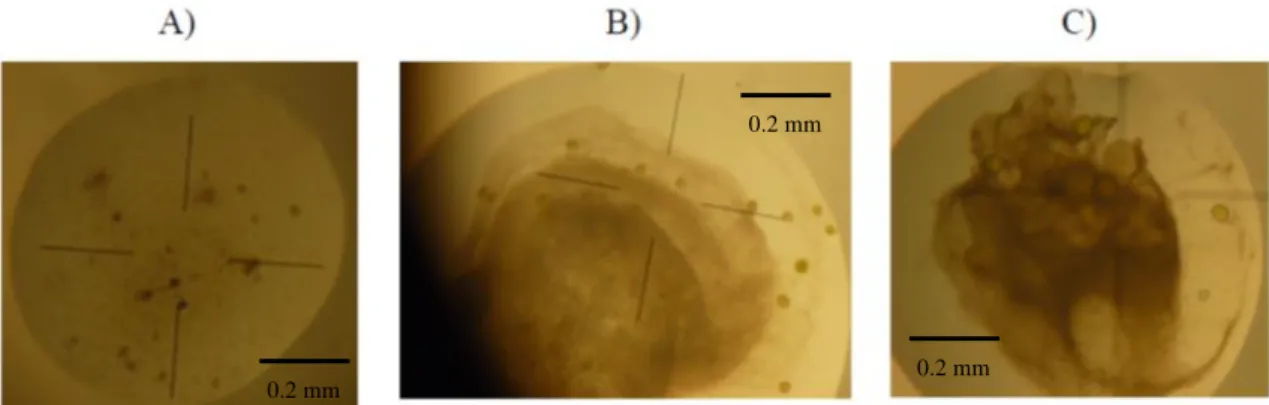
FIGURE II.15 - Possible Exuperantia protein crystals, with dimensions 0,04x0,04x0,04mm3,
obtained in 24 hours by the method of vapour diffusion in sitting drop using A,B) PEG 8K and C) sodium/potassium phosphate solution as precipitant. ... 55
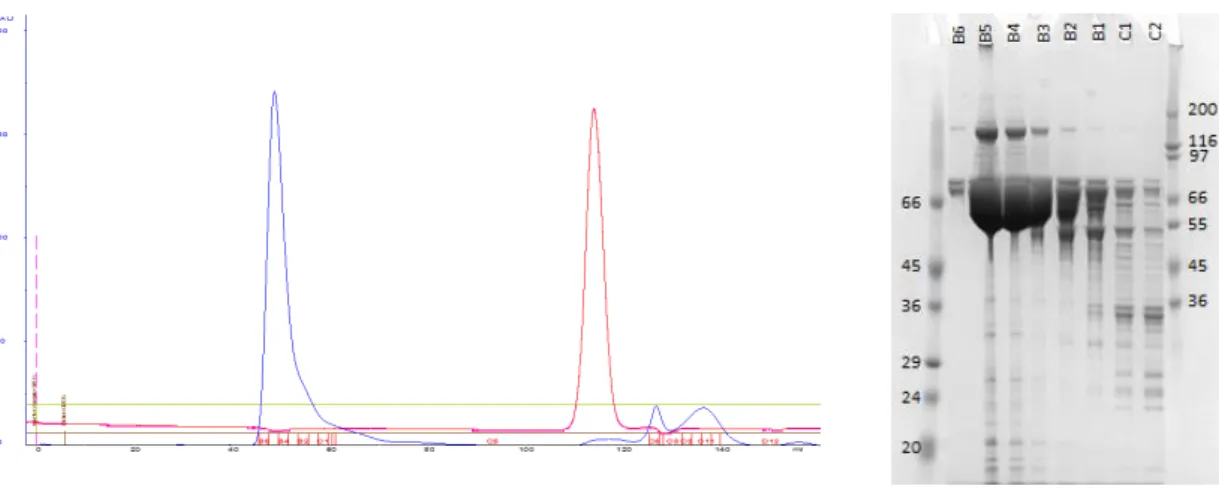
xiii Buffer: 20mM Tris-HCl pH7.5, 200mM NaCl, 1mM TCEP. Superdex 200 HiLoad 16/60 column (GE Healthcare). The fractions B6, B5, B4, B3, B2, B1, C1 and C2 were aliquoted and analysed by SDS-PAGE. The blue line corresponds to the A280nm and the red line corresponds to
the sample conductivity. On the right: HT-SDS-PAGE analysis of the purified protein – Invitrogen NuPAGE Gels – run at 200V for 40 minutes in BisTris buffer and stained with a Coomassie based-solution. Lane 1 – molecular weight marker (kDa) and following lanes have the same nomenclature as the chromatogram. N-TF-Exu2.210 expected molecular weight: 73kDa. ... 56
FIGURE II.17 – On the left: Typical chromatographic profile of N-TF-Exu2.193 after the second purification step, the size exclusion chromatography. Injected sample volume of 5ml; Buffer: 20mM Tris-HCl pH7.5, 200mM NaCl, 1mM TCEP. Superdex 200 HiLoad 16/60 column (GE Healthcare). The fractions D11, D10, D9, D8, D7, D6 and D5 were aliquoted and analysed by SDS-PAGE. The blue line corresponds to the A280nm and the red line corresponds to the sample conductivity. On the right: HT-SDS-PAGE analysis of the purified protein – Invitrogen NuPAGE Gels – run at 200V for 40 minutes in BisTris buffer and stained with a Coomassie based-solution. Lane 1 – molecular weight marker (kDa) and following lanes have the same nomenclature as the chromatogram. N-TF-Exu2.193 expected molecular weight: 72kDa. ... 56
FIGURE II.18 – Analysis of the globular and non-globular domains of Exuperantia by Globplot2. [43] The residues in bold correspond to the globular domains of the protein: 1-206 and 248-403 and secondary structure prediction by iTASSER. Helices highlighted in red, Strands highlighted in blue and Coils highlighted in black. [44] ... 59
FIGURE II.19 - Analysis of the globular and non-globular domains of Ypsilon-Schachtel by GlobPlot. [43] The residues in bold correspond to the Cold Shock Domain: residues 63-131 ... 60
FIGURE III.1 - Representation of the structural differences in positive and Gram-negative cell walls. A) The Gram-Gram-negative cell wall has three layers: the outer membrane (OM), the peptidoglycan and the cytoplasmic or inner membrane (IM). B) The Gram-positive cell wall has no OM and the peptidoglycan layer is thicker. ... 69
FIGURE III.2 – Chemical structure of the peptidoglycan pentapeptide. a) Typical pentapeptide sequence. Adapted from [74] b) Staphylococcus aureus peptidoglycan chemical structure.
Adapted from [75]. L-Ala: L-alanine, D-iso-Glu: D-glutamic acid, meso-A2pm:
meso-diaminopimelic acid, D-Ala: D-alanine, L-Lys: L-lysine. Image created using ChemDraw®. .. 72
FIGURE III.3 – Schematic representation of the peptidoglycan biochemical pathway. In the overall process, precursors are synthesized in the cytoplasm, linked to the transport lipid and flipped across the inner membrane to finally be incorporated into the main chain. Adapted from [70][76]. ... 73
FIGURE III.4 – Schematic representation of S. aureus COL genome region that includes the
two genes of interest: SACOL 1951 – murT and SACOL 1950 – gatD and the upstream and
downstream regions. murT and gatD genes are transcribed in the same direction and no
promoter was found between these two genes. Adapted from [5] ... 74
FIGURE III.5 – Comparison between the three domains characteristics of Mur ligases with MurT. a) This scheme represents the general three domains topology of Mur ligase proteins. N-terminal domain is responsible for the UDP-MurNAc-peptide binding, the C-N-terminal domain is responsible for the binding of the incoming amino acid and the central domain is where the ATP and co-factor Mg2+ bind. b) MurT topology lacks the flanking N- and C-terminal sequences and
xiv FIGURE III.6 – Comparison of glutamine-dependent amidotransferase structure with GatD. a) glutamine-dependent amidotransferases modular structure representation: a substrate binding domain (synthase domain) and a GAT domain with its conserved residues for glutaminase activity. b) GatD shares the GAT domain and the glutaminase activity motifs. Adapted from [5] ... 75
FIGURE III.7 – On the left: Typical chromatographic profile of N-His6-GatD after the second
purification step, the size exclusion chromatography. Injected sample volume of 6ml; Buffer: 20mM Tris-HCl pH7.5, 200mM NaCl, 1mM TCEP. Superdex 200 HiLoad 16/60 column (GE Healthcare). The fractions A12, C1 to C12 (*) were aliquoted and analysed by SDS-PAGE. The blue line corresponds to the A280nm and the red line corresponds to the sample conductivity. On the right: HT-SDS-PAGE analysis of the purified protein – Invitrogen NuPAGE Gels – run at 200V for 40 minutes in BisTris buffer and stained with a Coomassie based-solution. Lane 1 – molecular weight marker (kDa) and following lanes have the same nomenclature as the chromatogram. N-His6-GatD expected MW: 27kDa. ... 79
FIGURE III.8 – On the left: Typical chromatographic profile of N-His6-SeGatD after the second
purification step, the size exclusion chromatography. Injected sample volume of 5ml; Buffer: 20mM Tris-HCl pH7.5, 200mM NaCl, 1mM TCEP. Superdex 200 HiLoad 16/60 column (GE Healthcare). The fractions A8, A11, B12, C4 to C12 and E2 (*) were aliquoted and analysed by SDS-PAGE. The blue line corresponds to the A280nm and the red line corresponds to the sample conductivity. On the right: HT-SDS-PAGE analysis of the purified protein – Invitrogen NuPAGE Gels – run at 200V for 40 minutes in BisTris buffer and stained with a Coomassie based-solution. First and last lanes – molecular weight marker (kDa) and following lanes have the same nomenclature as the chromatogram. N-His6-GatD expected MW: 27kDa. ... 80
FIGURE III.9 – Mass spectra acquired for native (on the left) and labelled (on the right) GatD, by manual drop analysis and direct injection MS in a LC-ESI-MS. Sample concentration: 20μM. Service available at OPPF-UK and kindly performed by Dr. Joanne Nettleship. ... 80
FIGURE III.10 – GatD protein crystals. Representative selection of different morphology obtained for GatD protein crystals and their conditions. Common to all crystallization solutions is the use of polyethylene glycol (PEG) as precipitant. ... 82
FIGURE III.11 - SeGatD protein crystals. Representative selection of different morphology obtained for SeGatD protein crystals and their conditions. Common to all crystallization solutions is the use of polyethylene glycol (PEG) as precipitant. ... 83
FIGURE III.12 – On the left: Chromatographic profile of N-His6-GatD co-purified with N-His6
-Sumo-MurT after the second purification step, the size exclusion chromatography. Injected sample volume of 5ml; Buffer: 20mM Tris-HCl pH7.5, 200mM NaCl, 1mM TCEP. Superdex 200 HiLoad 16/60 column (GE Healthcare). The fractions A11, B9 B1, C5, C8, C9, C11, C12, D12, D9, D6 and D4 (*) were aliquoted and analysed by SDS-PAGE. The blue line corresponds to the A280nm and the red line corresponds to the sample conductivity. On the right:
HT-SDS-PAGE analysis of the purified protein – Invitrogen NuPAGE Gels – run at 200V for 40 minutes in BisTris buffer and stained with a Coomassie based-solution. First and last lanes – molecular weight marker (kDa) and following lanes have the same nomenclature as the chromatogram. N-His6-GatD expected MW: 27kDa and N-His6-Sumo-MurT MW: 61kDa. ... 86
FIGURE III.13 – On the left: Chromatographic profile of co-expression of N-His6-GatD with
N-His6-Sumo-MurT after the second purification step, the size exclusion chromatography. Injected
xv corresponds to the sample conductivity. On the right: HT-SDS-PAGE analysis of the purified protein – Invitrogen NuPAGE Gels – run at 200V for 40 minutes in BisTris buffer and stained with a Coomassie based-solution. First and last lanes – molecular weight marker (kDa) and following lanes have the same nomenclature as the chromatogram. N-His6-GatD expected MW:
27kDa and N-His6-Sumo-MurT MW: 61kDa. ... 88
FIGURE III.14 – Possible MurT-GatD protein crystals. Representative selection of different morphology obtained Common to all crystallization solutions is the use of polyethylene glycol (PEG) as precipitant. ... 90
FIGURE III.15 – Representative diffraction patterns of the crystals. Left: native; Right: SeMet derivative. The resolution at the edge of the detector is 2.1 and 2.5Å, respectively. ... 91
FIGURE III.16 – GatD model in a light blue cartoon representation with the anomalous electron density (in orange at a 3σ contour) for the two (out of three) atoms of selenium in the SeGatD derivative. This figure and other structure-related figures reported in this thesis were prepared using WinPymol. [60] ... 92
FIGURE III.17 - The experimental phases to determine the 3D structure of GatD were obtained by single-wavelength anomalous diffraction (SAD) using data collected from the SeMet derivative at the Se edge peak. The model was refined with Refmac5 from CCP4. The 2mFo-DFc electron density maps are contoured at 1σ (blue). ... 92
FIGURE III.18 – Sequence alignment of four proteins with conserved glutamine amide transfer domains. The highlighted residues correspond to the conserved triad of residues responsible for the catalytic function. gi_23465027: cobyric acid synthase CobQ from Bifidobacterium longum;
gi_18144850: probable cobyric acid synthase from Clostridium perfringens str. 13;
gi_17131811: alr2718 from Nostoc sp.; gi_23003197: hypothetical protein Lgas_03000924
from Lactobacillus gasseri. [47] ... 95
FIGURE III.19 – Crystallographic dimer of GatD in a cartoon representation and coloured according to the secondary structure: α-helices in blue, β-sheets in red and loops in purple. This figure and other structure-related figures reported in this thesis were prepared using WinPymol. [60] ... 96
FIGURE III.20 – GatD secondary structure analysis. The catalytic triad has a reactive cysteine at position 94 in the turn between a β-strand and α-helix designated as the ‘nucleophile elbow’. The residues highlighted in a green box are GatD catalytic triad. Image generated by PDBSum. [94] ... 97
FIGURE III.21 - GatD topology. GatD has a mixed topology, instead of a α-β-α fold characteristic of glutaminase structures. Image generated by PDBSum. [94] ... 97
FIGURE III.22 – On the left: Overall representation of GatD and the position of the residues that compose the triad within the molecule, located at positions 94, 149 and 151. On the right: closer view of the catalytic triad residues. The cartoon representation is from the monomeric GatD. The residues C94-His149-Gly151 are represented as sticks and coloured by atoms: carbons
in white, nitrogen in blue, oxygen in red and sulfur in yellow. ... 98
xvi FIGURE III.24 – Superimposition of GatD structure with three other type 1 GATases [96]. Glutamine Amidotransferase from Thermotoga maritima (PDB ID: 1KXJ); Imidazole glycerol
phosphate synthase subunit from Thermotoga maritima (PDB ID: 3ZR4); HISF Protein from Thermotoga maritima (PDB ID: 1GPW) and Amidotransferase HisH from Thermotoga maritima (PDB ID: 1K9V) in grey. The proteins are represented as cartoon and GatD is
coloured in red. RMSD: 5.238 (1GPW, 1K9V); 5.250 (1KXJ); 5.220 (3ZR4). ... 99
FIGURE III.25 – Superimposition of the catalytic triad Cys94-His149-Gly151 from GatD with the
catalytic triad Cys84-His178-Glu180 of the homologous structures: Glutamine Amidotransferase
from Thermotoga maritima (PDB ID: 1KXJ); HISF Protein from Thermotoga maritima (PDB
ID: 1GPW) in grey. GatD is represented in red and the catalytic triad’s residues are shown as ribbon and coloured by atom type: carbon in white, nitrogen in blue, oxygen in red and sulfur in yellow. ... 100
FIGURE III.26 - Comparison between glutamine (left) and its analogue 6-diazo-5-oxo-L-norlucine (DON). ... 101
FIGURE III.27 – Cluster predicted by AutoDock Vina in a GatD:glutamine interaction at the active site and a closer look at the active site. The residues are coloured by atom type: carbon in white, nitrogen in blue, oxygen in red and sulfur in yellow. [99] ... 102
FIGURE III.28 - Cluster predicted by AutoDock Vina in a DON:GatD interaction at the active site and a closer look at the active site. The residues are coloured by atom type: carbon in white, nitrogen in blue, oxygen in red and sulfur in yellow. [99] ... 103
FIGURE III.29 – Proposed mechanism for GatD-MurT combined action. Glutamine (Gln) is used as a nitrogen donor and is conversed at the glutaminase site in Glutamate (Glu) and ammonia (NH3). Ammonia is then transferred from GatD to the synthase domain, possibly
xvii
Table Index
TABLE I.1 - Crystal systems and protein space groups. The space group is characterised by the number of lattice points within the unit cell. P, C, I and F represent the four types of unit cell: primitive, end-face centered, body centered and face-centered. Adapted from [13] ... 34
TABLE II.1 – Summary table of the gene sequences selected, vectors used and E. coli
expression strains in the first part of this experimental work. ... 49
TABLE II.2 – List of the 96-well Greiner plates’ barcodes, the commercial crystallization screens, concentrations and temperatures trialled in order to crystalize the tagged protein sample: N-TF-Exu2.210 and N-TF-Exu2.193. ... 57
TABLE II.3 – Growth temperatures and times tested for Exu expression in E.coli. ... 61
TABLE III.1 – Constructs designed at Oxford Protein Production Facility. Further details on appendix C. ... 77
TABLE III.2 – Macromolecule production information. GatD construct 12143. Further details on appendix C ... 78
TABLE III.3 – List of the 96-well Greiner plate’s barcodes, the commercial crystallization screens, and concentrations and temperatures trialled in order to crystalize the native protein sample: GatD. ... 81
TABLE III.4 – List of the 96-well Greiner plate’s barcodes, the commercial crystallization screens, concentrations and temperatures trialled in order to crystalize the labelled protein SeGatD. ... 83
TABLE III.5 - Macromolecule production information. MurT construct 12139. Further information on appendix C. ... 84
TABLE III.6 – List of the 96-well Greiner plate’s barcodes, the commercial crystallization screens, concentrations and temperatures trialled in order to crystalize the protein N-His6
-Sumo-MurT. ... 85
TABLE III.7 - List of the 96-well Greiner plate’s barcodes, the commercial crystallization screens, concentrations and temperatures trialled in order to crystalize the protein complex MurT-GatD. ... 89
TABLE III.8 – List of the 96-well Greiner plate’s barcodes, the commercial crystallization screens, concentration, temperature and protein:reservoir drop ratio (P:R) trialled in order to optimize the hits obtained for the protein complex MurT-GatD. ... 90
TABLE III.9 - X-ray crystallography data-collection, processing and refinement statistics. (Values in parenthesis correspond to the outer shell) [91] ... 93
TABLE III.10 – Affinity binding energies from the 9 modes of glutamine predicted for the glutamine:GatD complex predicted by AutoDock Vina. [97] ... 101
xix
Equations Index
EQUATION I.1 - Bragg’s law diffraction equation. ... 35
EQUATION I.2 - Calculation of VM (Matthew's coefficient). Units: Å3Da-1. In this equation, V
represents the volume of the unit cell (Å3), Z is the number of asymmetric units and M is the
molecular weight of the asymmetric unit contents (Da). [17] ... 36
EQUATION I.3 - Electron density equation 𝜌𝑥, 𝑦, 𝑧 is given by a Fourier transform of the sum functions describing the atoms positions (x,y,z) in the crystal. V is the unit cell volume; 𝐹ℎ𝑘𝑙 corresponds to the structure factor amplitude and is experimentally obtained; 𝛼ℎ𝑘𝑙 is the phase angle which is not obtained directly from the diffraction experiment – phase problem. [8] ... 37
EQUATION I.4 – R-factor equation. The R-factor (or Rwork) is a statistical measurement that
relates the observed reflection amplitudes (Fobs) and those calculated from the model (Fcalc), in
xxi
Abbreviations
3D Three-Dimensional
A.U. Asymmetric Unit
AP Anterior-Posterior
AS Anomalous Scattering
ATP Adenosine Triphosphate
bcd bicoid
BLAST Basic Local Alignment Search Tool
CDD Conserved Domain Database
cDNA Complementary DNA
CSD Cold Shock Domain
Da Dalton
DGRC Drosophila Genomics Resource Center
D-iso-Glu D-iso-Glutamic Acid
DLS Diamond Light Source
DNA Deoxyribonucleic Acid
DSF Differential Scanning Fluorimetry
DUF Domain Of Unknown Function
DV Dorsal-Ventral
E. coli Escherichia coli
EM Electron Microscopy
Exu Exuperantia
GAT Glutamine-dependent Amidotransferase
GF Gel Filtration
GlcNAc N-Acetyl-Glucosamine
Gln Glutamine
Glu Glutamate
hbc hunchback
HTP High Throughput
IM Inner Membrane
IMAC Immobilized Metal Affinity Chromatography
IPTG Isopropyl β-D-1-thiogalactopyranoside
IR Isomorphous Replacement
L-Ala L-Alanine
LC-ESI-MS Liquid Chromatography-Electrospray Ionisation-Mass Spectrometry
L-Lys L-Lysine
LPS Lipopolysaccharide
xxii
meso-A2pm Meso-Diaminopimelic Acid
MR Molecular Replacement
mRNA messenger RNA
MRSA Methicillin-Resistant Staphylococcus Aureus
MurNAc N-Acetylmuramic Acid
MW Molecular Weight
NCBI National Center for Biotechnology Information
NMR Nuclear Magnetic Resonance
nos nanos
OB oligonucleotides and/or oligosaccharides
OD Optical Density
OM Outer Membrane
OPPF Oxford Protein Production Facility
osk oskar
PAGE Polyacrylamide Gel Electrophoresis
PCR Polymerase Chain Reaction
PCT Pre-Crystallization Test
PDB Protein Data Bank
PEG Polyethylene Glycol
PG Peptidoglycan
RNA Ribonucleic Acid
RNP Ribonucleoprotein
Rpim Precision-Indicating Merging Factor R
RRM RNA recognition motif
S. aureus Staphylococcus aureus
SAD Single-Wavelength Anomalous Diffraction
SCOP Structural Classification of Proteins
SDS Sodium Dodecyl Sulfate
SEC Size Exclusion Chromatography
SeMet Selenomethionine
TCEP tris(2-carboxyethyl)phosphine
TF Tissue Factor
UDP Uridine Diphosphate
Yps Ypsilon-Schachtel
xxiii
“Estuda sempre.
O estudo liberta da ignorância e
favorece a criatura com discernimento.
O estudo e o trabalho são as asas
que facilitam a evolução do ser.
O conhecimento é um bem que,
por mais que seja armazenado,
jamais toma qualquer espaço.
Pelo contrário,
faculta a mais ampla facilidade
para novas aquisições.
O homem que ignora, caminha às escuras.”
25
Abstract
I. mRNA localization mechanisms
Asymmetry is critical in higher organisms. mRNA is always found in complex with many proteins, forming ribonucleoprotein particles (RNP). These particles travel along cytoskeletal filaments with the help of motor proteins. mRNA transcripts contain cis-acting elements which
determine the timing of expression and final destination of the RNA and therefore of the encoded protein. These also determine which molecular motor will be used to reach the proper destination. Early genetic studies indicated that the proteins Exuperantia (Exu) and Swallow (Swa) are important for the anterior localization of bicoid mRNA. Recent studies showed that
Exu is also present in RNP particles containing oskar mRNA, and is important for its posterior
localization. It requires the presence of Ypsilon-Schachtel (Yps), a member of the cold shock family of RNA binding proteins. Exu and Yps were shown to co-purify, and interact in vitro
even in the absence of RNA. Exu seems to be a core component of the transport complex. Although many proteins have been implicated in this mechanism, there is still very little biochemical and structural information about the process. We intend to study the structural determinants which control mRNA transport within the cell. [1][2][3]
Structural studies of these proteins, in particular Exuperantia and Ypsilon-Schachtel, will provide a wealth of information that will help us to understand the mechanisms involved in mRNA sorting, loading onto the correct carrier, anchoring and translation regulation.
In order to determine protein structure of Exu and Yps, the protein encoding region was cloned into a pGEX and pET vector systems and expressed in several E. coli expression strains and
well as in a high-throughput facility where both genes were cloned into the pOPIN plasmids. The protein of interest was purified using the most common chromatographic methods: Immobilized metal ion affinity chromatography (IMAC), affinity chromatography and size-exclusion chromatography and the protein purity was estimated by polyacrylamide gel electrophoresis (SDS-PAGE).
26 II. Amidation of S. aureus peptidoglycan residues
The basic structure of S. aureus peptidoglycan and its synthesis pathway are well characterized.
Nevertheless, the mechanisms by which glutamic acid residues in bacterial cell walls undergo modification are still poorly understood. Inhibition of this step of bacterial cell wall synthesis reduces growth rate, resistance to β-lactam antibiotics and increased sensitivity to lysozyme. Two genetic determinants, murT and gatD, have been identified and were shown to be required
and sufficient to perform this step. The murTgatD operon emerged as a syntenic block that
seems to be widespread among bacteria. The genome co-localization of the two determinants, together with data from sequence analysis, suggests a coordinated function of MurT and GatD proteins in the peptidoglycan glutamate amidation. Both proteins together harbour all domain functions required for amidation of peptidoglycan precursor: MurT may be responsible for the recognition of the reaction substrates, the lipid linked peptidoglycan precursor and ATP, while GatD could be the catalytic subunit involved in the transfer of the amino group from free glutamine to the peptidoglycan precursor. The GatD sequence lacks an ATP binding motif which is common to all members of the GnAT family suggesting an activity that depends on the MurT protein which exhibits a typical Mur ligase central domain including the ATP binding motif. The structures of these two proteins by themselves and in complex will help confirm this model and understand the last missing genetic determinant to account for the structural variation in the S. aureus peptidoglycan. [4][5][6]
In order to determine the S. aureus GatD protein structure, the protein encoding region was
cloned into a pOPIN plasmid and expressed in E. coli Lemo21(DE3) as a N-terminal His-tag
fusion. The protein of interest was purified using the most common chromatographic methods: Immobilized metal ion affinity chromatography (IMAC) and Size-exclusion chromatography. The protein purity was estimated by polyacrylamide gel electrophoresis (SDS-PAGE), which showed a single band corresponding to the molecular weight of GatD. With a pure protein sample, crystallization trials were performed and several crystallization screens were used and positive hits were obtained using the Emerald Wizard I and II screen (Rigaku Reagents). Diffraction data were collected at Diamond Light Source – beamlines I02 and I04 – to a resolution beyond 1,9Å. Initial phases were obtained by single-wavelength anomalous diffraction (SAD) using data collected from SeMet derivatives at the Se edge peak. The crystals belong to the space group P212121 with unit-cell dimensions: a=48,29Å; b=93,00Å and
c=109,31Å. The preliminary structural analysis confirms the similarity of GatD to others
27 Part of the work described in this chapter, was the subject of the following publication:
D. Vieira, T. a. Figueiredo, A. Verma, R. G. Sobral, A. M. Ludovice, H. de Lencastre, and J. Trincao, “Purification, crystallization and preliminary X-ray diffraction analysis of GatD, a glutamine amidotransferase-like protein from Staphylococcus aureus peptidoglycan,” Acta
29
I.
Chapter I
X-Ray Protein Crystallography
“… the chemist of the future who is interested in the structure of proteins, nucleic acids,
polysaccharides, and other complex substances with higher molecular weights will come to rely
upon a new structural chemistry, involving precise geometrical relationships among the atoms
in the molecules …”
Linus Pauling, Nobel Lecture, 1954
Crystals have long been admired for their orderliness and their beauty. Their properties were scientifically explored from the 17th century. It took over one century of extensive research to
validate their inner structure, which was made possible only by the development of X-ray crystallography in the late 19th century.
X-rays were discovered in 1895 by Wilhelm Conrad Röntgen. Since then, X-rays have become an invaluable tool for the study of the atomic structures and properties of molecules.
The discovery of the structures of important biological molecules began in the late 1950s, with the structure of sperm whale myoglobin by John Cowdery Kendrew, followed by the DNA structure by J. Watson, F. Crick, R. Franklin and M. Wilkins, and Dorothy Hodgkin, who solved the structures of penicillin, vitamin B12 and insulin.
30
Overview of Protein Crystallography
Protein crystallography allows us to visualize protein structures at an atomic level, improving our understanding of protein function. The basic principle is the interaction of X-rays with the electrons in the atoms. In order to see molecules in atomic detail, electromagnetic radiation with a wavelength of the same order of magnitude of the chemical bond (around 0.1 nm or 1Å) needs to be used, in other words, X-rays. [7]
The bottleneck in this technique is the absolute need of a single crystal. The diffraction from a single molecule is still too weak to be measurable. To overcome this problem and amplify the signal to be measured an ordered three-dimensional array of molecules - a crystal – is required. The X-rays are then scattered by the electrons in the structure and, consequently, the result is a three-dimensional map representing the electron density of the molecule. To calculate electron densities from a diffraction experiment we need to gather information regarding i) the indices of a reflection (h,k,l); ii) the intensity of the reflection (Ihkl); iii) the phase angles of the reflection
(αhkl). The first two are obtained directly from the experiment. The indices are determined by the
crystal symmetry, the intensities are measured from the photons that reach the detector, whereas the phase angles depend on the atoms distance between the Bragg’s planes and the interference of the radiation diffracted by those planes. In this sense, the phases have to be further determined in order to calculate the electron density model. This missing piece of information and the way of recovering it is called “the phase problem” and a long part of crystallography is dedicated to solving it. [8][9]
There are several ways to recover the lost phases and they all involve acquisition of new data either from anomalous scattering by heavy atoms present in the structure or from the incorporation of new heavy atoms or by using a structure of a similar protein as a starting model. Once the phases are obtained, the preliminary model can be built into an electron density map which is little by little completed and refined. After the refinement is completed, the structure is validated and the coordinates are deposited in the PBD.
The global process is summarized on figure I.1.
31
Crystal Production
The first step in order to produce a protein crystal is the preparation of large enough quantities of protein (generally in the milligram range) in a highly purified form. This starting material can either be obtained from its natural source or expressed heterologously by gene cloning, followed by purification that includes one or more chromatographic steps. The key to a successful and reproducible crystallization is a highly soluble, pure and monodispersed (of a single multimerisation state) starting sample.
The most common method to evaluate the purification yield is by running a polyacrylamide gel electrophoresis (SDS-PAGE) and by the light absorbance at 280nm.
The production of a protein crystal is the most critical and, sometimes, the most time consuming stage in protein crystallography since it follows a trial and error principle. Due to the difficulty in predicting the ideal crystallization conditions, initial crystallization trials must be performed with different precipitants, concentrations, pH and temperatures. Two of the most used methods for protein crystallization are vapour diffusion - hanging drop and vapour diffusion - sitting drop methods (Figure I.2); both methods require a protein solution drop with buffer and precipitant to equilibrate with a reservoir solution containing buffers and precipitants at higher concentrations. As time goes by water evaporates from the drop in to the reservoir increasing the precipitant concentration to an optimal level for crystallization. With the system in equilibrium, conditions are kept until crystals appear in the drop.
A conventional explanation of crystal formation and growth is given by the crystallization phase diagram (Figure I.3). In a vapour diffusion experiment, water evaporates from the protein solution which will start to concentrate from the unsaturated zone to reach a supersaturated zone. After the first crystals appear, the protein concentration decreases and the crystals will grow until it reaches the solubility curve.
FIGURE I.2 –Vapour diffusion techniques: Hanging drop and sitting drop. Both methods require a protein solution
drop with buffer and precipitant to equilibrate with a reservoir solution containing buffers and precipitants at higher concentrations.
32 harvested with mother liquor with higher concentration of precipitant and then transferred to a cryo-protecting solution to prevent ice formation. To protect the crystals from radiation damage, these are cryo-cooled to ~100K and maintained in a stream of cold nitrogen during data collection. [10]
Once the crystal is obtained, harvested and cryoprotected, the next step is to mount it on a focused x-ray beam in order to be diffracted creating a reflection pattern that is recorded in the detector.
FIGURE I.3 - Crystallization phase diagram. Schematic representation of a phase diagram illustrating the variation
of protein concentration with the precipitating concentration.
Why do we need a crystal?
By definition, a crystal is a solid material whose constituents (atoms, molecules or ions) are organised in a well-ordered arrangement covering all three spatial dimensions that occur due to the intrinsic nature of molecules to form symmetric patterns. To build the crystal lattice we start with the asymmetric unit - the smallest possible unit cell spatial occupation. Applying crystallographic symmetry operations we obtain the unit cell - identical blocks that are repeated throughout the lattice and are characterised by the lengths of the cell edges (a,b and c) and the
angles between them (α, β and γ). The crystal is obtained therefore by the translation of the unit cell in all three spatial dimensions. [11]
33
Data Collection and X-Ray Diffraction
When a suitable macromolecular crystal is selected, the next step is to check if it diffracts X-rays and, when it does, if it is good enough to be used for structure determination.
The crystal structure described in this thesis was obtained from data collected at Diamond Light Source, Harwell Science and Innovation Campus, Didcot, United Kingdom (Figure I.5 on the left).
FIGURE I.4 - Schematic representation of an X-ray experiment. The X-rays are generated by a source. The crystal
mounted on the goniometer and when it’s hit by the X-rays, diffracts them. The diffracted beam is then recorded on a detector.
The scattered X-ray beam once it hits a crystal is a result from the interactions between the electric component of the beam and the electrons within the crystal structure. A unit cell contains a large number of electrons and the waves scattered by these electrons interfere with each other. [12]
Synchrotron radiation
A synchrotron works as a storage ring, where electrons move around in a circle, accelerated to nearly the speed of light wiggling through a set of magnetic fields, generating intense X-rays. When electron’s beam route is bent by magnets, the electrons lose energy in the form of light. This light is then channelled into the experimental stations, the beamlines, where users carry out their diffraction experiments (Figure I.5 on the right).
FIGURE I.5 – On the left: Diamond Light Source is the UK national synchrotron. On the right: Diamond
34 TABLE I.1 - Crystal systems and protein space groups.The space group is characterised by the number of lattice
points within the unit cell. P, C, I and F represent the four types of unit cell: primitive, end-face centered, body centered and face-centered. Adapted from [13]
Crystal system Cell length Cell angles Bravais lattices Space group
Cubic
𝑎 = 𝑏 = 𝑐
𝛼 = 𝛽 = 𝛾 = 90° P23, F23, I23, P2P432, P4232, F432, F413, I21132, I432, 3,
P4332, P4132, I4132
Trigonal (or
rhombohedral) 𝛼 = 𝛽 = 𝛾 ≠ 90°
P3, P31, P32,
P312, P321, P3112, P3121, P3212,
P3221
Tetragonal
𝑎 = 𝑏 ≠ 𝑐
𝛼 = 𝛽 = 𝛾 = 90° P4, P4P422, P421, P412, P42, P431, I4, I422, P411, 212, P4222,
P42212, P4322, P43212, I422, I4122
Hexagonal 𝛼 = 𝛽 = 90°
𝛾 = 120°
P6, P65, P64, P63, P62, P61,
P622, P6122, P6522, P6222, P6322,
P6422
Orthorhombic
𝑎 ≠ 𝑏 ≠ 𝑐
𝛼 = 𝛽 = 𝛾 = 90° P222, P2221, P21212, P212121, C2221,
C222, F222, I222, I212121,
Monoclinic 𝛼 = 𝛾 = 90°
𝛽 ≠ 90° P2, P21, C2
35 The highly accessible use of synchrotrons nowadays, explains the increasing number of structures deposited each day in the PDB. The major advantages are the speed of data collection, the data quality, and especially the intensity and collimation of the beam making possible to use even smaller crystals in the experiments, which is highly important for crystal that are extremely difficult to optimize.
Once an X-ray beam hits a crystal there are interactions between the electric component of the beam and the electrons within the crystal structure, resulting in a unit cell that contains a large number of electrons and waves that are scattered by these electrons and that interfere with each other. [12]
Bragg’s Law
In 1913, two physicists, William Lawrence Bragg and his son, William Henry Bragg, postulated a physical model to explain conditions where diffraction was observed. They realised that the arrangement of atoms within a crystal could be determined by the observation of the X-ray beams reflected by planes of atoms in that same crystal. [14]
FIGURE I.6 –Schematic representation of the Bragg’s Law.In this model, each set of parallel planes is treated as an
independent diffractor and produces a single reflection – constructive interference. Adapted from [7]
If λ represents X-rays’ wavelength, dhkl the perpendicular distance between planes, θ the angle
between the planes of the incident or reflected X-ray, and n is an integer, when the equation I.1
is obeyed then a diffraction pattern is obtained which means the waves emanating from this set of planes are in phase with each other – constructive interference. If the Bragg’s law isn’t obeyed, the waves aren’t in phase and no diffraction pattern is obtained – destructive interference. [15]
𝑛𝜆 = 2𝑑ℎ𝑘𝑙sin 𝜃 EQUATION I.1 - Bragg’s law diffraction equation.
Nonetheless, dhkl is a misleading element; it is not related to the atomic distances in the real
36 plane to a direction (h, k, ℓ) in the basis of the reciprocal lattice vectors and there is an inverse relationship between the crystal lattice (real space) and the reciprocal lattice – the spacing of reflections on the detector. [15]
FIGURE I.7 – Elementary representation of an X-ray experiment. A crystal when submitted to an X-ray beam
produces reflections which are recorded in the detector creating a diffraction pattern. The diffraction pattern is the result of a Fourier transformation of the crystal real space into reciprocal space and vice-versa.
In order to understand the relationship between the crystal (real space) and its diffraction pattern (reciprocal space), the crystallographer uses a computer that correlates the electron density within the unit cell with the list of reflection’s intensities. This mathematical relationship is described as the Fourier transform (Figure I.7). [7]
The data collection experiment allows the crystallographer to begin with information regarding the space group, the crystal unit cell measurements as well as the number of molecules in the asymmetric unit and consequently its volume can be calculated. Protein crystals contain solvent channels. The Matthews Coefficient allows predicting the number of molecules in the unit cell and the solvent content of the crystal. It is calculated using the unit cell parameters and the molecular weight of the molecules present in the unit cell, according to the following equation: [16][17]
𝑽𝑴= 𝒁. 𝑴𝑽
EQUATION I.2 - Calculation of VM (Matthew's coefficient). Units: Å3Da-1. In this
equation, V represents the volume of the unit cell (Å3), Z is the number of asymmetric
units and M is the molecular weight of the asymmetric unit contents (Da). [17]
37
Electron Density and Structure Determination
In order to determine a three-dimensional structure we first need to obtain the best possible electron density map. We then have to interpret the map to build the atomic model.
The diffraction pattern corresponds to the square root of the measured intensities of the structure factors (Fhkl). By definition, the structure factor is a wave created by the superimposition of
many single waves described as Fourier series.
In order to calculate an electron position (x,y,z) in the real space we need to sum all the hkl
planes’ contributions to that particular point as well as the phases (Equation I.3). [8]
𝜌(𝑥, 𝑦, 𝑧) =1𝑉∑|𝐹ℎ𝑘𝑙| 𝑒(𝑖𝛼ℎ𝑘𝑙)𝑒(−2𝜋𝑖ℎ𝑥+𝑘𝑦+𝑙𝑧)
EQUATION I.3 - Electron density equation 𝜌(𝑥, 𝑦, 𝑧) is given by a Fourier transform of the sum functions
describing the atoms positions (x,y,z) in the crystal. V is the unit cell volume; 𝐹ℎ𝑘𝑙correspondsto the structure factor
amplitude and is experimentally obtained; 𝛼ℎ𝑘𝑙is the phase angle which is not obtained directly from the diffraction
experiment – phase problem. [8]
And since the phase information cannot be measured directly, the Fourier transform cannot be simply applied in order to get the electron density. This fact is known as the phase problem.
The Phase Problem
When a crystallographer says he has determined a structure, he is actually saying that he solved the phase problem, meaning he has obtained enough phase information to calculate an interpretable electron density map.
The phase problem has to be solved in order to determine a structure from its diffraction data and to do so, the used techniques provide estimated phases that are obtained through additional experimental information: i) heavy atoms derivative crystals (Isomorphous Replacement), ii) anomalous diffractors (Anomalous Scattering) or iii) using homologous structural molecular models (Molecular Replacement). [18]
In the first two methods, a normal experiment is conducted, where the electrons in the crystal vibrate in concordance with the incident beam; however, if the incident beam has photons which can take the electrons to a transition state, the vibrational energy changes and re-irradiates in a different phase from the incident beam. [8]
38 giving the reflections in the heavy-atom data – FPH and the difference between the derivative
and native structure factors is calculated and the phase obtained.
𝐹
ℎ𝑘𝑙= ∑ 𝑓
𝑖. 𝑒
2𝜋𝑖(ℎ𝑥𝑖+𝑘𝑦𝑖+𝑙𝑧𝑖) 𝑛𝑖=𝑙
FIGURE I.8 –Structure factor equation and schematic representation (F). Fhkl is a mathematical relation of the
scattering factor and the positional terms of each atom; is represented as a vector which length is the intensity of the
reflection (F ∞ √𝐼) and α is the phase angle. Adapted from [7]
The choice of wavelengths above and below the absorption edges of the scatterer is possible due to the availability of tuneable beams at synchrotrons, where measurements can be made precisely at a chosen wavelength.[15]
The most common method to obtain the phases from anomalous scattering, and the one used in this thesis, is the replacement of the amino acid methionine for selenomethionine and the overexpression of the protein of interest in a specific system.[19]
Once the initial phasing is complete, the electron density is interpreted by fitting amino acids into it, forming a preliminary model of the protein. This initial protein model is generally very crude and mostly incorrect. It still needs to be refined to be validated as a final model. The refinement methods are very important in crystallography as they allow the improvement of the phases and, consequently, a more precise interpretation of the electron density map.[20]
Refinement, Validation and Publication
After model building, the atomic coordinates are refined in order to fit the experimental diffraction data as best as possible. In order to statistically measure the adjustment between the observed reflection amplitudes and those calculated from the model, crystallographers take into account the R-factor (Equation I.4). [21]
𝑹 =∑||𝑭𝒐𝒃𝒔∑|𝑭| − |𝑭𝒄𝒂𝒍𝒄|| 𝒐𝒃𝒔|
39 To avoid data bias, a cross-validation scheme is used. This scheme represents the Rfree, which is
calculated with a small portion of the observed reflections that are not used in the refinement, commonly 5 to 10% of the observed data. [21]
Whilst the R factors judge how well the model fits the experimental data, there are other parameters that evaluate the quality of the model. The B-factor, which relates the thermal vibration of an atom in its position, the signal-to-noise ratio and the data completeness are important to crystallographers. [22]
In addition, to validate a newly solved protein structure, the chemistry behind the secondary structure needs to be accurate. For that reason, the Ramachandran plot is a good approach to evaluate the presence of outliers. This bioinformatics tool checks the ψ and φ angles around the Cα of each amino acid, the atom responsible for the protein fold. [23]
41
II.
Chapter II
II.1. mRNA localization mechanisms in
Drosophila melanogaster
“I immediately loved working with flies. They fascinated me, and followed me around in my dreams.”
Christiane Nüsslein-Volhard, Nobel Prize, 1995
Drosophila melanogaster
Drosophila melanogaster, also known as the common fruit fly, is an insect that lives in a wide
range of habitats. It is a valuable organism for biological research, especially in genetics and developmental biology. It is a small animal with a short lifespan of only two weeks, cheap and easy to breed in captivity. In this sense, Drosophila has been used as a model organism for
almost a century. In addition, nowadays it’s a well understood model since its entire genome has already been sequenced. [25]
Drosophila developmental
process
Fertilization is the initial step in the development process. It takes about 10 days since the egg fertilization until the establishment of an adult fly. However, between the events of fertilization and organ differentiation, two important steps occur: gastrulation and cleavage. During these two critical stages, the major axes of the embryo are determined and the cells begin to migrate to their final destinations. [26]
There are two axes that need to be specified: the anterior-posterior (AP) and the dorsal-ventral (DV). The AP axis is responsible for the correct position of the head and tail, and the DV axis is responsible for back and abdomen location (Figure II.1). [27]
The polarity of the fly has its origin in the egg. It is due to two mRNA products of maternal effect genes, the bicoid (bcd) and oskar (osk) mRNAs that are placed in opposite regions of the
egg creating a gradient (Figure II.2). [2][3]
FIGURE II.1 –Representation of the axis that define Drosophila body pattern:
Anterior-Posterior (A→P) and dorsal-ventral (D→V). Image adapted from
42 Parallel interaction at the anterior and posterior poles of the egg with several other determinants establishes the patterning of the Drosophila embryo. At the anterior end bicoid mRNA is
translated and produces a protein gradient that is responsible for the outline of the embryo’s head and thorax. At the posterior end oskar mRNA is translated into Oskar protein, which
recruits the abdominal determinant, nanos mRNA. [28][29] Despite the fact that several factors
required for oskar and bicoid mRNA localization have been identified, this is still a poorly
understood mechanism, whereas the proposed model encompasses the formation of ribonucleoprotein (RNP) particles, transport along the cytoskeletal components and posterior anchoring of the mRNA on its final destination. [2][30][31]
FIGURE II.2 –Maternal effect genes that establish polarity creating a protein gradient throughout the oocyte.The
four genes: hunchback (hbc), caudal (cdl), bicoid (bcd) and nanos (nos) are transferred from the ovarian nurse cells
into the oocyte: bicoid is trapped in the anterior pole while nanos is transported into the posterior pole. When
translated, Bicoid protein creates a gradient A→P whilst Nanos protein creates an inverse gradient P→A. Caudal and Hunchback proteins gradient are responsible for the inhibition of the bcd and nos translation. Adapted from [32]
The general body plan is the same in the embryo and in the adult fly and each segment has its own identity. For instance, the thoracic segment has only legs, the second thoracic segment has legs and wings, and the third thoracic segment has legs and halteres (Figure II.3).
43
mRNA localization mechanisms
mRNA localization and translational control are coupled processes that cooperate to target proteins to specific locations within the cell. Localizing proteins through their mRNA has several advantages; the main advantage is the expression of a targeted protein in restricted areas of the cytoplasm thus preventing it from being present elsewhere. This aspect is extremely important in the case of cytoplasmic determinants which may alter the developing pattern of the embryo if expressed in the wrong place. [33]
In Drosophila, mRNA is transported from the nurse cells into the oocyte and, once in the
cytoplasm, the highly polarized system of motor transports is responsible for the proper localization of the maternal mRNAs throughout the oocyte. The pathway by which all this transport happens and how the mRNAs reach their destinations is poorly understood even though it is believed that these RNAs are recognized by diverse proteins and use different transport mechanisms. Numerous genetic characterization experiments have been performed but only few biochemical studies of the proteins are available. [29][34][35]
The latest and most extensive genetic study is more than 10 years old and stated undoubtedly that the transport or bcd and osk mRNA involves a large RNAse-sensitive complex with at least
seven proteins. [31]
In this thesis, we aimed to determine the protein structure of two of the proteins identified in this RNP particle. The proteins of interest are Exuperantia (Exu) and Ypsilon-Schachtel (Yps).
Exuperantia and Ypsilon-Schachtel
EXUPERANTIA
is a novel protein which is a core component of the protein complex involved in the localization of mRNA within the nurse cells and oocyte, however, all of the genetic studies involving Exu have not determined if it is directly involved in the transport of the RNAs or if it has an indirect role. [35]Temporal and spatial distribution of the Drosophila maternal effect gene - exu - shows that
Exuperantia is needed for the proper localization of the bcd RNA during the formation of
oocytes but not for its maintenance. bcd mRNA is synthesized in the nurse cells and transported
to the anterior pole of the oocyte by a microtubule-dependent mechanism mediated by Exuperantia. [36]
44 injection of polyclonal anti-Exu serum allow inferring that Exu is deposited at the anterior pole of the oocyte by the nurse cells and this is followed by diffusion within the oocyte. [36]
Besides its role in the AP polarity of the developing oocyte, exu is required for Drosophila
spermatogenesis encoding sex-specific transcripts. [37][38]
FIGURE II.4 –Distribution of Exuperantia protein in Drosophila wild-type egg chambers. A-D: Representation of
the developing oocyte where the nurse cells are on the left. Image adapted from [36].
Nowadays, the Exuperantia role in the mRNA transport and localization is still a mystery. It has been proposed that Exu may modify a component that binds bcd mRNA or bcd itself or it may
be directly involved in docking bcd message at its site of localization in the developing oocyte.
[1][33][36][39]
Further studies of cloning, expression, purification and protein crystallization will allow to obtain the 3D structure of Exuperantia which will be a crucial step in answering some questions concerning the role of Exu in the oocyte.
Figure II.5 represents a basic local alignment showed ~30% sequence homology with three proteins: Integrator complex subunit 1 from Mus musculus (INT1_MOUSE) and Homo sapiens
(INT1_HUMAN) and with Lipid II:glycine glycyltransferase from S.aureus (FEMX_STAAB). The multiple sequence alignment analysis shows the existence of 5 conserved residues among prokaryotic and eukaryotic species even though they are not related to any identified conserved domain.

![FIGURE II.5 - Basic local alignment of Exuperantia amino acid sequence with its homologous based on NCBI Blast [40], [41] and possible PEST (Proline-Glutamate-Serine-Threonine) sequence based on EMBOSS epestfind](https://thumb-eu.123doks.com/thumbv2/123dok_br/16489692.733098/47.892.128.779.105.450/alignment-exuperantia-sequence-homologous-possible-glutamate-threonine-epestfind.webp)