Procedia Computer Science 14 ( 2012 ) 65 – 73
1877-0509 © 2012 2012 The Authors. Published by Elsevier B.V. Selection and/or peer-review under responsibility of the Scientifi c Programme Committee of the 4th International Conference on Software Development for Enhancing Accessibility and Fighting Info-exclusion (DSAI 2012) doi: 10.1016/j.procs.2012.10.008
Proceedings of the 4th International Conference on Software Development for Enhancing Accessibility and Fighting Info-exclusion (DSAI 2012)
Indoor localization and navigation for blind persons using visual
landmarks and a GIS
M. Serrão
b, J.M.F. Rodrigues
a,*, J.I. Rodrigues
c, J.M.H. du Buf
a a Vision Laboratory, LARSyS, University of the Algarve, 8005-139 Faro, Portugalb Instituto Superior de Engenharia, University of the Algarve, 8005-139 Faro, Portugal c CIMA, University of the Algarve,8005-139 Faro, Portugal
Abstract
In an unfamiliar environment we spot and explore all available information which might guide us to a desired location. This largely unconscious processing is done by our trained sensory and cognitive systems. These recognize and memorize sets of landmarks which allow us to create a mental map of the environment, and this map enables us to navigate by exploiting very few but the most important landmarks stored in our memory. We present a system which integrates a geographic information system of a building with visual landmarks for localizing the user in the building and for tracing and validating a route for the user's navigation. Hence, the developed system complements the white cane for improving the user's autonomy during indoor navigation. Although designed for visually impaired persons, the system can be used by any person for wayfinding in a complex building.
© 2012 The Authors. Published by Elsevier B.V.
Selection and/or peer-review under responsibility of Scientific Programme Committee of the 4th International Conference on Software Development for Enhancing Accessibility and Fighting Info-exclusion (DSAI 2012)
Keywords: Navigation; Accessibility; Vision; Blind; Geographic information system.
1. Introduction
Finding an office or a room in a large public building, such as a university, a city hall or a shopping center, is often difficult for normal persons. For blind persons it is far more difficult because they must completely rely on people passing by to ask for information. Even when a building is becoming more familiar, they need to memorize all locations for moving about.
* Corresponding author. Tel.: +351 289800100; fax: +351289888405.
E-mail address: [email protected].
© 2012 The Authors. Published by Elsevier B.V. Selection and/or peer-review under responsibility of the Scientifi c Programme Committee of the 4th International Conference on Software Development for Enhancing Accessibility and Fighting Info-exclusion (DSAI 2012)
There are several systems which try to alleviate the problems of blind and visually impaired persons. Drishti [1] is an in- and outdoor navigation system. Outdoor it uses DGPS localization to keep the user as close as possible to the central line of sidewalks. It provides the user with an optimal route by means of its dynamic routing facility. The user can switch the system from out- to indoor operation with a simple vocal command, which activates a precise ultrasound positioning system. In both cases the user gets vocal prompts which alert to possible obstacles and which provide guidance while walking about. CASBliP or Cognitive Aid System for Blind People [2] was a European Union-funded project. Its main goal was to develop a system capable of interpreting and managing real-world information from different sources in order to improve autonomous mobility. Environmental information from various sensors is acquired and transformed into enhanced images for visually impaired users, or into acoustic maps via headphones for blind users. SmartVision: active vision for the blind [3] was a project funded by the Portuguese Foundation for Science and Technology. Its prototype is an in- and outdoor navigation system with different modules which integrate GPS and WiFi localization with a geographic information system (GIS) database, passive RFID tags in sidewalks, and computer vision for path centering and obstacle avoidance.
Schmitz et al. [4] developed a navigation system that seamlessly integrates static maps with dynamic location-based textual information from a variety of sources. Each information source requires a different kind of acquisition technique. All acquired information is combined by a context management platform, and then presented to the user as a tactile or acoustic map depending on the sources available at the current position. Positioning is achieved by a combination of an inertial tracking system, RFID technology and GPS, and the user is guided to a desired destination by speech output and a haptic cane. In [5] an algorithm is presented to recognize landmarks suitably placed on sidewalks. The proposed algorithm uses a combination of Peano-Hilbert space-filling curves for dimension reduction of image data and ensemble empirical mode decomposition (EEMD) to pre-process images, which yields a fast and efficient recognition method.
In this paper we present a system which integrates data of a GIS of a building with detection of visual landmarks. Any normal camera can be used together with a small, portable computer like a netbook. GIS/vision-based localization is complemented by navigation: at any time, the system traces and validates a route from the current position to a given destination. Although designed for being integrated in the Blavigator prototype (from blind navigator, a follow-up project of SmartVision), this system can be used by any person who wants to navigate in a complex building. The main contribution is the integration of existing GIS data with visual landmarks (staircases, doors, fire extinguishers, etc.) for localization and navigation.
2. The prototype and the geographic information system
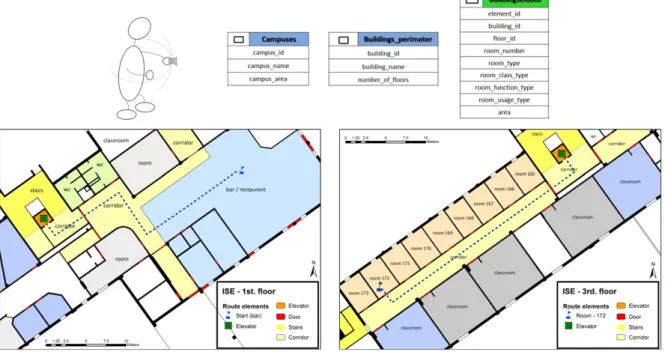
For the validation of the concept, the prototype was developed on a netbook with a standard WiFi webcam. It was tested at the Institute of Engineering (ISE) of the University of the Algarve (ISE/UAlg). The user holds the camera in his hand. In the case of the SmartVision [3] and Blavigator prototypes, the camera is worn at the chest. However, the prototypes are also being implemented on a SmartPhone, such that its camera can be easily pointed in different directions. In case of an uncertain user location due to missing or ambiguous visual landmarks, the user can point the camera to different directions by rotating it 180º horizontally and about 45º vertically; see Fig. 1 (top-left). Any detected landmarks are matched against those in the GIS for each room, corridor, etc. By combining the detected landmark position with the traced route, the user is informed about the current location by a speech module. Finally, since the GIS/landmark system must be integrated in the SmartVision/Blavigator prototype, all visual functions have been optimized for small CPU time and memory usage, and most visual functions are based on a few basic algorithms which are employed only once for each video frame.
Geographic information systems comprise tools for the processing, analysis, modeling and storage of spatial data [6]. The growth of location-based services and ubiquitous computing is nowadays also leading to more
indoor applications. In addition, many buildings like airports, shopping malls and hospitals have become bigger and also more complex, more indoor GIS databases are becoming available for different applications, and increasingly more persons of the ageing population need more assistance in finding a destination, both in- and outdoor [7].
GIS data can be structured in raster and in vector formats. The GIS of ISE/UAlg employs vectorial data. The main purpose of this GIS is the management of indoor spaces, with support for security and emergency preparedness. The database model is illustrated in Fig. 1 (top). It includes three main classes Campuses,
BuildingsPerimeter and BuildingsIndoor. The data sets Campuses and BuildingsPerimeter are mainly for
outdoor purposes: Campuses provides data about the areas and groups of buildings, whereas
BuildingsPerimeter specifies the area and position of each building, its name, and the number of floors. BuildingsIndoor details all different spaces of each building. These include structural components like walls,
doors and windows, circulation areas like corridors, stairs, elevators and ramps, and rooms. The latter are classified by their class, function and usage, for example office, classroom, lecture amphitheater, laboratory, library and bar. The bottom of Fig. 1 shows two partial maps of the 1st and 3rd floors of the ISE/UAlg building, including an example of a route which starts in the bar and goes to room number 172.
The system's component which handles spatial data was developed by using the OGR Simple Features
Library. OGR is a part of GDAL ! the Geospatial Data Abstraction Library. OGR/GDAL is a project
supported by the Open Source Geospatial Foundation (OSGeo) [8].
Fig. 1. Top, left to right: user with the hand-held camera and the top three database levels. Bottom: two partial maps of the ISE/UAlg building with two routes (dashed) on two floors linked by an elevator.
3. Landmark detection
Having information about the spatial layout of the building, it is necessary to discriminate all different spaces. This can be done at a first level by localizing doors, windows, stairs and elevators, but this is not enough. When in an unfamiliar building, we instinctively spot many details like signs which characterize the
local spaces. This is very useful information which, after repeated encounters, helps us to go more directly to a specific destination. Landmarks such as signs must also be memorized for building our internal map, like SLAM (simultaneous localization and mapping) in robotics, e.g. [9].
Inspired by this idea we retrieved all useful landmarks like objects, signs and tags and included them in the GIS. Although anything can be stored in a GIS, it is not common to include things like flowerpots, lockers, garbage bins and vending machines. These may be important landmarks for human localization, but not interesting for the usual GIS user. Hence, for a first prototype version we selected more “permanent” landmarks such as fire extinguishers, exit and WC signs in order to complement doors, stairs and elevators. Figure 2 (bottom) shows more examples. For detecting these special landmarks we use the OpenSURF (Speeded-up Robust Features) library [10]. The SURF algorithm detects objects by finding correlations with templates. The attributes and points of interest of an object are invariant to scaling, rotation, distortion and illumination. As a consequence, it is possible to identify objects almost regardless of their location, position or rotation. Nevertheless, it is necessary to build a database of templates of each object as seen from several perspectives.
Although SURF is not computationally demanding, it is necessary to limit the search space of objects to small areas of interest instead of analyzing entire images. In the case of robotics we applied Nick's Machine Perception Toolbox [11] for generating saliency maps. By thresholding these and by creating bounding boxes, region sizes can be limited to areas with possible objects [9]. Here we simplified the algorithm, because (i) being an indoor space of a public building, most walls are white and even if they have a different color they are quite homogeneous, and (ii) most signs and selected objects have rather pure and saturated colors. For these reasons we apply a simple segmentation by color in RGB space.
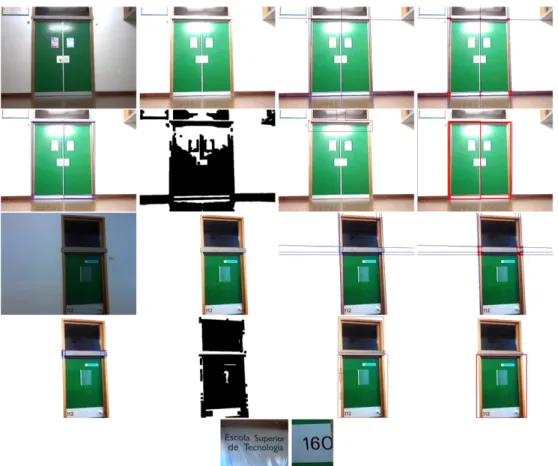
In a pre-processing step we compute the color histogram and determine the dominant color of each object and sign, and segment the image using this color and an interval of ±25. The segmented region is dilated with 30 iterations, which eliminates gaps due to other colors. The minimum and maximum coordinates in x and y of the dilated region is used as bounding box. Finally, to the region delimited by the bounding box the SURF algorithm is applied to characterize the object. The top two rows of Fig. 2 illustrate, from left to right, the processing steps.
Fig. 2. Top two rows, left to right: input images, color segmentations after dilations, bounding boxes and SURF's interest points. Bottom row: examples of more templates.
4. Door detection and classification
In general, detection of doors is not quite trivial because there are different types with different frames, also with different geometries if viewed non-orthogonally. In our case the problem is easier because the GIS
information can be used to inform the user about expected door positions and he can rotate the camera until it is more or less orthogonal to the wall. This means that approximately rectangular shapes must be detected, although ongoing work already addresses oblique views.
The door algorithm employs two types of rectangle detectors for increasing robustness: (1) We apply the Hough transform to edges detected by the Canny algorithm. After selecting vertical and horizontal edges, the intersections are detected and rectangular shapes are analyzed. (2) An unsupervised binary segmentation is checked for rectangular shapes. Both algorithms must detect the same rectangle before a candidate door is subjected to final verification.
Some indoor scenes can be a bit dark due to low illumination levels. For this reason the average frame intensity is computed and image brightening can be applied. Let
I
i( y
x
,
)
be a (brightened) input frame. We then apply an unsharp masking filter to sharpen the image, which yields Ihf. In the next step, the Canny edge detector [12] is applied with parameters ! =1,T
l=
0
.
25
andT
h=
0
.
5
. This results in Ib, to which the Houghtransform 13 is applied, yielding the edge histogram
I
H( !
∀
,
)
. We are only interested in (almost) horizontal and vertical edges, so the following orientation windows are applied:|
90
º
#
I
H(
∀
,
!
)
|
<
T
!for horizontal edgesand
|
0
º
#
I
H(
∀
,
!
)
|
<
T
! for vertical ones, both withT
!=
20
º
. To determine the intersections of two edges wesimply apply the equations
∀
1=
x
cos(
!
1)
+
y
sin(
!
1)
and∀
2=
x
cos(
!
2)
+
y
sin(
!
2)
. All intersection points aregrouped in sets that define rectangular shapes. The above processing steps related to method (1) are illustrated in Fig. 3: the top row shows, from left, Ii, Ihf, Iband all detected intersections. The left image on the second row shows detected rectangles, in this case belonging to a double door. The corresponding images on the 3rd and 4th rows show results in the case of a partial view of a single door. The remaining three images on the 2nd and 4th rows illustrate processing using method (2); see below.
Method (2) is based on K-means clustering with only two classes and a segmentation by using minimum-distance pixel classification to the two class centers. The next step consists of searching for rectangles in the binary image, i.e., connected regions of pixels (black in this case). Rectangles extracted by this method are validated as door candidates if they are delimited by two vertical edges and a neighboring horizontal one. The right three images on the 2nd and 4th rows of Fig. 3 show segmentation results, detected rectangles, and selected ones.
Door candidates (DC) found by the two methods are further screened in order to eliminate all rectangles which are not likely part of a door, assuming that doors have a height H greater than their width W and occupy a substantial area A of the image. All door candidates that do not satisfy the relations
A
DC!
T
A and(
H
DC/
W
DC)
!
T
R are ignored. The area thresholdT
A=
16
%
of the total number of pixels of the image and the ratio thresholdT
R=
1
.
2
.After a door has been detected, it still must be recognized. In public buildings most doors are identified by a sign or a text label. This is very important because (a) the user may want to go to a specific room and (b) in corridors with several doors the GIS can be used for localization.
Recognition of common signs on doors is solved by landmark recognition (Section 3). For text recognition we apply “Tesseract-OCR”[14]. Originally developed by Hewlett-Packard, it is now supported and maintained by Google. This application is free for academic and commercial use. Tesseract accepts an input image and returns a text file with the OCR result. Although Tesseract has mechanisms for correcting spelling errors, there still remain errors in the form of fractions of invalid text. Hence, there still is a need for post-processing in order to obtain useful and valid information. For example, the bottom row of Fig. 3 shows two texts on doors in the ISE/UAlg building. Tesseract creates the following two strings: “Escola Superiorde Tecno\og'\a” and “-\160'i''. Both strings are partly correct but contain snippets of invalid text. This problem was solved by developing an algorithm which isolates and corrects each word, using pre-defined words in a reference database. This database is created dynamically from the GIS information, and consists of existing labels of the space where the user is located. Normally these are less than a few dozens of words.
The correction algorithm first eliminates all non-alphanumeric characters, and then compares the remaining character string, starting with the first character or the first one after a detected and validated word, with all words in the database. If the number of matching characters is bigger than about 80% of a word, the substring is substituted by the word in the database. In nearly all cases, including the texts on the bottom row of Fig. 3, the result is correct.
Fig. 3. Top row, from left: input image, brightened and sharpened image, detected horizontal and vertical edges, and intersection points. Second row: detected rectangles of method (1), plus segmented image, detected rectangles and selected ones of method (2). Third and
fourth rows: another door. Bottom row: examples of texts extracted from doors.
5. Detection of stairs
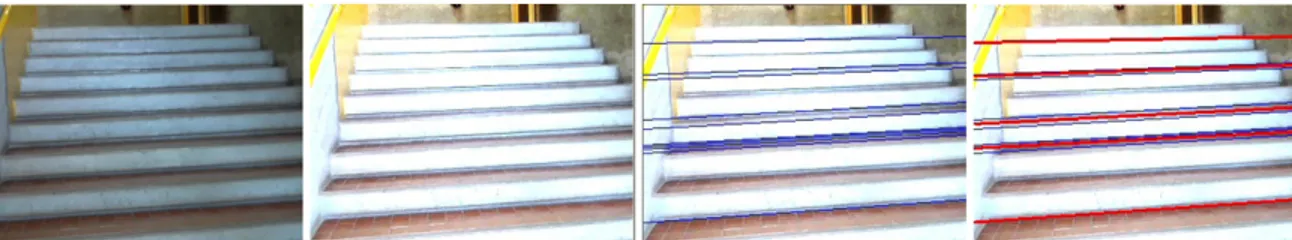
Stairs consist of a series of steps with almost parallel edges. The distance between the edges varies almost linearly, but the edges may not be horizontal because of the hand-held camera. First processing equals that in the case of the detection of doors: brightening if necessary, followed by sharpening; see Fig. 4. Also Canny's edge algorithm and the Hough transform are applied, but now we are only interested in the almost horizontal lines for which
|
90
º
#
I
H(
∀
,
!
)
|
<
T
!
with
T
!=
10
º
. The result is shown by the blue lines in Fig. 4, the 3rd image from left.Horizontal and vertical surfaces of the steps may consist of differently colored or textured materials. In order to eliminate possible errors which are caused by the different materials, and to improve edge periodicity, it is necessary to apply a minimum threshold to the distances between the edges which mark parts of individual steps. After analyzing many different stairs, we apply a minimum distance of 5% of the frame height. If the
distance between two edges (blue lines) is bigger than the minimum distance, the edges are kept. All edges with a smaller distance are discarded and replaced by only one edge with the average vertical position and orientation of the discarded edges. The result is shown by the red lines in the rightmost image of Fig. 4.
Final stair detection is based on two tests. In the first one, the average and standard deviation of the distances between the remaining edges are computed, but only if there are more than four edges (or red lines). A low standard deviation indicates a better periodicity and therefore a higher likelihood of a stair in the image.
The ratio of the average ∝s and standard deviation ! s is thresholded, i.e.,
R
s=
∝ /
s!
s>
T
swith an empirically determined thresholdT
s=
2
. If true, the periodic edge pattern has passed the first test. However, there are more objects and wall patterns with almost horizontal and periodic edges, like a bookcase with several shelves. We therefore apply a second test in order to exclude such objects. Final stair confirmation is obtained by checking that the distance between the horizontal edges is a linear function of their height in the image: due to perspective camera projection, step height at the bottom is larger than that at the top. In the case of the example shown in Fig. 4, the edges pass the first test but not the second. Hence, this specific frame is not considered to contain stairs, but in other frames the second test was also successful. Again, the user can be informed about likely objects which can be encountered at the actual location, and knowing that stairs is one option and that these require a more precise pointing of the hand-held camera, the user can also adapt to the system.Fig. 4. Left to right: example image with stairs, brightening and sharpening, detected horizontal edges and final steps detected.
6. Navigation
Being able to detect doors, stairs and many objects and signs, and by including their positions in the database, the GIS can be used for route planning and user localization. These are described below.
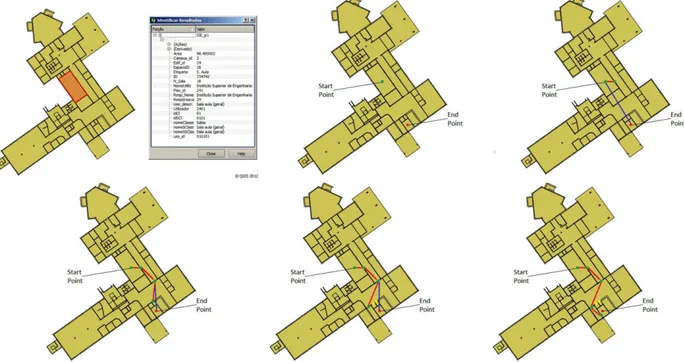
As already mentioned, we can use maps based on the GIS of the ISE/UAlg building for user navigation. Data from the GIS system is retrieved by using GDAL (see Section 2). GDAL allows to extract all information concerning geographical divisions, landmarks and structures such as walls, doors and windows. The top-left map in Fig. 5 shows one room highlighted in red, and the table next to it lists additional information of that room. It is also possible to integrate specific landmarks like objects and signs at different GIS layers. All information can be used to create a map which is suitable for navigation, such as: in division X there are four walls, one window in the wall opposite to the door, a fire extinguisher at the left side of the door, an exit sign to the right, etc. In addition, it is straightforward to determine a representative location of each room on the basis of the geometric centroid. Figure 5, top middle, illustrates two locations by the green and red dots. This example will be used to illustrate path planning, where these dots are initial start and end points.
Specifically for navigation, a data structure (section) was created. This relates data of, for example, a room with its neighboring spaces: room X has one door which connects to room W, and another door which connects to corridor V. In turn, room W has only one door which connects to room X, and so on. These neighborhood relations are very important and useful for path planning between start and end points on the same floor. If a desired destination is on another floor, as illustrated in Fig. 1, the closest elevator or staircase on the actual floor will be selected as end point, and the elevator or staircase will be a new start point on the new floor.
Figure 5 illustrates, from left to right and top to bottom, the 1st floor of the ISE/UAlg with all the steps for building a valid route between the start and end positions, i.e., the green and red dots. Step by step, the straight route (blue lines) are substituted by real routes (red lines), first through an existing door, then to the end of the corridor, across the hall to the “entrance” of the other corridor, etc. Please note that the two yellow dots in Fig. 5 mark doors of spaces without access of normal persons (electric installation, air conditioning), and these are therefore omitted.
Once a valid route has been built, the special data structure for path planning which also holds the final path can be integrated with the GIS which holds, apart from all divisions etc., also all registered landmarks: doors, stairs, elevators and all kinds of signs. In other words, the system knows where the user is assumed to walk, but it cannot be sure about the actual location. In addition, the user can change his mind and decide to go to another destination.
The vision system is always active, analyzing incoming image frames for landmarks. Every time it detects and recognizes a landmark, the landmark's type is checked in the GIS at the current location, i.e., the assumed space or division. If its type can be confirmed, the current location is also confirmed. If not, then the neighboring divisions are tested by using the last part of the traced route. In case of doubts, the user is instructed to point the hand-held camera slowly into different directions while standing or slowly walking about. Please recall that a blind person will always use the white cane; this system only complements the white cane for indoor navigation.
A division is recognized or confirmed if at least three landmarks can be confirmed in the GIS. If less than three have been confirmed, all neighboring spaces with those landmarks are checked and memorized as likely locations, until a third landmark is encountered. In the case that absolute certainty cannot be obtained, the region formed by the (assumed) actual and neighboring spaces is enlarged by applying an increasing circular area in the GIS and checking the most recently detected landmarks in this area. Also most likely errors are checked, like an elevator which was detected as a door but which is represented as an elevator in the database.
7. Discussion
We presented a system which integrates an indoor GIS of a building with visual landmarks detected by a normal, hand-held camera. It serves to improve the user's autonomy in finding a destination. Visual landmarks are used to localize the user, and routes to the destination are dynamically updated by tracing detected landmarks. The system was designed such that it can easily be integrated in the “Blavigator” prototype. The latter is already able to detect valid paths and any obstacles for local navigation. The system presented here complements local navigation with global navigation, although only indoor.
The system works in realtime on a netbook computer and it was tested successfully in the ISE/UAlg building. Most planned routes could be followed from the start to the destination, even when these were on different floors. The few which caused a problem were due to a lack of landmarks at a certain location. However, after finding a new start position by walking about to a location with multiple landmarks, the updated routes could also be accomplished.
Ongoing work concerns (1) including more landmarks in the database such that all spaces can be covered more densely, (2) detecting doors and stairs from oblique viewing angles, such that the user can limit the pointing angles of the camera to ±45º from the front, and (3) developing a speech-based interface with queries and messages which replaces the provisional one based on different beeps. The final goal is a system which only employs a SmartPhone with a built-in camera, worn by a strap around the neck.
Acknowledgements
This work was partly supported by the Portuguese Foundation for Science and Technology (FCT), project PEst-OE/EEI/LA0009/2011 and project Blavigator RIPD/ADA/109690/2009.
References
[1] Ran, L., Helal, S., Moore, S., Drishti: an integrated indoor/outdoor blind navigation system and service, In Proc. 2nd IEEE Annual Conf. On Pervasive Computing and Communications 11 (6), 2004, p. 23 – 30.
[2] CASBliP, Final activity report of the EU-funded CASBliP project, http://casblipdif.webs.upv.es, 2009.
[3] du Buf, J.M.H., Barroso, J., Rodrigues, J.M.F., Paredes, H., Farrajota, M., Fernandes, H., José, J., Teixiera, V., Saleiro, M., The SmartVision navigation prototype for blind users, JDCTA: International Journal of Digital Content Technology and its Applications 5 (5), 2011, p. 351 – 361.
[4] Schmitz, B., Becker, S., Blessing, A., Matthias, G., Acquisition and presentation of diverse spatial context data for blind navigation, In Proc. IEEE 12th Int. Conf. on Mobile Data Management, 1, 2011, p. 276 – 284.
[5] Costa, P., Fernandes, H., Vasconcelos, V., Coelho, P., Barroso, J., Hadjileontiadis, L., Landmarks detection to assist the navigation of visually impaired people, In Proc. 14th Int. Conf. on Human-computer interaction: towards mobile and intelligent interaction environments 3, 2011, p. 293 – 300.
[6] Goodchild, M., Geographic information systems and science: today and tomorrow, In Proc. Int. Conf. on Mining Science & Technology 1 (1), 2009, p. 1037 – 1043.
[7] Worboys, M., Modeling indoor space, In Proc. 3rd ACM SIGSPATIAL Int. Workshop on Indoor Spatial Awareness, 2011, p. 1 – 6. [8] GDAL Development Team, GDAL - geospatial data abstraction library, version 1.9.0, open source geospatial foundation,
http://www.gdal.org, 2011.
[9] Saleiro, M., Rodrigues, J.M.F., du Buf, J.M.H., Minimalistic vision-based cognitive SLAM, In Proc. 4th Int. Conf. on Agents and Artificial Intelligence, Special Session Intelligent Robotics (ICAART-SSIR2012), Vilamoura, Portugal 1, 2012, p. 614 – 623. [10] Evans, C., Notes on the OpenSURF Library, Tech. Rep. CSTR-09-001. University of Bristol, http://www.chrisevansdev.com, 2009. [11] Butko, N., Zhang, L., Cottrell, G., Movellan, J., Visual salience model for robot cameras, In Proc. IEEE. Int. Conf. on Robotics and
Automation, 2008, p. 2398 – 2403.
[12] Canny, J., A computational approach to edge detection, IEEE Trans. Pattern Anal. Mach. Intell. 8 (6), 1986, p. 679 – 698. [13] Duda, R., Hart, p., Use of the Hough transform to detect lines and curves in pictures, Comm. ACM 15, 1972, p. 11 – 15. [14] Tesseract-ocr, http://code.google.com/p/tesseract-ocr/, 2011.