1
A Work Project, presented as part of the requirements for the Award of Masters Degree in Management from the NOVA-School of Business and Economics
„COMERCIALIZING THE OPPORTUNITY OF AN IMPROVED E-LEARNING PROCESS”
BUSINESS PLAN
Michał Gaszyński #1270
A project carried out on the Entrepreneurial Innovative Ventures, under the supervision of:
Professor Filipe Castro Soeiro
2
Table of content:
1. Executive summary
2. Research question & methodology 3. Literature review
4. Market problem and business opportunity
5. Busines concept
5.1. Product description 5.2. Mission & vision 5.3. Strategic objectives 6. External analysis
6.1. Competition analysis 6.2. Key Success Factors 6.3. Competitive assessment 6.4. Market size
6.5. Market trends
7. Internal analysis 7.1. Team
7.2. Internal resources analysis 8. Business model
8.1. Target groups & customer value proposition
8.2. Revenue model
8.3. Process management plan 8.4. Key Performance Indicators 9. Marketing plan 10. Financial plan 11. Implementation plan 12. Risk management 13. Recommendations 14. Bibliography
KEYWORDS: e-learning, visualization, simplicity, co-creation 1. Executive summary
CLEVERTHINGS is an innovative e-learning platform incorporating concepts of information visualization and social virtual learning environment. The product delivers simple and interactive educational content created with the use of various visualization tools.
3
The source of the content is dual, divided between internal creation and external creation basing on the co-creators’ network.
The product meets the market need of easily assimilated knowledge, breaking the monotony of tha traditional learning courses. There is a not entirely filled gap in the e-learning market. The broad competence of the team together with a strong co-creation incentive system of motivating and attracting contributors, are the capabilities that will allow addressing the market need.
The business model of CLEVERTHINGS presents how the company is going to deliver value of the educational content to its target group of English-speaking students all over the world. The business focuses on generating traffic to the website and captures value by earning money on advertising space sales and sponsored content creation.
2. Research question and methodology.
The work project’s research question had been formulated as follows: "How can we commercialize the opportunity of an improvement in e-learning processes?"
The issue tree set out below identifies the research problem and breaks the analysis into more detailed steps:
4
Tools listed below were applied to research in specific areas, in order to solve the analysed problem and complete the main assumption and conclusions of the project. Each of the instruments was used for particular purpose and delivered desired outcome:
Conducting a survey: Analyzing customers‘ perception of information visualization concept. Gathering information regarding customers‘ internet use and learning habits. Assessing the overall attractiveness of the project.
Focus group: gathering opinions and insights of visual art connected individuals about the product concept and co-creation incentive system.
Market trends and forecasts: Gathering secondary data concerning market size and trends.
Benchmarking: Analyzing best business practices. Potential market size estimation. Comparison of business models with competitors.
Competitive assessment: Comparison to the competition. Finding market flaws and the potential to fill them.
Literature review: Analyzing the literature about e-learning and information visuailzation concept. Building a theoritical background for the business model.
3. Literature review.
In the last 20 years, e-learning evolved from the radical idea to commonly accepted concept of offering knowledge, structured into modules and lessons, delivered to the customer online. In the past, e-learning was mostly used in a formal character, associated mainly with professional university courses with the academic purpose or corporate training, increasing employees’ skills and qualifications1. The content, previously prepared by teachers or instructors was managed from above with the use of various
5
Learning Management Systems (LMS)2. However, development of information
technology, together with increasing popularity of internet, entailed certain changes in the world of e-learning.
As an interesting opposition to the traditional approach to online learning, there should be the concept of Virtual Learning Environments introduced (VLE)3 4. It is the idea of an organized but not well-structured platform5, providing a virtual environment, where students and teachers can freely share e-learning content. Authors highlight the significance of social feature in this case, as an element necessary for a platform to become a VLE, as well as benefit coming from this collective element: socially structured information space simplifying searching for knowledge6. The social character of VLE itself, by offering a chance to help others or become recognized, engages students and motivates them to co-create and share knowledge7. Another benefit coming from introduction of collaborative learning platforms is the variety of possible outcomes in terms of both, multidisciplinary of topics and differentiation of presentation forms, as the environment is usually not limited with any boundaries8. In comparison with traditional learning environments, VLE brings more effectiveness to the learning process, as its students achieve higher test scores, improve their ability to apply acquired knowledge, give more satisfaction with learning and creates a positive studying climate9.
A promising improvement incorporated into the VLE concept is the inclusion of the
2 Downes S., October 2005, “E-learning 2.0”, eLearn Magazine, http://elearnmag.acm.org/featured.cfm?aid=1104968 3 Dillenbourg P., 2000, Virtual learning environments, University of Geneva, 2-3,
http://tecfa.unige.ch/tecfa/publicat/dil-papers-2/Dil.7.5.18.pdf
4 Described also as a collaborative learning, Downes S., October 2005, “E-learning 2.0”, eLearn Magazine,
http://elearnmag.acm.org/featured.cfm?aid=1104968
5
Pointing to the fact that it should allow some point of freedom and informality, Dillenbourg P., 2000, Virtual learning environments, University of Geneva, 2-3, http://tecfa.unige.ch/tecfa/publicat/dil-papers-2/Dil.7.5.18.pdf
6 Dillenbourg P., 2000, Virtual learning environments, University of Geneva, 5,
http://tecfa.unige.ch/tecfa/publicat/dil-papers-2/Dil.7.5.18.pdf
7
Dillenbourg P., 2000, Virtual learning environments, University of Geneva, 8-9, http://tecfa.unige.ch/tecfa/publicat/dil-papers-2/Dil.7.5.18.pdf
8 Dillenbourg P., 2000, Virtual learning environments, University of Geneva, 8-9,
http://tecfa.unige.ch/tecfa/publicat/dil-papers-2/Dil.7.5.18.pdf
9 Chou, Liou, 2005, „Learning effectiveness in a Web-based virtual learning environment“ Journal of Computer Assisted Learning 21,,
6
visualization tools10. There is a belief that it is possible to present every topic with the use of graphical methods and that some problems and their solutions may be better understood through visualization, rather than traditional text. Visualizations appeal in a more intuitive and expressive way and if prepared properly, may shorten human’s cognitive process, thanks to the ability to present a mental image directly to one’s mind11
. Among many benefits of incorporating graphical methods into e-learning we can mark out the increased appearance of presented information, possibility to analyze a lot of information at the same time and encouraging of hypothesis formulation12.
VLE has a potential to become a new mass trend in the e-learning industry and together with visualization tools included, it may become the most effective one, as well.
4. Market problem and business opportunity.
Nowadays, in the global internet access era, the way people tend to get information has dramatically changed. Not only internet text has pushed the traditional paper texts (magazines, newspapers, books) out of the business but the way people read in the internet changed as well. We are no longer interested in reading traditional, long texts. Even if we decide to try, we only scan the page in search of only pure information we desire13. It is a result of not having enough time, boring or hard to understand construction of traditional long texts, laziness, but most of all-decreased ability to contemplate the information, due to changes in humans’ brains.14
10 Author highlights visualization tools’ capability to reduce cognitive load of learners and assist in message exchange
Hron, Friedrich, 2003, “A review of web-based collaborative learning: factors beyond technology”, Journal of Computer Assisted Learning 19, 76
11 Presenting image directly to one’s mind allows to baypass the process of converting text into a mental image and shorten the
cognitive process. Mazza R., June 2004, Using information visualisation to facilitate instructors in Web-based distance learning, Faculty of Communication Sciences, University Lugano, 21-23
12 Mazza R., June 2004, Using information visualisation to facilitate instructors in Web-based distance learning, Faculty of
Communication Sciences, University Lugano, 23-24
13
Pires D., November 11th, 2009, Why don’t we actually read anymore? , Dancing Uphill, http://dancinguphill.com/2009/11/why-dont-we-actually-read-anymore/
14
Pires D., November 11th, 2009, Why don’t we actually read anymore? , Dancing Uphill, http://dancinguphill.com/2009/11/why-dont-we-actually-read-anymore/
7
There is a gap in the e-learning market which should be filled. There is no source of easy information on-line available, that would address this problem in an effective way. Few products provide e-learning solutions not consuming a lot of user’s time and effort, to acquire the knowledge, and at the same time, provide it in an visually attractive way15. In order to tackle described problem we need to find a way to transfer knowledge, at first by creating interest and curiosity and then by facilitating the information reception16. The solution is a website which provides simple, interactive and engaging learning experience by visualizing the content.
5. Business concept. 5.1. Product description.
The concept of CLEVERTHINGS is a B2C content site earning on advertising revenues. This interactive internet platform will help users to gain knowledge, through various graphical presentation methods (infographics, animations, storyboards, etc.). It is a service presenting different topics with, thanks to its attractive form, a potential to interest every user, strongly positioned as an interactive e-learning experience. CLEVERTHINGS platform aims at creating learning community where contributors will be able to share their online educational work with potential e-students.
The content platform of CLEVERTHINGS consists of daily-posted educational topics, created with the use of various interactive and graphical tools. Every one of them relates to different problem and is classified into one of seven categories17. Every topic is created with the use of graphically appealing method and is visually attractive, so that it meets the vision of the service.
15
According to the survey, respondents could hardly name a source like this.
16
According to the survey, facilitation of information reception is the most desired benefit.
17
Described categories base on researched customers’ interests and are as follow: ecology, business, world science technology, sport, people.
8
In this case, variety of visualization methods plays an important role.18 Therefore, there will be a number of different presentation methods used to create content.19 There are two main sources of the content planned: internally created content20 and co-created
content 21. The role of internally created content is to attract potential users and co-creators to the platform with its high design quality and educational value.
As this project is strictly connected with visualization and design, the CLEVERTHINGS platform itself has to match this profile. Therefore, there are certain characteristics that website needs to meet: visually attractiveness and up to date design, easy to read text, navigation simplicity and functionality, and compatibility with other platforms.22
Graph 2. Product features.23
5.2. Mission & Vision.
The mission of CLEVERTHINGS is to be a free source of information, which promotes and facilitates online learning and teaching processes. The aim of the project is to create learning community and a platform enabling and inspiring users to co-create the educational content, experience it and share among friends and society. Attract customers by presenting the knowledge in a funny, interesting, interactive and visually attractive way, but most of all, showing people that there is a simpler way to acquire knowledge.
18 As it goes together with stimulating curiosity, giving fun and breaking the traditional monotony of learning process. 19
Described methods are: Infographics, videos, animations, interactive presentations, drawings, games and other interactive methods.
20 Characterized by the highest graphical and utility value; branded and labeled with CLEVERTHINGS logo; strongly promoted, shared
and elevated to attract new users.
21 Meeting certain quality criteria and accepted by platform administrator.
22 By other platforms it is considered: social media platforms, mobile platforms, other internet content services, etc.). 23 Main features desired by potential customers according to survey and focus group.
9
CLEVERTHINGS exists to promote innovation in e-learning and break the traditional inefficient teaching systems.
The vision of CLEVERTHINGS is to become the worldwide pioneer and innovator of e-learning visualization throughout the existence of the service. To take advantage of technology and change the way people learn within the next decade. Our content to be shared by millions of people, across every continent.
5.3. Strategic objectives.
There have been five strategic objectives defined, achieving which, will let the company to attain its success. They have been grouped into three groups:
1. Marketing objectives:
Prepare the initial product version by 01.2014
Build an unique users’ base of 10.000 by 08.2014 and 500.000 by 08.2015
Incorporate one innovative visualization tool into content creation process every quarter
2. Financial objective: become profitable by 03.2015 3. Operational objective: launch the website in 03.2014
6. External analysis. 6.1. Competition analysis.
Main competitors of CLEVERTHINGS had been recognized basing on similarities between their offered customer value propositions and overlapping target groups. The graph below names 4 competitors’ groups, provides description, most important players in every group and customer value propositions of each one of them. It also shows how
10
CLEVERTHINGS can refer to offered value propositions and differentiate, creating an unique product concept.
Graph 3. Competition analysis.
The analysis indicates main points of difference of CLEVERTHINGS which are: visualization inclusion, visualization methods diversification, increased education value of the product and content simplification.
6.2. Key success factors.
In order to identify Key Success Factors (KSF) for the industry, three main questions must
have been answered24: on what basis do customers choose between the competing
brands?; what product attributes are crucial?;what resources and competitive capabilities
does a seller need to have to be competitively successful?
Basing on answers to these questions, 6 KSF had been identified25: ease (simplicity of
product use), quality (high education value of the content), design (high artistic value of the content and platform), distribution channels (extended content distribution network), social media marketing, community (co-creators’ system).
24 „What are the Main Key Success Factors of an Industry?”,
http://www.publishyourarticles.net/knowledge-hub/business-studies/what-are-the-main-key-success-factors-of-an-industry.html
11 6.3. Competitive assesment.
Competitive assessment analyses 5 groups of competitors, as members of each one of them are homogeneous and present similar characteristicsc. Assessment is basing on Key Success Factors criteria.
Table 1. Competitive assessment.
CLEVERTHING S Info. websites Visualisation blogs „How to” websites Content websites EASE QUALITY DESIGN CHANNELS SOCIAL MEDIA COMMUNITY
As presented in the Table 1, CLEVERTHINGS meets, fully or partly, all the criterias. According to this assessment, it is the strongest player, with only content websites and informational websites getting close to its level. It is necessary to take advantage of strong position in terms of content quality, social media presence and co-creators’ community and improve its competitiveness.
6.4. Market size.
English language is the most spoken language among internet users and is operated by 565M users in the world26 which accounts for 26,8% of all internet users worldwide. 48% of world’s internet users speaking English lives in North America and represents the number of 273M people27. This country is also a home of the e-learning concept, emerged
26 Internet world users by language, Internet World Stats, www.internetworldstats.com/stats7.htm 27Internet users in the world, Internet World Stats, www.internetworldstats.com/stats.htm
12
in 1993.28 In 2011, the North American market for online learning products reached $21.9B which accounted for 61.7% of the worldwide e-learning market29. Described market is the most mature e-learning market in the world and is characterized by a moderate annual growth rate of 4,4%30. In 2012, over 4.5M of US college students were taking more than one of academic courses online.31
The size of the english speaking internet users category, strongly represented by North American region, together with the popularity of e-learning concept on that market leads to belief, that the highest chances of success for the project are in the US/Global English-speaking market.
To have an accurate view on the potential market size for an e-learning/content
informational website, it is necessary to refer to similar representative businesses from the same category. In order to analyze the traffic on alike websites and approximate the possible market size for CLEVERTHINGS, there were 4 similar internet businesses analyzed.
Table 2. Market size estimation. 323334
SERVICE FACTMONSTER MENTALFLOSS FUBIZ KHANACADEMY
Monthly unique users 5 mln 4.2 mln 1.2 mln 6 mln
Monthly page views 20+ mln 18.6 mln 6+ mln No data
Basing on figures provided in Table 2, we can estimate the possible market size (in terms of unique users number) for CLEVERTHINGS at the level of 1-6M customers monthly. However, there is no limit for this number as website "answers.com" (targeting group with similar characteristics to the target of cleverthings.com but offering different service)
28
Graziadei, W. D., 1997, Building Asynchronous and Synchronous Teaching-Learning Environments: Exploring a Course/Classroom Management System Solution, State University of New York,
http://horizon.unc.edu/projects/monograph/CD/Technological_Tools/Graziadei.html
29 „North American eLearning Market to Reach $27.2 billion by 2016“, PR Newswire,
http://www.prnewswire.com/news-releases/north-american-elearning-market-to-reach-272-billion-by-2016-163944576.html
31 „E-learning facts“, Znanja, www.znanja.com/elearningfacts
32„Online media kit“, Mentalfloss, http://mentalfloss.com/online_mediakit 33 „What is factmonster?“, Factmonster, http://www.factmonster.com/mediakit/ 34 „Advertising offers“, Fubiz, http://www.fubiz.net/advertise/
13
estimates its unique visitors number at 130M35, which allows to aim higher than the customer base of 6M. Mobile channel expansion will help reach broader customer base.
6.5. Market trends.
The overall popularity of e-learning concept is increasing. By 2014 the number of college students taking more than one course online is expected to grow from 4.5M in 2012 to 18.5M.36 North American market for e-learning products will grow from $21.9B today to $27.2B by 2016.37
In 2012 in U.S. for the first time in history, investment in online advertising exceeded investment in traditional print advertising. Growth in online advertising is especially concerning display advertising (24% growth in 2012), social advertising (23.6% growth) but most of all mobile advertising (128% growth in 2012)38. This trend is expected to continue, as more and more advertisers are aware of growing importance of online communication channel, as a key to reach customers39. This trend supports the revenue model concept of CLEVERTHINGS.
There are certain trends shaping the way people will learn online in the near future. Social learning concept is an integration of e-learning processes into social media channels to stimulate groupwork and connect learning with socialising40. E-learning gamification, bringing in game elements into the process will increase motivation to learn and its outcome. Mobile learning is another emerging trend, facilitating access and introducing
35 „About us“, Answers, http://wiki.answers.com/page/about_us 36
„E-learning facts“, Znanja, www.znanja.com/elearningfacts
37 "The North America Market for Self-paced eLearning Products and Services: 2011-2016 Forecast and Analysis." 2012, Ambient
Insight, http://www.ambientinsight.com/Resources/Documents/AmbientInsight-2011-2016-NorthAmerica-SelfPaced-eLearning-Market-Abstract.pdf
38
“150 smart stats. Online marketing trends every business needs to know”, Reach Local,
http://www.slideshare.net/ReachLocalPresentations/150-smartstatsonlinemarketingtrendseverybusinessneedstoknow?from_search=1
39 “150 smart stats. Online marketing trends every business needs to know”, Reach Local,
http://www.slideshare.net/ReachLocalPresentations/150-smartstatsonlinemarketingtrendseverybusinessneedstoknow?from_search=1
40 „Trends in learning technologies to watch in 2013“, Elearning industry,
14
just-in-time e-learning concept41. Nowadays, the global mobile traffic represents 10% of total internet traffic. By 2013, this number is expected to grow thirteenfold. There is a growing tendency for commercialisation of this channel as well. Between 2008 and 2011 global mobile app advertising spendings grew from $700M to $12B.
7. Internal analysis. 7.1. Team.
In order to complete the management team it is necessary to enter into partnership with joint founders. Involving these partners into the cofounding colaboration is necessary for the efficient operation of business and will lead to labour outsourcing avoidance and cost saving, together with internal processes streamline.
In the early pahse of business existence, for the founder and entreprenuer Michal
Gaszynski, it is essential to acquire following parties: two graphic designers responsible for content design and creation, website design and presentation methods innovation; marketing specialist responsible for promotion strategy execution, market research and customer communication; developer/programmer responsible for website creation,
website maintanence and IT management.
7.2. Internal resources analysis.
There have been following key internal resources characterized, crucial for achieving competitiveness in the e-learning industry:
1. Team-initially consisting of two highly qualified graphic designers and IT programmer. It is self sufficient for the purpose of product creation (e-platform and e-learning content). 2. Co-creation incentive and rewarding system.
41 „Trends in learning technologies to watch in 2013“, Elearning industry,
15
3. Knowledge of customer-knowledge of customer preferences and behaviour, determining product concept and promotion strategy, gained from market research.
4. Organizational culture: unique working atmosphere emphasizing good work-life balance, open communication and strong team spirit, promoting creativity and innovation. 5. Networking: extensive social media users’ network. Wide group of friends, professionals graphically connected, with the potential for low-cost support.
6. Content idea base: wide base of ideas for content creation. Crucial to process efficiency, overall e-learning product quality and its curiosity stimulating potential.
7. Technology: hardware & software necessary for website development and content design, brought in as a contribution by co-founders. Software available online for free. 8. Unique product concept.
Graph 4. VRIO analysis.
The key internal resources VRIO analysis proves that CLEVERTHINGS does not have a sustained competitive advantage due to its lack of inimitable key resource. However, it is important to take advantage of the temporary rarity of company’s organizational culture, co-creation incentive & rewarding system and unique product concept.
8. Business model.
8.1. Target group and customer value proposition.
16
„viewers“, „co-creators“ and „advertisers“.42
Each one of these parties expects different benefits from the service and, therefore, value proposition for every one of them varies.
CO-CREATORS: CLEVERTHINGS gives potential co-creators the opportunity to
express themselves and pass on their knowledge to the public. They can use their designing skills or develop them by using simple visualisation tools, available online for free. Co-creators can share their work and derive satisfaction from the appreciation. Additionally, they can financially benefit from contributing, gain recognition and promote themselves.
USERS: CLEVERTHINGS is an simple e-learning tool that enables learning through
visualisation, which facilitates the process. It gives fun by interacting and absorbing with fascinating topics. The platform provides the opportunity to spend free time by connecting pleasure of doing something interesting with usefulness of learning. Sharing the content with friends helps users to socialise. CLEVERTHINGS’ content inspires and thanks to interdisciplinary character, broadens horizons.
Group of users has been segmentated basing on the criteria of „benefit seeking“.43 There have been 4 segments determined44: „study“, „fun & kill time”, „self development“ and „inspiration & teaching”. Basing on the segmentation analysis, it has been determined that only groups „study” and „fun & kill time” should be targeted. The choice is supported by the fact that representants of these groups have shown great interest in the product, spend relatively more time in the internet, are characterized by a strong social media presence, high willingness to share content and are interested in information visualization concept.45
ADVERTISERS: Present the possibility to advertise and reach international audience.
42
The concept of addressing these three specific groups derived from the business model of www.springwise.com
43 It takes into consideration groups presenting mutual needs, driving them to visit the platform and perform certain actions connected
with the use of the service. Segmentation does not take into account customers seeking for benefits coming from obtaining e-learning degree and corporate training, as the informal character of the content of CLEVERTHINGS would not meet their expectations.
44 Detailed describtion of customer segments included in “segmentation” in appendix. 45 Information basing on the results of the survey.
17
Design promotion message addressing specific target groups and increase traffic or elevate the product. CLEVERTHINGS gives also the opportunity to visualize advertisers’
commercial communication.
8.2. Revenue model.
The business model of CLEVERTHINGS projects two main sources of revenues: 1. Advertising: on-site advertising space sale (sold directly or via Google AdSense); revenues coming from advertising on other video-services (YouTube, Vimeo etc.)
2. Sponsored content creation: custom-made content, distributed on platform, designed to fit Website's character and present sponsor's communication statement
8.3. Key Processes.
The graph below presents all parts of the process which in the end results with the creation of the final product- educational content and knowledge transfer coming from viewing this content by users. There has also been identified key personnel involved in every part of the proces, outcomes and importance of every activity for overall success of the business (according to key success factors).
Graph 5. Process map.
18
Basing on the KSF analysis, the procesess crucial for overall success are: „content creation”, as its outcome’s quality determines the success of knowledge transfer, service attractiveness level and promotion efficiency, and „on-line advertising space sale”.
Second-rate processes are: „idea generation & choice” and „presentation method choice”.
8.4. Key Performance Indicators.
Key Performance Indicators (KPI’s) is a process execution system which, in case of CLEVERTHINGS.ORG, is projected to be used to control efficiency and outcome of content creation process, its quality and promotional actions’ efficiency46. Featured KPI’s and their control are indirect means of achieving strategic objectives.
Indicators control system has been set in weekly and monthly perspectives. There have been 5 KPI’s applied into process management system:
1. Number of internally created content: <1 per week and <6 per month 2. Variety of presentation forms used in the internal content creation process:
<5 various forms per month
3. Variety of categories matched by content: 6< categories per month 4. Content ROI (pageviews number)47: 10.000< in the first month from post 5. Unique users’ growth48:
Initial number of unique users estimated on the level of 1000 <15% weekly growth in the first 3 months from the launch
<8% monthly growth between 3nd month and 17th month from the launch <4% monthly growth between 17th and 29th months from the launch
46
F. John Reh „Key performance indicators. How an organisation defines and measures progress toward its goals“, About.com, http://management.about.com/cs/generalmanagement/a/keyperfindic.htm
47 “Social Media Analytics: Traffic Impact Of Infographics”, Bitrebels,
http://www.bitrebels.com/social/social-media-analytics-impact-infographic/
48 This variable is strongly correlated with the revenue level and performance of content creation process, as its outcome quality attracts
19 9. Marketing plan.
Advertising & Promotion strategy4950
The table below presents promotion strategy, which will be undertaken in the first 12 months, in order to achieve previously set objectives.
Table 3. Promotion strategy. Planned
advertising/promotion type
Excepted business impact & improvement
Cost51 Start
date Promotion strategy
advisement
-creating overall promotion strategy -planning advertising campaign
$1000 11.2013
Promotional video: creating viral effect and „buzz” around the product by creating curiosity and realizing the need.
-increase problem awareness -create brand awareness -increase traffic Production $200 (taking advantage of network), Distribution $0 12.2014 Social media:informal word of mouth promotion aiming at building the initial base of users (taking advantage of existing and extending the “friends” network).
-generate buzz
-building viral campaign -create problem awareness -create brand awareness -generate traffic
-constructing “learning community”
Accounts setup & management: $0 (done internally) 01.2014 Promotional products: stickers, posters, boards, etc. Distributed in
universities and during certain cultural and tech events.
-part of the co-creators’ network incentives (gift system)
-viral campaign -increase traffic
-targeting specific groups by promoting in specific places
Design $0 (internal) Print $300
01.2014
Social media campaign: main promotion channel, basing on generating traffic through SM accounts (content distribution, content sharing incentives, events, word-of-mouth, customer communication).
-customer communication tool -additional content distribution channels
-feedback gathering -increase traffic
-constructing “learning community”
Accounts setup & management: $0 (done internally) 03.2014 49
Walling R., „The 5 minute guide to cheap startup advertising“, Onstartups, http://onstartups.com/tabid/3339/bid/43774/The-5-Minute-Guide-To-Cheap-Startup-Advertising.aspx
50 „How do I plan my Internet advertising budget for my startup?”, Foundersspace,
http://www.foundersspace.com/fund-raising/how-do-i-plan-my-internet-advertising-budget-for-my-startup/
51 Mack Collier, „How Much Does Social Media Cost Companies in 2012?”, MackCollier,
20 Online ads in the industry
(on e-learning and informational websites).
-increase traffic
-targeting specific groups by advertising on specific services
$5000
(increasing in the future)
03.2014
TOTAL $6500
Co-creators‘ engagement model.
It has been proven that people have the need to express themselves. At the same time, we like to think of ourselves as creators.52 The idea of CLEVERTHINGS is to take advantage of this phenomenon and engage users to co-create the platform by rewarding them partly with recognition and material awards. Establishing the system involves 6 main steps: 1. Get interest-the aim of the first step is to get the attention of potential co-creators by intriguing them with an excellent, high quality content.
2. Explain the social impact-remind people that by creating educational visualisations they actually help others and do something that is useful for the society.
3. Profile- enable profile building, including co-creators‘ information.53 4. Networking- enable socialising and contact with each other.
5. Gamification-create a system where co-creators get points in exchange for their works of art. Points are awarded on the basis of other users‘ ratings and the number of views. Getting a certain number of points is connected with gaining levels and „titles“. Ranking showing the top levels co-creators profiles will be displayed.
6. Rewarding- granting financial or material awards based on co-creators‘ ranking.54
10. Financial plan.
Start-up cost.
The startup cost for the company has been estimated on the level of $57413.55 It has been planned in a one-year perspective.
52“People’s insights annual report. Co-creation communities”, MSL GROUP,
http://es.slideshare.net/mslgroup/5-cocreation-communities-ten-frontiers-for-the-future-of-engagement
53According to focus group results, freedom of profile creation is highly appreciated by potential contributors. 54
According to focus group results, material awards are necessary for the incentive system efficiency.
21 Advertising revenues growth.
Basing on financial estimations56 there has been aa advertising revenues formula derived:
By basing on this model of predicting advertising revenues, comprising other sources of revenue57 together with unique users’ growth model58 and cost model59, it was possible to derive the profitability function which allows to expect the business to become profitable, in accordance with financial objective, before 08.2015.
Graph 6. Profitability function.
11. Implementation plan.
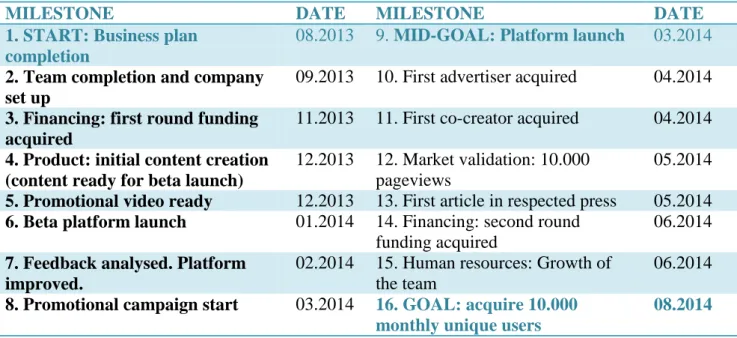
Milestone chart is a key tool used to control project execution and business growth. Breaking down necessary development steps into projected milestones and monitoring their execution, will enable localizing company’s phase of expansion in relation to its goals60. Control of milestones achievement is crucial from a fundraising point of view, as it indicates if the startup is developing well and defines its potential.61 Therefore, there
56 According to on-site advertising revenues growth model in appendix 57 According to sponsored content sales forecast in appendix. 58
According to unique users’ growth model and assumptions in appendix.
59 Basing on the financial analysis in apendix.
60 Brodzinski P., October 23, 2009, “Setting Milestones in Start-Up”, , Brodzinski,
http://brodzinski.com/2009/10/setting-milestones-in-start-up.html
61 Espinal C. E., “Setting appriopriate milestones in an early-stage startup”, Seedcamp,
22
have been following milestones characterized, as a way of achieving company’s mid-goal and one-year-perspective goal: becoming profitable.
Table 4. Milestones.62
MILESTONE DATE MILESTONE DATE
1. START: Business plan completion
08.2013 9. MID-GOAL: Platform launch 03.2014 2. Team completion and company
set up
09.2013 10. First advertiser acquired 04.2014
3. Financing: first round funding acquired
11.2013 11. First co-creator acquired 04.2014
4. Product: initial content creation (content ready for beta launch)
12.2013 12. Market validation: 10.000 pageviews
05.2014
5. Promotional video ready 12.2013 13. First article in respected press 05.2014
6. Beta platform launch 01.2014 14. Financing: second round funding acquired
06.2014
7. Feedback analysed. Platform improved.
02.2014 15. Human resources: Growth of
the team
06.2014
8. Promotional campaign start 03.2014 16. GOAL: acquire 10.000 monthly unique users
08.2014
12. Risk management.
Table 5. presents the risk analysis. Columns represent recognized types of risk, arranged according to the estimated likelihood, with their potential impact.
Table 5. Risk management.
Occurence Likeliness Possible impact
Contributors do not create enough content.
HIGH Lack of content, low attractiveness of the platform,
decreasing number of users
Low traffic to the website. HIGH Decreasing advertising revenues
New competitor offering same product.
MEDIUM Decreased traffic, decreased co-creators number, possible increased popularity of the sub-industry
Co-created content’s low presentation methods variety.
LOW Content monotony, decreased product’s
attractiveness, low differentiation from the competition
Low quality of the co-created content.
LOW Users’ curiosity decreased, decreased traffic
62 Espinal C. E., “Setting appriopriate milestones in an early-stage startup”, Seedcamp,
23 13. Recommendations.
Basing on Key Success Factors for the industry, TOWS, Porter’s 5 forces and risk analysis, there has been a set of recommendations generated to secure the future, meet objectives and sustain the growth opportunity for the business.
Product improvements:
Product differentiation (long-term). It is an action plan of distinguishing the offer, as a way to address the risk of newcomers and substitute product offering.63 The strategy is based on constant improvement of the product and includes adding new features, innovating e-learning presentation methods, extending B2C and B2C services and incorporating new technologies into the communication and content creation processes. It is important to retain the “easy access”, design and high educational quality character of the product.64
Co-creation tool development (long-term). It is necessary to develop and incorporate into the platform an unique and easy-access visualizing tool. It will result in supporting and popularizing content co-creation together with bringing to the platform users previously not interested in contribution, giving them the opportunity to create educational topics for their own purpose and by the way share it on the platform.65 Distribution channels development (short-term). As e-learning moves towards mobile
learning, it is unavoidable to follow this trend.66 Adopting the product to new platforms and extending distribution channels not only will bring higher revenues, as it allows to sell more advertising space but also will open for new customer base.
63 As threats of new entrants and new substitute products according to Porter’s 5 forces analysis is high.
64 As the importance of these product features is highlighted in the Key Success Factors (KSF) analysis in appendix.
65 According to the focus group outcome, it is necessary to incorporate an easy visualizing tool in order to attract more co-creators. 66As it has been defined as one of the Key Success Factors (KSF) for the industry, in the future it is necessary to develop the project in
24 Promotion:
Innovate promotion (long-term). In order to maintain or increase traffic to the website it is necessary to monitor and react to changes in the efficiency of previously used promotion plan. The strategy of innovating promotion consists of coming up with new way to use social media channel as a promotion mean, introducing interactive advertising reflecting the character of the product, new communication channels and eventual market re-examination together with product redesign. It is recommended to continue the strategy of promoting the service with internally created content characterized by constantly increasing level of quality, alongside the use of more and more advanced visualization technologies.
Develop co-creators’ system (long-term). Strategy corresponding to the potential problem connected with co-creators’ network and its content creation (low quality, low quantity and monotony of presentation methods).67 It implies actions in the area of incentive and rewarding system development as well as promoting and searching for contributors directly.
Operations:
Location and entity (short-term). The environmental analysis resulted with the recommendation of the Silicon Valley area as the most suitable location for the company.68 When it comes to the legal entity for the business selection, it is recommended to set up a C-corp type of company as it the most suitable form for this business model.69
67 As these are the main sources of risk connected with co-creator’s system stated in the risk analysis.
68 According to the “Location & legal entity analysis” in appendix, factors that had an impact on this decision are: presence of the
“startup ecosystem” with business supporting network, higher funding access and high qualified labor supply.
69
According to the “Location & legal entity analysis” in appendix, selection based on the advantage of described form in 3 areas: ownership structure, freedom of governance and fundraising potential.
25
14. Bibliography
1. Downes S., October 2005, “E-learning 2.0”, eLearn Magazine,
http://elearnmag.acm.org/featured.cfm?aid=1104968
2. Dillenbourg P., 2000, Virtual learning environments, University of Geneva, http://tecfa.unige.ch/tecfa/publicat/dil-papers-2/Dil.7.5.18.pdf
3. Chou, Liou, 2005, „Learning effectiveness in a Web-based virtual learning environment“ Journal of Computer Assisted Learning 21
4. Hron, Friedrich, 2003, “A review of web-based collaborative learning: factors beyond technology”, Journal of Computer Assisted Learning 19
5. Mazza R., June 2004, Using information visualisation to facilitate instructors in
Web-based distance learning, Faculty of Communication Sciences, University Lugano
6. Pires D., November 11th, 2009, Why don’t we actually read anymore? , Dancing Uphill, http://dancinguphill.com/2009/11/why-dont-we-actually-read-anymore/
7. Internet users in the world, Internet World Stats,
www.internetworldstats.com/stats.htm
8. Graziadei, W. D., 1997, Building Asynchronous and Synchronous Teaching-Learning
Environments: Exploring a Course/Classroom Management System Solution, State
University of New York,
http://horizon.unc.edu/projects/monograph/CD/Technological_Tools/Graziadei.html 9. „North American eLearning Market to Reach $27.2 billion by 2016“, PR Newswire,
http://www.prnewswire.com/news-releases/north-american-elearning-market-to-reach-272-billion-by-2016-163944576.html
10. „E-learning facts“, Znanja, www.znanja.com/elearningfacts
11. "The North America Market for Self-paced eLearning Products and Services: 2011-2016
Forecast and Analysis." 2012, Ambient Insight,
http://www.ambientinsight.com/Resources/Documents/AmbientInsight-2011-2016-NorthAmerica-SelfPaced-eLearning-Market-Abstract.pdf
12. „Trends in learning technologies to watch in 2013“, Elearning industry, http://elearningindustry.com/trends-learning-technologies-2013
13. F. John Reh „Key performance indicators. How an organisation defines and measures
progress toward its goals“, About.com,
http://management.about.com/cs/generalmanagement/a/keyperfindic.htm
14. “Social Media Analytics: Traffic Impact Of Infographics”, Bitrebels,
http://www.bitrebels.com/social/social-media-analytics-impact-infographic/
15. “People’s insights annual report. Co-creation communities”, MSL GROUP, http://es.slideshare.net/mslgroup/5-cocreation-communities-ten-frontiers-for-the-future-of-engagement
16. Brodzinski P., October 23, 2009, “Setting Milestones in Start-Up”, , Brodzinski, http://brodzinski.com/2009/10/setting-milestones-in-start-up.html
17. Espinal C. E., “Setting appriopriate milestones in an early-stage startup”, Seedcamp, http://thedrawingboard.me/2012/10/12/setting-appropriate-milestones-in-an-early-stage-startup/
1
„COMERCIALIZING THE OPPORTUNITY OF AN IMPROVED E-LEARNING PROCESS”
2
1. Survey
2. Segmentation and target group 3. Positioning statement
4. Users’ growth predictions 5. Focus group
6. Organisational charts 7. Value chain
8. Key Success Factors analysis 9. SWOT analysis
10. Porter’s five forces analysis 11. TOWS analysis
12. Financial plan
12.1. Startup cost
12.2. Advertising revenues 12.3. Profit & loss forecast 13. Industry mapping
14. Location & legal entity analysis 15. Bibliography
3
1. Survey.
Conducting a survey helped answering the question: “who may be interested in such product and who should be a potential target group for CLEVERTHINGS?” It pictured the potential users’ perception of “visualized e-learning” concept and allowed to adjust
functions and nature of the service to certain expectations.
There were 40 people questioned. All of them are English-speaking internet users. They had been reached through internet communication channels (social media & email). Below there is a report presenting survey questions together with answers. It had been narrowed to responds of the selected target group of CLEVERTHINGS.
10
Analysis of the survey characterised main benefits, for which potential users are seeking. Basing on this research, CLEVERTHINGS’ customer market segmentation divides all potential users of alike informal e-learning services into groups. There have been 4 segments determined:
1.„Study“- this group consists of users seeking for educational materials with the intention to use them for studying purposes. It is represented by young (less than 30 years old) high school and higher education students (90%) having problems with learning or
understanding traditional academic sources but still spending between 6 and 10 hours weekly on learning online (81%). They are also looking for visualised (62%) and shortened (24%) information, in order to save time or “take a shortcut” in studying.
2. „Fun & kill time”, members of this group, in the opposite to others, are not seeking for any educational value of the content. They are attracted to the service by its curiosity and fun character, interactivity and design. Furthermore, they scour content websites to fill in their free time. Representants of this segment are strongly connected with social media and share the content to socialise1. Members of this segment spend relatively more time in the internet2 and are younger than those representing other segments3.
3. Self development- users belonging to the featured segment are not characterised with mutual occupation. These are people willing to enrich their personalities, broaden their horizons and get new conversation topic for socializing purposes. They complain mainly about the lack of interesting topics to read.
2510
1 According to the survey 90% willing to share interesting content with a friend 2 According to the survey 100% more than 2 hours daily
11
educational materials, in order to teach or inspire someone with the content they found in the internet. This group consists of relatively older members4, mainly professionals (80%), less willing to share the experience with others.5
Target group.
Segments targeted in the future are „study“ and „fun & kill time“ because of their
correspondence for the service. Members of these group stated high willingness to visit the website6 and high willingness to come back if they found it attractive.7 They are high school or higher education students (88%), therefore, have more time to view the content.8 Among thes segments, there is a great interest in the concept of e-learning visualization (50%) and readiness to share the content with friends (82%).
3. Positioning statement9.
To: All visual-thinking, English-speaking students and professionals, curious about the world and having the need of getting knowledge in an easy way.
Who: CLEVERTHINGS is an interactive e-learning platform which enables learning and sharing „easy educational” topics.
Difference: CLEVERTHINGS like no other service before, will interest and make you curious with its fascinating, colorful and interdisciplinary teaching visualisations and help you learn with pleasure, without consuming a lot of free time.
2511 4 According to the survey 54% over 30 years old 5 According to the survey only 50%
6 According to the survey 96% strong or rather yes 7 According to the survey 100% strong or rather yes
8 According to the survey 64% spend between 6 and 10 hours in the nternet daily
12
Assuming initial users’ base on the level of 1000 (basing on co-founder’s friends networks) and effective promotional strategy, it is estimated that the user growth rate for the business will reach the level of 15% per week during first 3 months, 8% per week between months 4. And 17. and 4% between months 18. and 29.10
Graph 1. Users’ growth predictions.
5. Focus group.
Focus group had been conducted in order to gather opinions necessary for the Work Project’s research. There were seven individuals brought into the focus group discussion, everyone educated in the area connected with visual arts:
Monique Felcenloeben, USA, Graphic designer Yann Gueguen, France, Architect
Battiste di Fiore, France, Architect Tim Stockhausen, Germany, Engineer Jana Lucia, Germany, Architect
Marcel Kaczmarek, Poland, Graphic designer 2512
13
The purpose of the focus group was to gather opinions and insights about the product concept and the co-creators’ incentive system of CLEVERTHINGS. Respondents were asked to focus their efforts on answering following questions:
1. Does product concept seem interesting and attractive? What can be changed? 2. How easy is it to co-create visualized e-learning content?
3. What can be done in order to motivate co-creators to contribute?
Conclusions:
1. Does product concept seem interesting and attractive? What can be changed? -Overall impression about the product is positive.
-Participants agreed on the facilitating role of visualisation in the learning process.
-The role of website administration should be to promote diversification of visualisation methods.
-Videos and animations are the most attractive and easy to understand content presentation tools.
-Platform should present the highest values of graphic.
-Every content should present high graphical value, therefore, there should be a selection of co-created content to maintain the “beauty” status of the product.
-For the platform to maintain the “beauty” status, it is necessary to limit on-site advertising to minimum or to select advertising with graphical value.
14
animations as the most difficult methods, infographics and traditional presentations as the easiest methods) and on the desired quality outcome. It can be expected that infographics and traditional presentations will be the most popular type of content co-created.
-There is a common belief that simple graphic design is a difficult operation. Respondents agreed on falsehood of this belief, pointing to the high potential in realizing users and motivating them to co-create.
-The availability of co-creation tools is high. There is a high number of free online visualization tools. What is more, it is popular for people to download illegal professional graphical software.
-There should be a basic visualization tool developed and incorporated into the product in order to attract graphically non-professional co-creators.
3. What can be done in order to motivate co-creators to contribute? -Material rewarding is necessary to attract contributors.
-Material rewarding system should not base on cash but on products somehow connected with the concept of CLEVERTHINGS (educational products or visualization products). -Gamification of the system should incorporate ranking of co-creators which should be visible and elevated on the website.
-System should allow creating extended profile creation. Contributors should be granted an unlimited freedom to create profiles.
-Recognition as an active and rewarded co-creator is a strong incentive, especially if it is possible to transfer this identification to social media.
15 created especially for CLEVERTHINGS.
6. Organisational charts. Initial organisational chart.
The graph below is an outline presenting initial business structure and team members’ key area responsibilities.
Graph 2. Initial organisational chart.
3-year perspective organisational chart.
With the growth of the business, there will be team extensions necessary. The graph below presents the change in the organisational chart in the one-year perspective, after the second financing round.
16
Graph 4. Value chain.
8. Key Success Factors analysis.
In order to identify Key Success Factors (KSF) of the industry, three main questions must
have been answered11: on what basis do customers choose between the competing brands?;
what product attributes are crucial?;what resources and competitive capabilities does a
seller need to have to be competitively successful?
Basing on answers to these questions, 6 KSF had been identified:
1. Ease- Simplicity of gaining knowledge in this case has to be a result of clarity and accessibility of the platform and individual content as well. This requires big
straightforwardness of content presentation methods and their innovation. People have no time and get easily discouraged if the topic appearance and package is unattractive. It is less possible that user will not abandon learning if the transfer is short.
2516
11 „What are the Main Key Success Factors of an Industry?”,
17
viewer. Create curiosity by presenting new information through interesting topics. 3. Design-the design of the platform, as well as the design of the individual content, needs
to be visually attractive, accessible and appealing, in order to attract attention and make the time spent at the platform, a pleasure.
4. Distribution channels- extended distribution channels of the content is crucial for the success from the marketing point of view. Importance and the growing number of users of social media platforms and mobile devices makes them critical distribution channels for success in the industry12. It is also an additional way to monetize business through advertising and to measure engagement of customers.
5. Social media marketing- very clear connection between target group and the use of social media platforms makes them significant marketing channels for promotion, communication and building loyal fan base13. This communication and promotion channel is characterized by low cost in relations to traditional channels. Taking advantage of this fact may lead to cost advantage.
6. Community- creating a group of contributors, directly engaged into creating the
content, brings several benefits to the business. The main ones are: reduction of creation costs, wider content offer, promotion, user engagement. Creation of learning
community will also result in socializing of users and, indirectly, promotion of the service.
2517
12 Lasker Z., „The importance of mobile app engagement“, Forbes,
http://www.forbes.com/sites/marketshare/2011/10/24/the-importance-of-mobile-app-engagement/?goback=%2Egde_4580113_member_149410174
13Bosari J., „The developing role of social media in the modern business world“, Forbes,
18
9. SWOT analysis.
Graph 4. SWOT analysis.
10. Porter’s five forces analysis. Graph 5. Porter’s five forces analysis.
19
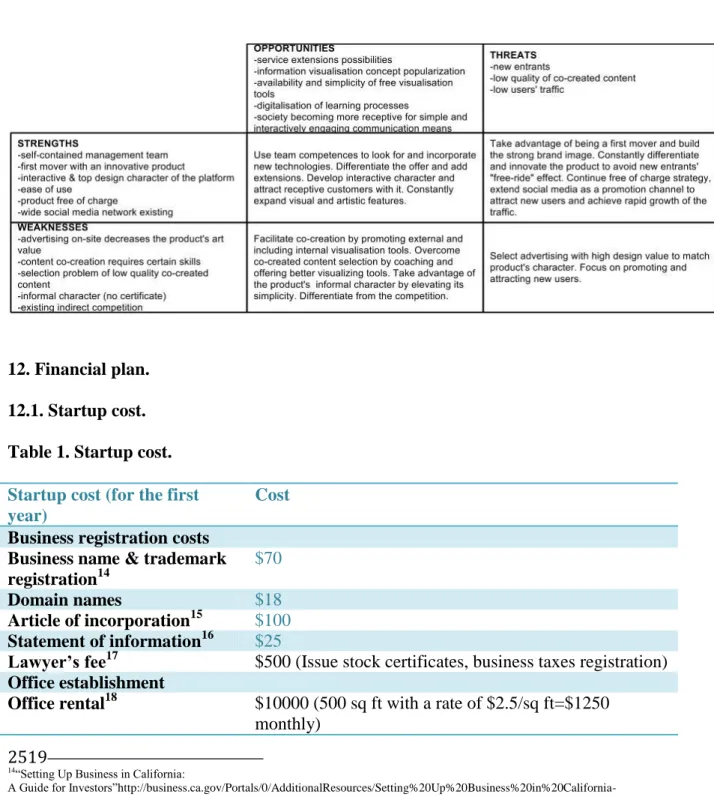
Graph 6. TOWS analysis.
12. Financial plan. 12.1. Startup cost. Table 1. Startup cost.
Startup cost (for the first year)
Cost
Business registration costs Business name & trademark registration14 $70 Domain names $18 Article of incorporation15 $100 Statement of information16 $25 Lawyer’s fee17
$500 (Issue stock certificates, business taxes registration)
Office establishment
Office rental18 $10000 (500 sq ft with a rate of $2.5/sq ft=$1250 monthly)
2519 14“Setting Up Business in California:
A Guide for Investors”http://business.ca.gov/Portals/0/AdditionalResources/Setting%20Up%20Business%20in%20California-%20A%20Guide%20for%20Investors%202012.pdf
15 „Forming a Corporation in California“, http://www.dmlp.org/legal-guide/forming-corporation-california 16 „Forming a Corporation in California“, http://www.dmlp.org/legal-guide/forming-corporation-california
17 „How, and How Much, Do Lawyers Charge?“, Lawyers.com,
http://research.lawyers.com/How-and-How-Much-Do-Lawyers-Charge.html
18 „Sillicon valley office”, Kidder Mathews,
20 $0 $100.000 $200.000 $300.000 $400.000 $500.000 $600.000 $700.000 1 3 5 7 9 11 13 15 17 19 21 23 25 27 29 Utilities $2000 ($250 monthly) Office equipment $2000
Stationery & office supply $200
Computer hardware & software
$0 (taking advantage of the equipment already owned by co-founders)
Web server $1200 ($150 monthly)
Operational costs
Wages $32000
Promotion $6500
Co-creators’ incentive system $2000
Repairs and maintenance $800 ($100 monthly)
TOTAL $57413
12.2 Revenue growth forecast.
Assumptions for the on-site advertising revenues growth model:
On average, an unique user views 5 pages, therefore, we can convert the number of unique users into the number of page views, by multiplying it by 5.
Cost per click rate=$0.5 (first 2 years), $0.8 (year 3.)
Click per view rate=2%
Number of on-site advertising banners per page=3
Graph. 7. Monthly revenues growth forecast.
2520
19 „Sillicon valley office”, Kidder Mathews,
21
Year 1 Year 2 Year 3 Average sponsored content price 0 5000 10000
Sales volume 0 6 12
Revenue 0 30000 120000
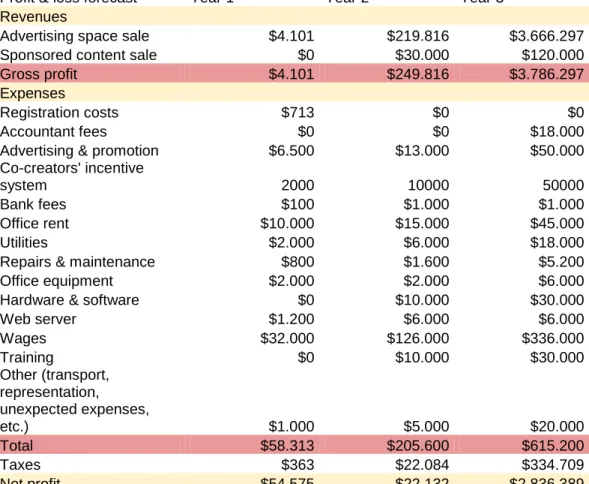
12.3. Profit & loss forecast. Table 3. Profit & loss forecast.
Profit & loss forecast Year 1 Year 2 Year 3
Revenues
Advertising space sale $4.101 $219.816 $3.666.297
Sponsored content sale $0 $30.000 $120.000
Gross profit $4.101 $249.816 $3.786.297
Expenses
Registration costs $713 $0 $0
Accountant fees $0 $0 $18.000
Advertising & promotion $6.500 $13.000 $50.000
Co-creators' incentive
system 2000 10000 50000
Bank fees $100 $1.000 $1.000
Office rent $10.000 $15.000 $45.000
Utilities $2.000 $6.000 $18.000
Repairs & maintenance $800 $1.600 $5.200
Office equipment $2.000 $2.000 $6.000
Hardware & software $0 $10.000 $30.000
Web server $1.200 $6.000 $6.000 Wages $32.000 $126.000 $336.000 Training $0 $10.000 $30.000 Other (transport, representation, unexpected expenses, etc.) $1.000 $5.000 $20.000 Total $58.313 $205.600 $615.200 Taxes $363 $22.084 $334.709 Net profit -$54.575 $22.132 $2.836.389 13. Industry mapping
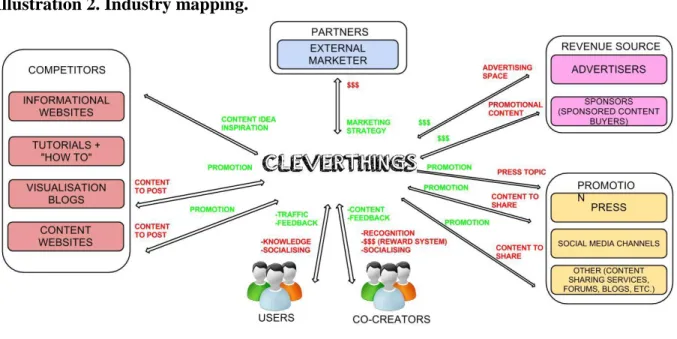
The industry map below recognizes main industry participators from the CLEVERTHINGS point of view. The map characterizes interactions between CLEVERTHINGS and
22 coming from and to the company.
Illustration 2. Industry mapping.
14. Location & legal entity
Most of the greatest tech startups were founded in Silicon Valley. Currently, seven out of top 10 most visited websites are based there and this region is generally accepted as the start-up ecosystem and home202122.
The area of Silicon Valley includes informal tech start-up supporting network consisting of entrepreneurs, advisors, funders, accelerator programs etc23. A company started there, has a relatively higher funding potential, with the average capital raised greater than in any other part of the world24. Highly qualified labour is supplied not only by local leading U.S.
2522
20 Graham J., “Top cities for technology start-ups”, USA Today,
http://usatoday30.usatoday.com/tech/columnist/talkingtech/story/2012-08-22/top-tech-startup-cities/57220670/1
21 “20 best places in the world to launch a business”, CNN MONEY,
http://money.cnn.com/gallery/smallbusiness/2012/11/27/best-global-startup-cities.fortune/index.html
22 Graham J., “Top cities for technology start-ups”, USA Today,
http://usatoday30.usatoday.com/tech/columnist/talkingtech/story/2012-08-22/top-tech-startup-cities/57220670/1
23 “Seed accelerators: the best of Silicon Valley”, Rising Tide,
http://risingtidefund.com/venture-capital/seed-accelerators-the-best-of-silicon-valley/
24 “20 best places in the world to launch a business”, CNN MONEY,
23 opportunities available in this region25.
When it comes to the choice of the right legal entity for setting up a business in U.S., there are 5 possible forms to choose: c-corp, LLC, s-corp, partnership and sole proprietorship26. From the technology startup founder’s point of view, assessment of each option should be basing on 3 factors: ownership structure forming, fundraising potential and governance. C-corp is commonly considered as the type of entity preferred by VC investors27. Following arguments prove this statement:
1. Ownership. C-corp allows limitless number of stockholders, without requiring their roles in running company’s matters and permits unconditional transfer of shares. It allows free structure of ownership and ensure uninterrupted business continuity regardless of the actions of individual shareholders28.
2. Fundraising. Investing in a c-corp company allows capital structure variability with many levels of preferences29. When it comes to possible public offering, c-corp provides this process in an easiest possible way30.
3. Governance. In a c-corp company it is possible to separate management responsibilities from shareholders31.
2523
25 Graham J., “Top cities for technology start-ups”, USA Today,
http://usatoday30.usatoday.com/tech/columnist/talkingtech/story/2012-08-22/top-tech-startup-cities/57220670/1
26 Price J., “ When I launch my startup business, what type of legal entity should I form?”,
http://jimprice.wordpress.com/2010/10/12/when-i-launch-my-startup-business-what-type-of-legal-entity-should-i-form/
27 “What type of entity should I form?”, Startupcompanylawyer,
http://www.startupcompanylawyer.com/2009/03/12/what-type-of-entity-should-i-form/
28 “What type of entity should I form?”, Startupcompanylawyer,
http://www.startupcompanylawyer.com/2009/03/12/what-type-of-entity-should-i-form/
29 Price J., “ When I launch my startup business, what type of legal entity should I form?”,
http://jimprice.wordpress.com/2010/10/12/when-i-launch-my-startup-business-what-type-of-legal-entity-should-i-form/
30 “What type of entity should I form?”, Startupcompanylawyer,
http://www.startupcompanylawyer.com/2009/03/12/what-type-of-entity-should-i-form/
31 “What type of entity should I form?”, Startupcompanylawyer,