PREDICTING SUCCESSFUL “PER” REORGANIZATIONS -
TESTING THE APPLICABILITY OF ALTMAN Z-SCORE ON
PORTUGUESE DISTRESSED COMPANIES
Luís Miguel Gonçalves Oliveira Palma Carlos
Dissertationsubmitted as partial requirement for the conferral of Master in Finance
Supervisor:
Prof. Doutor Luís Alberto Ferreira de Oliveira, Assistant Professor, ISCTE Business School, Department of Finance
i
Acknowledgements
A first word goes to express my gratitude to Professor Luís Oliveira for all the support, guidance and availability to be the supervisor of this research.
A big thank you for, all the friends and close family, still present or already gone, that contributed to my development as a person and to the desire, even if sometimes a bit asleep, to always try to know a little bit more and improve my knowledge.
Lastly, but definitely not the last, a special thank you to Sara, for all the support, for not given up, and for all the caring through all this quite long, but still short, journey.
ii
Resumo
A presente dissertação tem como principal objectivo testar a aplicabilidade do modelo de previsão de falências de Altman para empresas privadas na diferenciação entre as empresas que entram em “PER” e conseguem obter um plano de recuperação aprovado e aquelas que não o conseguem.
Para tal, foi recolhido o universo de empresas que entraram em “PER” entre Maio de 2012 e Dezembro de 2016, no que se traduziu numa amostra viável de trabalho constituída por 2,189 empresas.
As conclusões obtidas permitem afirmar que quando aplicado à amostra seleccionada, o modelo de Altman para empresas privadas, na sua formulação inicial, não permite distinguir correctamente entre os dois grupos de empresas identificados.
Através da re-estimação dos coeficientes do modelo de Altman, foi possível obter modelos que obtivessem melhores resultados sem, no entanto, se poder afirmar que se obteve um modelo que cumprisse robustamente com o objectivo proposto de diferenciação entre empresas com plano aprovado e sem plano aprovado.
Classificação JEL: G33, C52
Palavras-chave: Altman Z-score; Processo Especial de Revitalização (PER); Plano de Recuperação; Falência; Insolvência.
iii
Abstract
The main objective of this dissertation is to test the applicability of Altman's bankruptcy prediction model of private companies in differentiating between companies that enter into “PER” and are successful in having an approved recovery plan and those that are unsuccessful. For this, the universe of companies that entered “PER” between May 2012 and December 2016 was collected, which translated into a viable sample of work consisting of 2,189 companies. The conclusions obtained allow us to state that when applied to the selected sample, the Altman model for private companies, in its initial formulation does not allow a proper distinction between the two groups of companies identified.
Through the re-estimation of the Altman model, it was possible to obtain models that achieved results that were more positive. However, it is not possible to state that the model could robustly differentiate between companies with an approved plan and those without a plan approved without a significant error margin.
JEL Classification: G33, C52
Keywords: Altman Z-score; Processo Especial de Revitalização (PER); Recovery Plan; Failure; Insolvency.
iv
Index
Acknowledgements ... i Resumo ... ii Abstract ... iii Glossary ... vii 1. Introduction ... 12. “Processo Especial de Revitalização” ... 3
2.1. Context of Creation ... 3
2.2. PER: the Details... 4
2.3. Bankruptcy and Other Definitions ... 6
3. Review of Literature ... 9
3.1. Bankruptcy Prediction Models ... 9
3.2. Previous Bankruptcy Studies Regarding Portugal... 13
3.3. Previous Financial Studies of Companies that Applied for PER ... 14
3.4. Other Approaches to Corporate Default ... 15
3.5. Review of Literature Considerations ... 16
4. Data and Methodology ... 18
4.1. Data Analysis ... 18
4.2. Methodology ... 25
5. Empirical Findings ... 29
5.1. Descriptive Statistics and Profile Analysis ... 29
5.2. Empirical Research ... 32
5.3. Results ... 35
6. Conclusions ... 38
References ... 39
v
List of Tables
Table 1 – Sample Distribution by District with Number of “PER” Applications, Debt, and
Number of Employees ... 23
Table 2 – Sample Distribution by Successful and Unsuccessful Companies and Current Activity Status ... 24
Table 3 – Discriminant Analysis Function Results ... 32
Table 4 – S36 Model Zone’s Centroids Points ... 32
Table 5 – S1.3K Model Zone’s Centroids Points... 33
Table 6 – S1.4K Model Zone’s Centroids Points... 33
Table 7 – S170 Model Zone's Centroids Points ... 34
Table 8 – Filtered Sample Predicted Group Membership with S36 Model ... 36
Table 9 – Filtered Sample Predicted Group Membership with S1.3K Model ... 36
Table 10 – Filtered Sample Predicted Group Membership with S1.4K Model ... 36
Table 11 – Filtered Sample Predicted Group Membership with S170 Model ... 37
Table A. 1 - Ratios Mean Values ... 41
Table A. 2 - Main Statistics of the Discriminant Analysis ... 42
Table A. 3 – Within Sample Predicted Group Membership by Model ... 43
Table A. 4 – Within Sample Predicted Zone (Centroids) Membership by Model ... 44
Table A. 5 – Filtered Sample Predicted Group Membership with Altman’s Z’-score model . 44 Table A. 6 – Filtered Sample Predicted Zone (Centroids) Membership by Model ... 45
vi
List of figures
Figure 1 - “PER” Procedures Indicative Timeframe ... 4
Figure 2 – Quarterly Applications for “PER” from May 2012 to December 2016 – Comparison between CITIUS and DGPT ... 18
Figure 3 – Monthly Applications for “PER” from May 2012 to December 2016 – CITIUS Information Divided by Companies and Individuals ... 19
Figure 4 – Sample Distribution According to Company Size ... 21
Figure 5 – Sample Distribution by Industry and Number of “PER” Applications ... 21
Figure 6 - Sample Distribution by Industry and Total Debt ... 22
Figure 7 – Sample Distribution by Time Taken to Close the “PER” Process. ... 24
Figure 8 – Sample Variable X1 to X5 Mean Results – Comparison between Successful and Unsuccessful Companies ... 30
Figure 9 - Sample Variable R6 to R10 Mean results – Comparison between Successful and Unsuccessful Companies ... 31
vii
Glossary
Abbreviation Description
BvD Bureau van Dijk
CAE Classificação Portuguesa de Actividades Económicas
("Portuguese Classification of Economic Activities")
CITIUS Name for the portal agregating the procedural
management in the Portuguese Judicial Courts
CRA Credit Rating agencies
DGPT Direção-Geral da Política de Justiça ("Directorate-General of Justice politics")
EFAP Economic and Financial Assistance Program
IMF International Monetary Fund
JAD Judicial administrator
PER Processo Especial de Revitalização ("Special Process of Revitalization")
1
1. Introduction
The subprime crisis of 20071 immersed the world’s economies in recession and, although some of them have suffered deeper and more extended consequences than others, very few have escaped the increase in companies’ bankruptcy and the need of corporate deleveraging. As a consequence of the reduction in economic activity, millions of working-age people were placed out of a job, therefore contributing to social instability and lack of purchase power which in turn added fuel to the recession either by the lack of demand or the increase in taxes many countries ended up opting for to cope with the extra social responsibilities.
One of the main drivers contributing to corporate failure was the unsustainable debt burden that companies had accumulates before the financial crisis that brought along an increase in interest rates and a decrease in demand. With this in mind, one of the biggest economic challenges was the creation of mechanisms allowing companies to financial deleverage in an orderly manner. While many other countries had already foreseen such mechanisms in their law, in Portugal, there was none and the only way for a company to orderly deleverage was for all company lenders to agree on the terms of a restructuring deal. As an event of unanimously support from all of the company’s creditors is difficult to achieve, the Portuguese government created, through its “Revitalizar” program, the “Processo Especial de Revitalização” (Special Revitalization Process) (henceforth referred to as PER). This process allows a swifter resolution of deleveraging processes permitting viable but in distress corporations to avoid entering in bankruptcy or insolvency procedures.
The subject of bankruptcy and the creation of models to predict it has been studied for close to a century and companies can, and should, use the knowledge already compiled to perform fast assessments on their business financial situation and possible impending distress.
Knowing the drivers of corporate bankruptcy and pre-emptively acting on the alarm signs can provide a company with the necessary time to prepare and conduct a successful deleveraging process and therefore protect the interests of all its stakeholders (from shareholders and lenders to clients and employees).
1 The onset of the financial crisis is generally accepted to be late July 2017. On August 2017, the European Central
Bank provided the first large emergency loan to banks in response to increasing pressures in the euro interbank market.
2 Using a similar methodology already applied in bankruptcy prediction studies, the hereinafter work intends to test the applicability of a corporate bankruptcy prediction model, in this case the Altman’s Z’-score, in predicting the outcome of companies applying for PER.
This analysis intends to test whether the model can be used by the stakeholders of a company in distress as a fast assessment tool to measure the financial health of the company and therefore allowing to identify those companies that, within those in distress, are more prone to reach an agreement with their creditors and having a recovery plan approved.
Despite evidence that Altman’s model can be successfully applicable to different markets and industries, the issue of Altman’s model applicability outside of the American business reality still remains a main disputed topic. This point has been raised several times including Altman himself (Altman and Hotchkiss, 2006), and due to this, this study will also re-estimate the model according to the reality of the Portuguese market.
For the best of our knowledge, very few studies have analysed the economic and financial reality of Portuguese companies that applied for PER. This study intends to contribute to that base of studies, while at the same time applying new methodologies in this field and providing the reader with an overview of the “PER” system and its evolution since its inception.
This dissertation proceeds as follows. Since the “PER” is a cornerstone of the work to be carried out, a brief description of the PER, its creation, characteristics, and main advantages, will be firstly given in Section 2. Section3, provides an extensive literature review. Section 4 covers the data gathered on this analysis, as well as the methodology used for this study. The empirical study is presented in Section 5 where the descriptive analysis and the results are given. A summary of the findings is then presented in Section 6 which concludes this dissertation.
3
2. “Processo Especial de Revitalização”
The “Processo Especial de Revitalização” which, in a free translation from Portuguese, translates to Special Process of Revitalization (hereinafter referred to by its Portuguese acronym, PER), is one of the instruments created by the Government in 2012 through its “Revitalizar” program.
Following, there is a brief context of creation of the PER, its main points and characteristics. Although considered important for the context proposes, the following notes do not intent to provide a full comprehensive and exhaustive legal description and historical evolution description of the PER
2.1. Context of Creation
In 2012, Portugal was in the midst of financial turmoil that, in the previous year, forced the country to request auxiliary funding from international institutions. The Economic and Financial Assistance Programme (EFAP), normally referred to as ‘bail-out’, consisted on emergency funding provided by the IMF, European Commission, and European Central Bank, commonly ‘the troika’. EFAP’s overall goals were to underpin economic growth and macro-financial stability and to restore macro-financial market confidence. These goals were to be achieved mainly through three fronts: (i) sustainable fiscal policy, (ii) financial sector stabilization, and (iii) economic structural reforms to increase potential growth.
EFAP’s three action fronts required the implementation of a set of rules, laws and policies. Amongst them, some were directed at improving the judicial sector with the goal to reduce the backlog of court cases concerning debt disputes and to facilitate the recovery of viable companies in financial distress. This effect was to be achieved by a revision of the insolvency law code due to occur by November 2011.
However, only three months after due time, the Portuguese Government approved the “Programa Revitalizar” (Revitalization Program). This program included several policies, such as the creation of €220M worth of Funds to capitalize Portuguese companies, and the due changes to the insolvency law code, that, among others, created the “PER” legal regime.
4
2.2. PER: the Details
“Programa Revitalizar” main resolution was the creation of the PER. Inspired by USA’s Chapter 11, its purpose was to provide companies with a distress solution that did not force them to pass by the insolvency legal procedures, enabling a more agile and efficient process of value protection and recoverability.
With the application for PER, a company automatically gets a standstill, protecting the company from execution process on its assets either by suspending the current process or by inhibiting new ones, and protects the company against any creditor requiring its insolvency. This protection enables the company to continue its normal operation while the negotiation process is undergoing and officially starts the “PER” legal procedures.
The “PER” aim of reducing the judicial burden of recovery and debt dispute cases, was also intended to be achieved by limiting the available timeframe for negotiations to occur. The indicative timeline of the “PER” procedures, based on the initial “PER” procedures, is given in figure 1.
Figure 1 - “PER” Procedures Indicative Timeframe
Source 1 – translated from ‘Programa Revitalizar presentation’ from the Ministry of Economy and employment.
According to the indicative initial timeframe, it could be expected that a “PER” process would take four to five months. However, this normally does not occur, as shown further in this study.
Beggining [instantly]
• The company should be in dire financial position, i.e. with serious difficulty in meetings its obligations, or in imminence of insolvency.
• The proces begins with a expression of interest by the debtor and one of its creditors. • A Judicial
Administrator (JAD) is nominated as soon as the company interest is communicated to the judge.
Credit list [20-30 days]
• Creditors have 20 days after the publication nominating the JAD to claim their rights over the company.
• A provisiual list of credits is listed in the Citius portal, which may be contested for the next five days. • The Judge has five
days to rule on any challenges presented. • After the given period
the list becames definitive.
Recovery plan design [2-3 months]
• The debtor and the creditors have 2 months to conclude the negotiations, a 1 month extension may be required.
• Negotions occur with the JAD's presence • The JAD must aprove
any significant decision by the debtor.
Plan approval or dismissal [10 days]
• Aprovall requires the presence of 1/3 of the total credits with voting rights, favourable voting by 2/3 of the total voting rights and >1/2 of the non subordinated voting rights;
• The voting phase lasts for five days.
• The Judge has 10 days to approve or refuse the proposal recovery plan; • If a plan is not reached in due time, the Judge jointly with the JAD, assesses the debtor situation and may declare its insolvency.
5 The reasons for the delays in a “PER” process varied greatly, but for the most part could be attributed to delays originated within the judicial court system. A few examples of known issues delaying the procedures are: (i) the lack of capability by the JAD to directly publish certain events on the CITIUS platform (e.g. on the thirtieth day the JAD sends the credit list to the court, the court then takes one, two or any given number of days to publish the credit list, therefore delaying the whole process by the same time); (ii) the judicial court agenda may not allow a judge the time to rule on the “PER” within the stipulated given time (normally this affects the later stages of the process, specially the approval or refusal of a company recovery plan or the insolvency assessment if a company fails to present a recovery plan within the given amount of time); or, (iii) in the case of existing creditors being obliged to send their vote in physical form, and to accommodate for the extra time these votes take to arrive at the courts, the voting counting procedures may be delayed by a certain amount of days so that all the votes arrive, therefore delaying the overall decision procedure.
PER’s advantages do not end at the standstill effect and in a more agile process. The “PER” also provides the company with a few added advantages of fiscal and legal nature.
First, any haircut obtained through the “PER” procedures will not be subject to taxation (however the losses recognized by the bank’ will be fiscally accepted). This fiscal benefit allows a company to fully take in the benefits of a debt haircut instead of having to discount to that benefit the corporate tax on income. While at the same time, the fiscal benefit given to the banks, allows them to partially recoup the losses recognized through the fiscal benefit that will reduce their taxable income, therefore reducing the net loss for the bank and possible turning the banks more prone to provide haircut to viable companies.
Second, any injection of money (New money) made under the “PER” agreement will have a seniority rank over previously existing debt (which even includes workers credits). This situation gives added protection to any financial lender providing the necessary auxiliary funding needed for the company to recover its operation, therefore turning new auxiliary lending more likely to occur.
Furthermore, legally any guarantee given to the creditors providing New money under the “PER” will be protected from litigation, even if the company falls into insolvency within a two years period after the “PER” plan approval. The same legal protection applies to any major decision taken with the accordance of the JAD, for example, any asset sale done will be protected from any injunction aiming at reversing the sale. As well as, any haircut given as part
6 of the “PER” plan, will be reversed if a company falls into insolvency within the same two years period.
Although the recent existence of “PER” judicial figure, the process already suffered some changes to its initial formulation. In 2016 and 2017 the Portuguese government introduced new requirements to the PER, namely, (i) when a company now submits its application for “PER” it has to already present a proposal of a recovery plan, and (ii) a certified chartered accountant now has to provide a declaration ascertaining the solvency status of the company. Despite the changes introduced being minor adjustments to the procedures, these measures ultimate goal could be seen as (i) having better prepared companies applying for PER, which will expedite the process conclusion, (ii) being able to filter the companies allowed to apply for PER, which will reduce the number of firms applying for “PER” only in order to postpone their insolvency, and, when considering both of the previous effects, (iii) increasing the market perception of companies in “PER” has being so close to bankruptcy, which will reduce the negative perception effect a company nowadays faces when it applies for PER, and further help their recovery.
2.3. Bankruptcy and Other Definitions
At first the definition of bankruptcy may appear to be a quite straight forward concept and not being subject to much discussion. However, such idea is not entirely true and although the ultimate goal of this work is not to work directly with bankrupt companies, this concept, and others similar, will be referenced intensely and extensively throughout the work and therefore an explanation must be provided.
The recurrent use of failure, insolvency, default, bankruptcy or, in an extreme case, foreclosure as synonyms or very closely related words is not correct. Each of these words represents a different economic, financial, and/or legal situation. One can say that this situation is even fuelled by academics since, through an examination of the literature already produced, it is possible to conclude that different authors use different definitions, as expressed by Ohlson (1980) and reinforced by Bellovary, Giavomino and Akers (2007).
Henceforth, the definitions for bankruptcy, insolvency, failure and default, will be given in accordance with Altman and Hotchkiss (2006) book “Corporate Financial distress and bankruptcy”. For these authors, the definition of failure considering an economic criteria is as when the realized rate of return on invested capital is lower than the prevailing rates in similar
7 riskier investments. Another definition, from Altman and Hotchkiss (2006), would be as when revenues are not sufficient to cover the company costs. Both definitions say nothing regarding the continuation or discontinuation of a company activity. Altman and Hotchkiss (2006), also put forward a definition for a legal failure as when a company is not able to meet the legally enforceable demands of its creditors. However the definition of business failure put forward by Dun & Bradstreet is also made available. In fact, D&B’s definition includes “business that cease operation following assignment or bankruptcy; those that cease with loss to creditors after such actions or execution, foreclosure, or attachment; those that voluntarily withdraw, leaving unpaid obligations, or those that have been involved in court actions such as receivership, bankruptcy reorganization, or arrangement; and those that voluntarily compromise with creditors” (Altman and Hotchkiss, 2006), which already refers to the continuity or otherwise of a company activity.
The next definition provided, insolvency, has a more technical perspective and consists of a company being unable to meet its current obligations, translating into a lack of liquidity or cash. However, when in a bankruptcy sense, insolvency tends to be related as a chronic factor. A bankruptcy insolvency tends to be more difficult to assess than the initial technical insolvency, since it requires the comprehensive assessment of the company’s assets and if they are capable of complying with all the existing liabilities of the company, such assessment normally only occurs if or when all the assets are liquidated. A further definition is provided by Altman and Hotchkiss (2006) of a deepening insolvency. This event occurs when a company already in bankruptcy is kept alive, normally, to the prejudice of the creditors.
One of the most associated conditions with bankruptcy is default. Defaults are defined by Altman as being technical and/or legal. Technical defaults occur when a debtor fails in complying with a given covenant2. This situations tends not to advent the company bankruptcy and the covenants tend to be waived and/or renegotiated since covenants are normally used to signal a company performance and not to enforce any procedures. Legal default is related to events when a company does not comply with its payments to the lender, either interest or capital. The occurrence, or imminence of it, of this type of default, tends to be the greatest driver leading a company to enter into restructuring procedures. However, in such case, it would be called a distressed restructuring.
2 Covenants are conditions, normally expressed by ratios such as the debt ratio, that the debtor has to comply with
8 Finally, bankruptcy, Altman and Hotchkiss (2006) related this definition with the net worth of the company’s assets, as in insolvency, or to when a company formally files for bankruptcy in a court, either asking for liquidation or for reorganization.
Foreclosure, the last definition, is the legal procedure through which a lender executes its debts on the debtor and seizes control of assets in order to recover its exposure. This definition, although connected with distress or default situations could not in any degree be used as a replacement of any of the other definitions due to being related to a specific kind of legal action.
9
3.
Review of Literature
“However, when the failed firms are compared with the nonfailed, their weaker position is evident.Perhapsthenonfailedfirmswindowdressmoresuccessfullythanthefailedfirms”
Beaver (1966, p. 100) The ensuing review of literature will be composed of five subsections. In the first part, it will be given a description of the evolutionary process of the main methodologies used in the study of bankruptcy prediction. The second and third parts, gather the conclusions from some studies concerning bankruptcy of Portuguese companies and studies concerning the PER. The last two subsections provide a brief description of other approaches to bankruptcy and some considerations.
3.1. Bankruptcy Prediction Models
The field inception of bankruptcy or default studies can be traced to decade of 1930 with the simple ratio analysis. However, knowledge and mainstream acceptance only came with Beaver (1966) work “Financial Ratios as Predictors of Failures”, the first major reference study in this field. Since then, multiple prediction models have been studied and developed for different sectors, countries and with different methodologies, leading to an exponential availability of robust solutions to anyone who wants or needs such tools.
Beaver (1966) pioneered the use of ratio analysis, as a predictor of corporate bankruptcy, setting a new milestone in this field. Beaver (1966, p. 72) defined the purpose of ratio analysis as “the primary concern is not with the ratios as a form of presenting financial-statement data but rather the underlying predictive ability of the financial statements themselves”. In his study, the author performed three different analyses to a sample of 79 previously publicly-owned firms that failed in the period between 1954 and 1964. This sample was paired with 79 nonfailed firms subject to two main conditions: same industry, and closest asset size as possible. Although using and defending a paired analysis as a legitimate approach, he recognized some drawbacks to it. The first, was the fact that “it cannot draw inferences regarding a simple observation” and, the second, by mitigating “the influence of the industry and asset-size factors, it also virtually eliminates any predictive power these factors may have had” and, thereafter, the use of an unpaired analysis implied the residual effects of industry and asset size to be small.
For the companies in the sample, financial data was gathered from five years prior to the failure year. This data was then used in computing a list of 30 ratios. Afterwards his analysis breaks
10 down into three sections: a comparison of mean values; a dichotomous classification test; and an analysis of likelihood ratios. The main financial ratios defined by Beaver (1966) were: Cash flow to Total debt; Net income to Total assets; Total debt to Total assets; Working Capital to Total assets; Current Ratio; and No-credit interval as the ratios with lower predicting percentage error for the five-year period and, consequently, ratios with the best forecasting capacity. The main conclusion of the study was that the ratios predictable capacity deteriorates as the failure year is further away, e.g., the natural deterioration of a company financial statements before failure plays a determinant role in increasing the ratios predicting ability.
Two years later, Edward I. Altman3, a faculty member of NYU’s Stern School of Business, published an important paper in this field that would be one of the major contributions to it, revolutionizing the field by applying a multivariate analysis to bankruptcy prediction and coining the industry with the well-known Z-score model.
Altman did not just try another approach to a recurrent problem, he was of the opinion that previous studies were of questionable nature. Since the use of a univariate analysis, although providing interesting results and being solid at signalling ratios trends, when it came to assess a company bankruptcy, is of questionable application, theoretically and practically. As an example, Altman (1968, p. 590) stated that “For instance, a firm with a poor profitability and/or solvency record may be regarded as a potential bankrupt. However, because of its above average liquidity, the situation may not be considered serious.”
Not rejecting the developments made by other authors, Altman (1968, p. 590) asserted that his study was “an appropriate extension of the previously cited studies, therefore, is to build upon their findings and to combine several measures into a meaningful predictive model”.
Altman then used a multivariate discriminant analysis (MDA) as the statistical technique for his endeavour to construct a model for bankruptcy prediction based on an initial list of 22 ratios. The Z-score obtained a 95% accuracy in predicting bankruptcy one year prior to the event, 72% two years before, and 48% three years before going bankrupt.
Altman (1968) research and subsequent development of the Z-score is a prominent technique still used and studied today with the so called Z-metrics. Z-metrics are models built with newer statistical methodologies or with new variables but that in their essence resemble the work done
3 Altman has through the years built a reputation as an expert on corporate bankruptcy through multiple studies
11 by Altman and intend to build a model with similar practical utility. Altman’s method is not only used in predicting firm bankruptcy but also to estimate company credit rating or default risk probabilities. The Z-score model simplicity is one of its most elemental advantages as being the most accurate method available, only matched by Neural networks (Oliveira, 2016). Altman, Haldeman and Narayanam (1977) developed a new model with the same purpose of predicting bankruptcy. The purpose of the new model was to update on the “several fairly impressive “old” models” (Altman et al., 1977). The foremost reason for researching a new model was the change in size of the firms going bankrupt in the period closer to the study. Followed by the necessity of such models being regularly updated since their predicting capacity may tend to decay as time goes by. For the new model, named ZETA®, 27 variables were analysed with the empirical results setting a model with 7 new financial variables to which the coefficients where not made public, since they were considered as intellectual property by the authors.
Further developments in the field came from the work of Ohlson (1980), where a Logit model was firstly used in bankruptcy prediction, intending to solve the limited usefulness of Altman’s work in the econometrics field. Followed by a similar approach, the Probit model, and the latest development, the neural networks that appeared at the turn of century (Bellovary et al., 2007). Despite the developments, Altman methodology is still widely used today, to which the author efforts to continuing testing its model and to continue develop new methodologies are a decisive factor. The continuing development of the Z-score and/or other Z-metrics is to ascertain that the model is, to this day, accurate and relevant to modelize a company’s bankruptcy. Such fact was evidenced when Altman and Hotchkiss (2006), recalibrated the Z-score and concluded that 30 years after its first formulation, the Z-score still achieved a predicting capability of 94% for one year prior to bankruptcy and 74% for two years prior to bankruptcy.
Examples of the continued development of the Z-score and other Z-metrics were the modelling of the Z’-score, i.e. a Z-score for private companies, and the modelling of a Z’’-score for emerging markets. The original Z-score model required the companies to be publicly traded, since variable X4 requires the market value of equity, its application by practitioners to privately
held companies was done by simply substituting this input for the book value. However, Altman and Hotchkiss (2006), after in fact confirming the sole intention of the initial model was to be used in publicly traded companies, advocated that its applicability for private companies required not just a variable adjustment but the whole model to be re-estimated. The result was
12 a revised Z-score with a new X4 (Book value of equity/Total liabilities) variable, which the
authors coined as Z’-score.
A 2007 paper from Bellovary et al. (2007) looked back at the research already produced in this field concerning the American reality and made a review of the bankruptcy studies from 1930 until 2004. In their study, the predominance of the discriminant analysis in the field was proven as, from the sample of 165 studies reviewed, 60 of them used a discriminant methodology seconded by neural networks methodology with just 40 uses. With their analysis, the authors also shown the trends that existed in the main methodology used throughout the time. While discriminant analysis, that started in the 1960’s was the main methodology used for two decades until the logit overpassed it in the late 1980’s, only to have a short living since it was quickly replaced by the neural networks in the following decade.
The study also reinforced the neural networks methodology status as the best methodology in terms of achieving the best predictive capability, with the studies attaining a predicting capability ranging from 71% to 100%. Following neural networks, was the MDA, with a predictive capability ranging from 32% to 100%. Therefore, these two methodologies were given by the study as the ones providing the best results in modelling bankruptcy. However, one should have in consideration the easier and user friendlier applicability of a MDA analysis over the neural networks methodology.
Bellovary et al. (2007) comprehensive study also pointed that the number of factors did not have impact in the predictive capability of a model. The studies reviewed ranged in the number of ratio factors from 1 to 57, with the average number being 10 and, contrary to the main methodology used, no trend was seen through time. Another, important giveaway from the study was that the majority of the studies did not perform an hold-out sample test (87 out of 165 studies). Although, the use of such test was important in acquiring a stronger measurement of the model’s predictive capability as was referenced by Jones (1987).
The usage of the Z-score as a bankruptcy predicting model enduring close to half a century after its initial formulation, is not only due to Altman’s continued work individually or in collaboration. Multiple studies from other authors have studied the subject and have researched the applicability of the model to different market and industries, which is the main point of discussion of Altman models. While some concluded that the model did not have predicting capability within the tested sample, others have tested the model to only find out that it applies to their sample either in the model original formulation, or with some adjustments made in the
13 coefficients or in the cut-off points. Recent examples of this continued research are the works that applied the Z-score to the prediction of corporate bankruptcy and extended it from the Greek to Jordanian economies. Gerantonis, Vergos, & Christopoulos (2009) tested Altman (1993) Z-score model to a sample of 373 Greek companies, of which 45 were bankrupt or had their shares suspended. The study proved the applicability of the Z-score with the success rate at identifying bankrupt companies rising from 20% four years before the event to 66% in the year prior to bankruptcy. The overall predicting capacity stood at 57% in the year before bankruptcy. Alkhatib and Al Bzour (2011) tested the applicability of Altman Z-score to Jordanian listed companies in the period between 1990 to 2006, achieving a bankruptcy predicting capability of 75% five years to 100% from three to one year prior to bankruptcy. Celli (2015) applied Altman (1968) Z-score to a sample of 51 Italian companies that were delisted or permanently suspended from the Italian stock exchange and 51 non-defaulted companies. The author proved the applicability of the Z-score in predicting default events in Italy with an overall predicting capability ranging from 87.3% one year to default to 66.6% three years before default.
3.2. Previous Bankruptcy Studies Regarding Portugal
The adaptation and execution of bankruptcy studies to Portuguese companies is not new. Close to the turn of century, Neves (1998) applied the Altman (1968) methodology, i.e. the Z-score, and ascertain that, due to the model being made from a sample of North American companies with their particular characteristics, the direct adaptation to the Portuguese reality would be abusive. As well as, the cut-off points defined by Altman research may also not be applicable to Portuguese companies.
Over the next decade, several authors applied the methodologies for predicting bankruptcy studied internationally to the Portuguese reality. A few examples will be henceforth given. Alves (2000) applied a logit model to a sample of 40 bankrupt companies in 1998 and had an 82.5% success selection in bankrupt companies. A few years later, Barros (2008) applied a Logit, Probit, Gompit analysis obtaining a 6.04% type I error (failed firms identified as viable) and a 4.78% type II error (viable firms identified as failed) when using the Gompit model. Lacerda and Moro (2008) studied the default predictors’ for Portuguese firms. Bonfim (2009), studied the determinant characteristics of default for Portuguese firms, combining macroeconomics data with firm level information. This studied would be further deepened by Morais (2013).
14 In the past few years, a significant amount of the research has been done on bankruptcy in Portugal, either in models to predict it or factors that influence it, with, only from 2013 to 2015, more than ten different studies produced. The studies focus range from the applicability of the model to specific sectors, such as manufacturing (Duarte, 2014) and civil engineering (Pimenta, 2015), to the effect of macroeconomics on insolvency of Portuguese companies (Vaz, 2014), or simply to test the applicability of the existing models to the Portuguese reality (Amaro, 2013).
3.3. Previous Financial Studies of Companies that Applied for PER
Although there is already a relatively extensive literature on a legal bases of the PER, there are even already several books published on the subject, the literature that addresses “PER” from a financial point of view is particularly scarce.
Since the “PER” itself is considerably new – considering it was only implemented in 2012, and normally financial analysis requires a database of a few years to be established, it is not surprising that only in the past two years, financial studies have started to appear.
The first study identified was that of Simão (2015) which makes a statistical analysis of the companies that applied for PER. The analysis covered the period between May 2012 and December 2013 with a total of 825 companies. The author notes that companies where “PER” was applied tend to be micro enterprises and were companies related to the construction sector. The author also points out that companies that enter in “PER” have had a certain amount of a priori risk and that 58% of those companies that have entered “PER” continued to be active at the time of the study. The author concludes that the PER’s full purpose has not been achieved since few companies succeeded in achieving an agreement and a large number ends up filling for insolvency afterwards as a result of: (i) lack of coordination between creditors given the large dispersion of credits; (ii) poor assessment of initial economic and financial conditions of companies applying for restructuring plans; and (iii) resistance to implement operational restructuring measures from companies and to provide additional funding from banks.
Oliveira (2016), departs from Simão (2015) conclusions by ascertaining that the “low level of success in negotiations” should not be viewed as a failure but the incidence of firms that fail to prosper after a plan is put approved. Oliveira (2016) focused his work in the recalibration of the model developed by Altman (1968) using an initial sample of 355 firms that managed to secure a restructuring process in court, from May 2013 to December 2013, to test if it was possible to
15 fundamentally distinguish between companies that have succeed after the “PER” and those who have not. In his study, Oliveira (2016) concluded i) that recidivism took, on average, 644 days; ii) that companies are more prone to file for insolvency then for a second plan; iii) that 41% of the successful reorganizations from 2012 to 2013 have failed; and iv) that ratios analysis profiling did not allow to separate successful from unsuccessful reorganized companies.
3.4. Other Approaches to Corporate Default
Although the purpose of this work leads the literature review towards accounting ratios and the predictability of default events for individual firms, other approaches had been developed to study what can be considered as “the corporate bankruptcy problem”.
One of such other approaches is the work done by Merton (1974) in pricing corporate debt, a topic also researched extensively by Altman. The structural approach of Merton’s model has as fundamental the parallel payoff structure between a company risky zero-coupon bond and a risk-free bond plus a put option on the firm’s value, with a strike price equalling the face value of the debt. According to this theory, a firm’s current assets value is equal to the current market of equity and the current market value of the zero-coupon debt instrument. If at the maturity the assets’ value is lower than the face value of the debt instrument, the rational implies that the company should enter in default. So as long as there is a probability of the firm’s assets being lower than the face value of the debt, there is credit risk and, therefore, a non-zero probability of default. Based on the Brownian geometric distribution of a firm’s assets and that ultimately the shareholders of a firm own the firm’s assets and a put option to sell them to the creditors for the face of the debt, Merton’s model is able to calculate a credit spread for defaultable bonds and the value of the put option owned by shareholders represents the cost of eliminating the credit risk.
While Merton’s approach priced default bonds based on the difference between the yield on a defaultable bond and the yield of the risk-free bond. Other methods are used in this field. Other example are the methodologies used by the credit rating agencies (CRA).
CRAs vary in their methodology to attribute ratings since they do not all look at the issue in a similar manner. Right from the top, the two biggest CRAs share different approaches. While Moody’s issues ratings based on the Merton (1974) developments and calculates a potential expected loss of a given debt, S&P focus is only on the probability of default based on the credit metrics analysis. These approaches should not produce significant differences within issuers’
16 credit quality or debt issues. However, in the lower echelons of credit ratings, this difference could produce a notable difference, with S&P providing slightly better ratings than Moody’s (Bongaerts, Cremers and Goetzmann, 2009).
Another line of thought on this subject comes from the research by Giesecke, Longstaff, Schaefer and Strebulaev (2011), the authors studied corporate bond defaults of nonfinancial firms in the USA, on the period from 1866 to 2008, finding that throughout this timeframe there were several clustered events of corporate defaults and these events are weakly correlated to business downturns. Furthermore, the same research also attested that the credit spreads on these bonds are twice as high as the defaulted losses, which results on an average credit risk premium of roughly 80 basis points within the period of analysis.
3.5. Review of Literature Considerations
Despite the research already realized, bankruptcy prediction models have little to no weight in contributing to the recovery or insolvency law in multiple countries. With the goal of agiling the court procedures, the Portuguese government could have inserted such metrics in the law defining the “PER” procedures, allowing for a faster assessment of healthy, troubled or failed firms and alleviating the courts from the firms that have no capacity to recover and are only seeking to postpone bankruptcy.
One can say that such metrics may be too obstructive to the companies applying, however due to the proven capability of such models, the companies excluded that may be potentially capable of recovery should be in residual numbers. If not, only by being able to compare the score against other companies, the stakeholders in the process may be more alert and informed about the situation and possible outcome of the company in trouble.
One point should be considered here, certain firms in particular sectors may have their financial situation completely indicating a failure and/or imminent bankruptcy, however due to their political, social or ultimately, its systematic effect in the economy, they may be able to restructure its debt multiple times, even entering into a deepening insolvency that harms its creditors. A theoretical example of such situation can be taken from the impact of banks not restructuring the debt of a company employing several thousand workers. In the event of a major employer failing a financial restructuring, there are to most likely scenarios to occur to its workforce: (i) a significant reduction, if the company survives; or (ii) the entirety of the workforce going to unemployed, in the case of insolvency. These unemployed workers, will
17 have their financial capacity reduced and will be lacking funds to comply with all their necessities, which may lead them to default in their mortgage loans. Some may even incur in more loans in order to cope with what they expected to be a transitory phase that end ups to be prolonged through time. In the case of the workers having their mortgages loans or having raised those personal loans to cope with the unemployment phase in the same bank that has lent money to the company, banks are faced with a snowball effect of company defaulting followed by commercial clients defaulting. Therefore, banks, when performing their risk analysis of the lender, also have to the impact it will have in their common stakeholders.
On the contrary, scrutiny over the amounts of debts forgiven by the banks to its corporate clients has raised public awareness since the outbreak of the financial crisis. Due to this banks may also intentionally delay or vote against a restructuring to avoid such public backlash, especially if the financial lender itself was subjected to a state bail-out or received any kind of public funds to cope with the financial crisis.
18
4. Data and Methodology
In order to execute the work necessary to carry out this project, two sets of information were needed. First, the companies that had filed for “PER” since its inception and what was the result achieved, i.e. which of the companies filling for “PER” were able to have a recovery plan approved contemplating their recovery (Data set I) and, second, financial information for Portuguese companies that had filed for “PER” (Data set II).
Data set I was obtained through CITIUS, the Portuguese ministry of justice platform were, among others, information related to “PER” is made available to the public. CITIUS allows to search for the companies that have applied for the “PER” since the program started, which, as previously stated, was approved by the government on April 20th, 2012. However, as there is
no automatic process to retrieve all the data automatically only by retrieving manually each entry information, we were able to compile a database with all the “PER” announcements. A cut-off date was set at December 31st, 2016. At this date, the CITIUS listed 7,008entries under
the “Anúncio “PER” – art 34º - P Citius” label which corresponds to the publication nominating the JAD and the commencement of the “PER” proceedings.
Data set II which corresponds to the financial information for all the valid corporate entries that filled for “PER” and the information was gathered from the Sabi database owned by the Bureu Van Dijk, a Moody’s analytics company.
4.1. Data Analysis
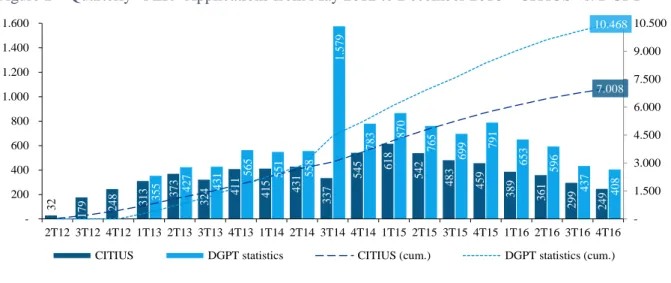
From the CITIUS it was retrieved a list of 7,008 “PER” applications from May 2012 to December 2016. This number differs from the official statistics announced by the DGPT, which refer a total of 10,468 applications in the same period, as observed in figure 2.
Figure 2 – Quarterly “PER” Applications from May 2012 to December 2016 – CITIUS vs. DGPT
3 2 1 7 9 248 31 3 373 3 2 4 41 1 4 1 5 4 3 1 3 3 7 5 4 5 618 5 4 2 4 8 3 4 5 9 3 8 9 3 6 1 2 9 9 2 4 9 - - - 3 5 5 427 43 1 56 5 5 5 1 5 5 8 1 .5 7 9 7 8 3 87 0 7 6 5 6 9 9 79 1 6 5 3 5 9 6 4 3 7 4 0 8 7.008 10.468 -1.500 3.000 4.500 6.000 7.500 9.000 10.500 -200 400 600 800 1.000 1.200 1.400 1.600 2T12 3T12 4T12 1T13 2T13 3T13 4T13 1T14 2T14 3T14 4T14 1T15 2T15 3T15 4T15 1T16 2T16 3T16 4T16
19 However, and taking for example the third quarter of 2014, when Portugal implemented a new judicial map, DGPT refers that the high number of process considered in that period is due to the change in the judicial map, which resulted in the double counting of previous entries that were not yet closed. Due to this, and the fact that the DGPT statistics do not include a list of the entities that applied for PER, the information from CITIUS will be the reference for the work carried out.
One of the goals of the “PER” was to provide companies with a faster process to deleverage their balance sheets with a faster and more efficient court process. However, when the legislation concerning the implementation of the “PER” was put forward, there was not a clear saying that this process was meant only for corporate entities. Due to this, although with a lag when compared to companies, individuals on a personal level started to fill the courts with requests of PER. Figure 3 shows the distribution of “PER” applications, either corporate or individual, from May 2012 to December 2016.
Figure 3 – Monthly Applications for “PER” from May 2012 to December 2016 – CITIUS Information Divided by Companies and Individuals
By December 2016, individuals represented 39.9% of the total number of “PER” applications, having applied more individuals for “PER” during 2015 (1,086) than companies (1,016). Despite individuals applying and the law not forbidding such applications, the courts were more reticent in approving such recovery plans for individuals, with some judges rejecting the individuals “PER” in their earlier stage.
2 8 40 45 7 2 6 0 73 68 8 4 85 8 0 92 1 0 5 8 8 94 6 3 75 8 1 10 1 8 5 90 7 1 9 5 7 5 9 0 7 1 81 6 2 4 5 1 0 1 8 8 6 8 8 7 7 1 1 0 8 7 4 7 0 1 0 1 109 6 1 72 8 8 98 7 7 5 9 7 9 87 93 7 5 6 4 9 1 6 1 5 9 62 5 6 5 3 2 3 0 43 5 2 8 4 7 2 9 1 8 5 1 0 8 1 0 2 1 0 3 11 7 126 130 126 9 0 1 0 8 12 9 141 141 137 1 2 0 1 5 8 1 2 2 1 6 8 1 4 1 1 6 5 9 6 7 6 1 9 8 1 7 3 1 7 4 1 6 7 1 9 7 2 5 4 1 7 7 1 6 8 1 9 7 2 2 1 1 2 3 13 9 15 5 1 5 3 1 5 1 1 2 6 1 1 7 1 4 6 1 3 7 1 2 6 9 8 1 2 2 9 8 7 9 9 4 7 5 80 -50 100 150 200 250 300
20 Although the Portuguese government ascertain in the beginning of 2016 that individuals should also have access to a restructuring process like the PER, only by the end of 2016 the government started the process to introduce changes into the law only allowing corporations to go into PER, therefore closing the loophole that lead to multiple individuals to flood the courts requesting restructuring for themselves.
In order to get a sample that was suitable for the work to be carried out in this study, some adjustment had to be done to the list retrieved from CITIUS. First, the individuals’ applications were excluded, since they are out of the scope of this work, which subtracted 2,795 entries. From the list of 4,213 corporate applications, 186 were excluded due to being duplicate announces for the same “PER” process, 233 were also excluded since they were related to companies with a CAE classification4 belonging to sectors K, O, T and U, all sector of activities to which the Z-score is not applicable5. After the adjustments, we get a sample of 3,794 valid corporate applications for PER, however, the BvD’s Sabi database does not have the complete financial information required for 1,605 of them, which, due to this reason, those companies were also excluded from the final sample.
The filtered final sample of 2,189 companies that applied for “PER” in the period under analysis, from May 2012 to December 2016, is composed predominately by small enterprises (51.0%), followed by micro enterprises (38.3%). With the medium and large enterprises corresponding to only 10.7% of the sample.
Figures 4 presents the sample distribution by company size were it can be observed a significantly difference from the distribution of companies by size in Portugal. Which is due to a proportionately smaller number of micro companies in our sample. This situation probably arises from a database factor, since complete financial information is biased towards bigger and to financial factors, due to a large number of micro enterprises tending to be self-employment companies, which implies a lower company asset value. A lower company asset value, in general, limits the complexity and depth of its liabilities, which in turn makes the unleveraging
4 CAE classification is a list of codes stipulated by the Portuguese government that translate to a particular
economic activity. According to their economic interest, the companies define which CAE apply to their economic activity and/or social purpose.
5 The mentioned CAEs correspond to: Financial and Insurance activities (K); Public Administration and Defence
and Compulsory Social Security (O); Activities of households as employers and undifferentiated goods and services producing activities of households for own use (T); and International organizations and other extra-territorial institutions (U).
21 or shutdown process easier to perform, rendering a process like the “PER” inadequate and/or costly for smaller companies.
Figure 4 – Sample Distribution According to Company Size
Within the sample the Construction industry6 has the higher number of “PER” applications (325), followed by Wholesale (266), Retail (239), Textile and clothing (151), and Real estate (106) some of the industries that were most affected by the latest financial crisis in Portugal, as shown in figure 5.
Figure 5 – Sample Distribution by Industry and Number of “PER” Applications
Figure 6 shows the sample distribution according to the companies’ indebtedness prior to applying for PER. In this case, the weight of Real Estate, that has €1,962M of outstanding debt, rose from 5% to 24%, indicating that the industry was more highly leveraged in comparison with other industries. The second industry with the biggest weight in terms of debt is the Construction with its €1,770M of debt and corresponding to 21% of the sample. The next three
6 This classification was based on the first primary CAE classification of each company according to the
information in the Sabi database. Exception made for the construction and real estate industries, in which a more detailed analysis was carried out since many real estate companies presented as their first primary CAE a construction industry CAE.
96,2% 3,2% 0,5% 0,1% 38,3% 51,0% 9,6% 1,1% 0% 20% 40% 60% 80% 100% Micro enterprises (MIE) Small enterprises (SE) Medium enterprises (ME) Large enterprises (LE) Distribution of companies by size in Portugal
Distribution of companies by size in the sample
15% 12% 11% 7% 5% 50% Construction Wholesale Retail
Textile & Clothing Real estate Others
22 industries have a smaller presence than the previous two, with their cumulative debt only slightly surpassing the Construction industry’s debt (€1,777M). The Wholesale and the Lodging industries both have €598M of debt, followed by the Chemical industry with €582M7 corresponding to the third, fourth and fifth most represented industries, all representing individually around 7% of the sample.
Figure 6 - Sample Distribution by Industry and Total Debt
All districts in Portugal are represented in the sample, ranging from a minimum 5 entries for Horta to a maximum of 477 entries in Porto. The number of “PER” applications and the indebtedness amount do not follow the same rank, indicating that on average the companies in the districts of Lisboa, Setúbal, Faro, and Funchal are more leveraged than the ones from others districts, as shown in Table 1. It should be noted that these districts are also some of the most touristic destinations in Portugal, where Real Estate firms with large ventures are more implemented and their more leveraged nature is reflected in this rank.
7 Of the €582M, €574M correspond to a single company named Artlant. Artlant was a major investment, with
government support, in Sines for a PTA factory, which had one of its main shareholders, La Seda Barcelona, liquidated in February 2014. 24% 21% 7% 7% 7% 34% Real estate Construction Wholesale Lodging Chemicals Others
23
Table 1 – Sample Distribution by District with Number of “PER” Applications, Debt, and Number of Employees
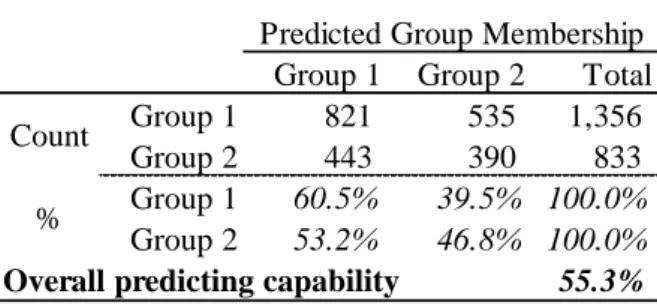
The number of successful/unsuccessful companies and the current activity status are presented in table 2. From the selected sample of 2,189 companies, 1,328 or 60.7% have currently attributed the active status by the BvD’s Sabi database. This distribution is similar to the one obtained when analysing the sample for the companies that were successful or unsuccessful8, i.e., the companies that succeed in firming a recovery agreement and those who did not. The sample has 1,356 companies that were successful in achieving an agreement. However, although there is an evident direct relation, still 20.6% of the companies that succeed in achieving a recovery plan are currently non-active, as well as 30.3% of the companies that were unsuccessful are currently active.
8 Companies were deemed successful if they achieved an agreement for a recovery plan. These agreement could
be achieved either directly through the “PER” procedure or if the company initially fails to obtaining it through the “PER” procedure in the later stages as an insolvency recovery plan.
District Count Debt
Number of employes Porto 477 1,196,303 16,512 Lisboa 409 2,515,471 15,009 Braga 281 539,006 8,646 Aveiro 196 492,537 5,784 Leiria 131 406,429 3,042 Santarém 126 234,796 2,924 Setúbal 98 878,370 3,914 Coimbra 73 133,345 2,044 Viseu 68 139,772 2,350 Faro 61 1,029,409 2,134 Funchal 51 312,275 2,091 Ponta Delgada 33 59,795 837 Castelo Branco 28 55,247 542 Viana do Castelo 28 27,308 420 Évora 26 58,068 542 Vila Real 24 21,167 262 Angra do Heroísmo 19 44,978 661 Portalegre 16 89,125 286 Bragança 15 11,256 234 Guarda 14 56,322 507 Beja 10 17,188 116 Horta 5 10,589 139 Total 2,189 8,328,756 68,996
24
Table 2 – Sample Distribution by Successful and Unsuccessful Companies and Current Activity Status
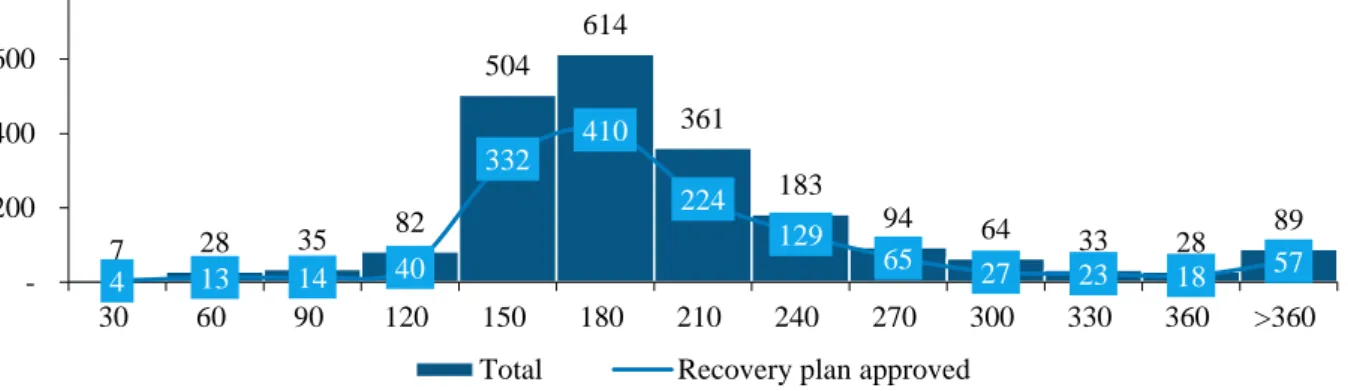
Figure 7 plots the sample distribution according to the time taken to close the “PER” process. Considering the timeline given for the “PER” (see figure number 1), it would be expected that most processes would be concluded within 120 to 150 days after the “PER” submission is publicized on CITIUS, however, in the sample the average time for closing is 189 days, with 50% of cases taking 168 days and with 80% of the cases closing within 229 days after the initial publication. The results for the companies that had a plan approved are quite similar, with an average of 190 days, 50% in 170 days, and 80% within 222 days. Some of the reasons causing such delays have already been mentioned on the second section of this work.
Figure 7 – Sample Distribution by Time Taken to Close the “PER” Process.
Active Non-active Total
Successful 1076 280 1356 Unsuccessful 252 581 833 Total 1328 861 2189 7 28 35 82 504 614 361 183 94 64 33 28 89 4 13 14 40 332 410 224 129 65 27 23 18 57 -200 400 600 800 30 60 90 120 150 180 210 240 270 300 330 360 >360
25
4.2. Methodology
As already mentioned, the exercise to be performed on the sample collected is based on Altman and Hotchkiss (2006) work, in particular the Z’-score metric.
The Z’-score is merely an adaptation to privately held companies of the original Z-score developed by Altman in 1968, and as such has the same underlying methodology as the original Z-score, and the later ZETA score.
Altman “scores” use a Multi Discriminant Analysis (MDA) as its base statistical technique. MDA allows the classification of an observation into one of several a priori groups dependent of the intrinsic characteristics of the observation. This technique was first used in the decade of 1930 and is commonly used to classify or make predictions in situations where the dependent variable appears in the qualitative form (Altman, 1968) and the resulting classification is generally of a binary nature, e.g. yes or no, bankrupt or non-bankrupt (as used by Altman), or successful or unsuccessful (the classification used in this work).
MDA classifies an observation into one of several a priori groups considering the individual characteristics observed. After the groups are defined, MDA attempts to derive a linear combination that best differentiates between the groups. The multivariate analysis has the advantages of analysing a full set of ratios common to the companies and reducing the dimensions to G-1, where G equals to the number of a priori groups. Therefore, an analysis on bankruptcy becomes a discriminant function like:
Z = v1X1 + v2𝑋𝑋2 + … + vn𝑋𝑋n (1) Where:
v1, v2, …, vn = discriminant coefficients
𝑋𝑋1, 𝑋𝑋2, …, 𝑋𝑋n = Independent variables
Z = overall score
By using a MDA, one can use an undetermined number of characteristics to define a sample. However, in bankruptcy studies, most have come with solutions using on average six characteristics, this situation arises from ratios computed using information on a company balance sheet having an a priori tendency to have a significant level of correlation between them. Apart from this, the gains obtained from adding more variables may not compensate the
26 additional problem complexity and the added difficulty in obtaining all the necessary information to compute them.
Through the use of the above methodology, Altman (1968) firstly formulated the “original” Z-score, from a list of twenty-two ratios, and concluded that the best model to predict bankruptcy would be: Z = 1.2x1 + 1.4x2 + 3.3x3 + 0.6x4 + 1.0x5 (2) where: X1 = Working capital Total assets X2 = Retained earnings Total assets
X3 = Return on total assets = EBIT Total assets X4 = Market value of equity
Book value of total liabilities X5 = Asset turnover = Sales
Total assets Z = Overall index or score
The discriminant score, or Z-score, that best served as “cut-off point” to indicate a firm as bankrupt or “non-bankrupt” was fixed in 2.675. Firms with a Z-score lower than 1.81 were all bankrupt, as firms with scores higher than 2.99 were all “non-bankrupt”. The area between the aforementioned values was considered the “grey area” due to the susceptibility to error classification.
The ZETA® score was formulated with Altman et al. (1977) research. The authors considered the coefficient values to be industrial property and only released to the public, the ratios that constituted the model:
X1 = Return on assets = EBIT Total assets
X2 = Stability of earnings = σ
2(EBIT
n-1;…;EBITn-10)
27 X3 = Debt service = Coverage ratio = EBIT
Interest payments
X4 = Cumulative profitability = Current assets Total assets X5 = Liquidity = Current ratio = Current assets
Current liabilities X6 = Capitalization = Equity market value
Total capital X7 = Size = Total assets
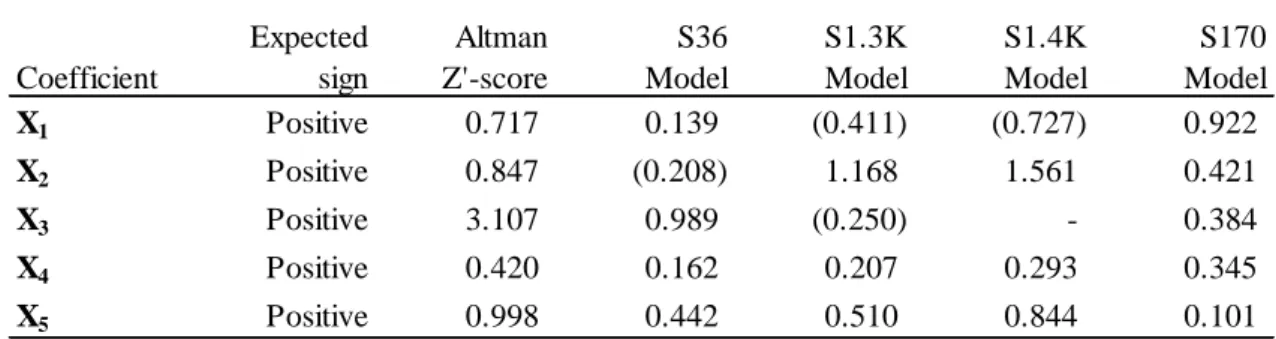
Further developments made by Altman and Hotchkiss (2006) reformulated and recalibrated the 1968 Z-score in order to construct a model that could be used in privately held companies. This model is the base of this dissertation work and has the following formulation:
Z' = 0.717X1 + 0.847X2 + 3.107X3 + 0.420X4 + 0.998X5 (3) where:
X1 = Current assets - current liabilities Total assets
X2 = Retained earnings Total assets X3 = EBIT
Total assets
X4 = Book value of equity Total liabilities X5 = Sales
Total assets
Z' = Overall index or score
As previously stated the cut-off points were also revised and were defined at: more than 2.9 defining “Safe Zone”; from 2.9 to 1.23 lays the “Grey Zone”; while scores below 1.23 are considered to be in the “Distress zone”.
28 Before advancing to the recalibration of Altman’s Z’-score, a brief profile analysis will be performed on the sample. The analysis will include the variables used in the computation of Altman’s Z’-score as well as five other variables, as listed below:
R6 = Net debt EBITDA
R7 = EBITDA margin =
EBITDA Sales
R8 = Interest coverage ratio = EBIT Interest expenses
R9 = Leverage ratio = Total debt Total equity
R10 = Current ratio = Current assets Current liabilities
These ratios are only considered for the profile analysis having no use in the models to be tested. The reason for their inclusion in this analysis, is due to their broaden use in corporate advisory services as the ratios that more easily covey information on the health of a company and the capacity or incapacity of such company repaying its debts. Although it was not the intention, one can observe that some of these ratios are included in Altman’s ZETA® score, and, since this is a proven bankruptcy model, it entails the capacity these extra ratios have in predicting bankruptcy and/or company distress.
29
5. Empirical Findings
5.1.
Descriptive Statistics and Profile Analysis
Two groups were formed from the selected sample of 2,189 companies, one with 1,356 that correspond to the companies that were successful in firming a recovery plan and another group with 833 companies that were unsuccessful.
From the ratios used in Altman’s model, it was observed that the group of unsuccessful companies usually presented worst ratios than successful companies within the three years prior to filling for PER.
The most relevant case is that of variable X1 where in the year prior to filling, the successful
companies average ratio stands at working capital corresponding to a negative 12.5% of total assets, while the unsuccessful companies stands at negative 38.2%. Two ratios present a better value mean for unsuccessful companies than successful companies, variable X2 and X3.
Unsuccessful companies present a mean value for X2 of 0.746 against 0.949 of the successful
companies, while at the same time the return on total assets has also a better mean value for unsuccessful companies with -24.1% against -28.0%.
Despite the better results obtained in the year prior to “PER” in some ratios, in both cases, when analysing the second and third year the results for unsuccessful companies are always worse than the successful companies, as shown in figure 8.