Equity Research - Wendy's Co
54
0
0
Texto
(2) MASTER OF SCIENCE IN FINANCE. MASTERS FINAL WORK PROJECT. EQUITY RESEARCH: WENDY’S CO. LUÍS GAIVÃO VAZ PINTO. SUPERVISOR: PROFESSOR PEDRO RINO VIEIRA. OCTOBER 2019.
(3) Abstract This report was prepared in the context of ISEG’s Master in Finance, as the final project, and is focused on the evaluation of Wendy’s Company, a fast-food burger chain. The report was drafted in accordance with the recommendations of the CFA Institute and is based on the information publicly available until June 30, 2019. We chose Wendy’s Company firstly because of the unique way the same has been able to adjust itself to the new features and opportunities made available by the social media, and also because we believe that our evaluation skills can be better developed in the context of the evaluation of a company with which we have never had contact before. The target price per share of $23.75 was calculated based on the Discounted Cash Flow Method at the year end of 2020F. This target price represents a BUY recommendation with medium risk. By way of introduction, this report highlights the most significant moments of the company’s history, followed by a description of its strategy and business model, explaining the key drivers of profitability, as well as the board organization and its principal stockholders. The report includes a high-level assessment of the world’s economic environment, with particular emphasis on the US economy, where the company has its most significant presence, and the description of the industry and its main future challenges. Against this background, the assumptions for the company's performance for the coming four years were based on its performance in the previous five years. Based on these assumptions, we calculated the future Cash Flows and the Cash Flow for the perpetuity, and these were discounted by the end of 2020 with a discount rate calculated by us. As previously mentioned, this valuation reflects a Buy recommendation, and our recommendation is supported by the multiples valuation method with which we got an average target price per share of $ 22.69, which represents a BUY recommendation. We further evaluated the company based on the Dividend Discount Model. However, the result was inconclusive because Wendy’s Company does not have a stable payout policy. Since there are some risks associated with these evaluations, we performed some sensibility analysis, as well as a Monte Carlo simulation. From these analyzes, it is worth highlighting the variables associated with the terminal period, especially the discount rate for the perpetuity and the eternal growth rate. JEL classification: G10; G32; G34; Keywords: Equity Research; Valuation; Wendy’s Corporation; Fast-Food Chain. i.
(4) Resumo Este trabalho é uma avaliação da cadeia americana de fast-food Wendy’s corporation, e foi realizado no âmbito do projeto final do Mestrado em Finanças no ISEG. O relatório foi escrito de acordo com as recomendações do CFA Institute . O projecto é baseado na informação pública disponível até ao dia 30 de Junho de 2019. O interesse que foi despertado e levou a escolher esta empresa foi a forma singular como a mesma se tem adaptado nos últimos anos aos novos desafios das redes sociais. Por outro lado, o desenvolvimento de ferramentas de avaliação poderiam ser aperfeiçoado com a escolha de uma empresa com a qual nunca houve contacto directo. O preço por acção de 23.75$ no fim do ano de 2020 foi obtido através da avaliação pelo Discounted Cash Flow method. Este preço sugere uma recomendação de compra, apesar do seu risco médio. Este relatório começa com a narração dos momentos mais importantes da história da empresa, após a qual é feita uma breve descrição da estratégia e modelo de negócio da Wendy’s, explicando os principais condutores de rentabilidade, bem como a forma de organização da direção e os seus principais accionistas. Em seguida é apresentado um breve estudo da economia mundial, focado no mercado dos Estados Unidos da América (EUA) – onde a empresa tem uma presença mais significativa. Posteriormente expõe-se o funcionamento da indústria da Wendy’s e os seus principais desafios para o futuro. Após estes estudos, foram elaborados os pressupostos para os próximos 4 anos da empresa, tendo por base os últimos 5 anos . Com estes pressupostos foram previstos os próximos fluxos de caixa, assim como o fluxo de caixa para a perpetuidade, sendo os mesmos descontados com uma taxa de desconto também ela estimada. Como foi dito anteriormente , o resultado desta avaliação é uma recomendação de compra. Esta conclusão é suportada pela avaliação elaborada através do método dos múltiplos, com o qual se obteve um preço por acção de 22.69$. Também foi realizada uma avaliação pelo método dos dividendos, cujo resultado foi inconclusivo, uma vez que a empresa não tem uma política de payout estável. Existem alguns riscos associados a esta avaliação, pelo que foram efetuadas. análises de. sensibilidade e uma simulação de Monte Carlo. As variavéis que merecem destaque são sobretudo as que dizem respeito aos riscos associados com o período final, nomeadamente a taxa de desconto para a perpetuidade e a de crescimento eterno. Classificação JEL: G10 ; G32; G34; Palavras-Chave: Equity Research; Avaliação de Empresas; Wendy’s Corporation; Cadeia de FastFood. ii.
(5) Acknowledgements The submission of this project means the end of a very significant phase of my life. This space will be used to thank everyone who all along it have helped me so much. First of all, I thank my supervisor, Professor Pedro Rino Vieira, for his availability and patience during my work on the thesis: even when time was scarce and the deadline seemed impossible to meet, he always provided me with strength and motivation. I thank, as well, to all the teachers, who greatly increased my knowledge and who constantly made me do more and better, and to all the colleagues that accompanied me during this journey. I am deeply thankful to my family, my support along these years, in particular to my mother, brother and sisters, who helped me in very different yet decisive ways. To my grandmother and to her sisters that, while present among us, always were so proud of each new step in my life, and who, I am sure would have felt the same regarding this one. To Madalena, for giving me the motivation and the strength to embark on this journey and for all through it helping me to be persistent and demanding and to not discourage in times of greater pressure. To Zachary, who in his limited free time managed to revise my draft thesis. Thank you all so much!. iii.
(6) Index. Abstract. i. Resumo. ii. Acknowledgements. iii. List of Figures. v. List of Tables. vi. 1. 2. 3. 4. 5. 6. 7. 8.. Research Snapshot Business Description Management and Corporate Governance Industry Overview and Competitive Positioning Investment Summary Valuation Financial Analysis Investment Risks. 1 2 6 7 10 11 17 18. Appendix 1: Statement of Financial Position. 23. Appendix 2: Income Statement. 24. Appendix 3: Cash Flow Statement. 25. Appendix 4: Key Financial Ratios. 26. Appendix 5: Common-Size Statement of Financial Position. 27. Appendix 6: Common-Size Income Statement. 28. Appendix 7: Forecasting Assumptions. 29. Appendix 8: WACC Assumptions. 31. Appendix 9: Discounted Cash Flow Assumptions. 32. Appendix 10: Multiples Assumptions. 33. Appendix 11: Monte Carlo Simulation. 34. Appendix 12: Dividend Discount Model. 36. Appendix 13: Adjusted Present Value Computations. 37. Appendix 14: Free Cash Flow to Equity Computations. 38. Appendix 15: Porter’s Five Forces. 39. Appendix 16: Sensitivity Analysis. 40. Appendix 17: Relative Valuation vs Price. 41. Appendix 18: CFA Recommendation System. 42. References. 43. Abbreviations. 45. iv.
(7) List of Figures Figure 1: Historical Share Price ______________________________________________________ 1 Figure 2: Wendy's Logo ____________________________________________________________ 2 Figure 3: Wendy's Sales Distribution __________________________________________________ 2 Figure 4: Global System Worldwide ___________________________________________________ 2 Figure 5: Same-Restaurant Sales ____________________________________________________ 2 Figure 6: Adjusted EBITDA _________________________________________________________ 2 Figure 7: FCFF ___________________________________________________________________ 3 Figure 8: WEN and Comparables EBIT Margins _________________________________________ 3 Figure 9: WEN and comparables Net Income ___________________________________________ 3 Figure 10: Wendy's ownership at 09/05/2019 ___________________________________________ 5 Figure 11: Total Stockholders return __________________________________________________ 5 Figure 12: Board organization _______________________________________________________ 5 Figure 13: Board Composition _______________________________________________________ 6 Figure 14: CEO Pay Mix ____________________________________________________________ 6 Figure 15: Other Neo Pay Mix _______________________________________________________ 6 Figure 16: Real GDP Growth ________________________________________________________ 7 Figure 17: Forecast Growth _________________________________________________________ 7 Figure 18: Forecast Prices Increase __________________________________________________ 7 Figure 19: QSR Industry Revenues in USA _____________________________________________ 7 Figure 20: 5 Forces Porter __________________________________________________________ 8 Figure 21: WEN Revenues __________________________________________________________ 8 Figure 22: WEN EBIT ______________________________________________________________ 8 Figure 23: WEN Revenues __________________________________________________________ 8 Figure 24: WEN Revenues by Type ___________________________________________________ 9 Figure 25: WEN Expenses by Type ___________________________________________________ 9 Figure 26: WEN CAPEX ___________________________________________________________ 11 Figure 27: WEN Debt _____________________________________________________________ 11 Figure 28: WEN D&A _____________________________________________________________ 12 Figure 29: WEN Total ∆ NWC ______________________________________________________ 12 Figure 30: WEN FCFF ____________________________________________________________ 12 Figure 31: WEN EBITDA __________________________________________________________ 12 Figure 32: WEN Net Income________________________________________________________ 17 Figure 33: WEN EBIT & EBIT Margin ________________________________________________ 17 Figure 35: WEN Net Profit Margin ___________________________________________________ 17 Figure 36: WEN Total Assets & Equity Ratio ___________________________________________ 18 Figure 37: WEN Gross Profit Margin _________________________________________________ 18 Figure 38: WEN EPS _____________________________________________________________ 18 Figure 39: WEN Debt _____________________________________________________________ 18 Figure 40: WEN ROE _____________________________________________________________ 18 Figure 41: WEN Current Ratio ______________________________________________________ 19 Figure 42: WEN Total Assets Turnover _______________________________________________ 19 Figure 43: Risk Matrix_____________________________________________________________ 19 Figure 44: Recommendations probabilities ____________________________________________ 22 Figure 45: Monte Carlo Sensitivity price distribution _____________________________________ 22. v.
(8) List of Tables Table 1: Analyst’s Risk Assessment ___________________________________________________ 1 Table 2: Forecast commodities increase _______________________________________________ 7 Table 3: Recommendations by price for medium companies_______________________________ 10 Table 4: WEN Net Working Capital ($ millions) _________________________________________ 12 Table 5: WEN DCF output _________________________________________________________ 13 Table 6: WEN WACC Rate _________________________________________________________ 13 Table 7: WEN Price/Sales relative Valuation ___________________________________________ 16 Table 8: WEN EV/EBITDA relative Valuation ___________________________________________ 16 Table 9: Peers Group _____________________________________________________________ 16 Table 10: Peers Group Median Ratios ________________________________________________ 16 Table 11: Relative and absolute valuation comparison ___________________________________ 16 Table 12: Effects of change in terminal growth rate and WACC rate _________________________ 20 Table 13: Effects of change in RF and in the terminal Debt Weight __________________________ 21 Table 14: Effects of change in COGS % and in the growth rate for explicit period ______________ 22. vi.
(9) Wendys Co BUY Medium risk 30 June 2019. Portugal. WEN: Deliciously Different (YE2020 Price Target of $ 23.75 (+21.3%); recommendation is to BUY). 1. Research Snapshot Table 1: Analyst’s Risk Assessment. BUY is our recommendation for Wendy's Company (WEN) with a price target of $23.75 at the end of 2020, using the Discounted Cash Flow method. Relative valuation through multiples supports our view that. Source: Author. Our risk assessment estimates a medium risk for WEN.. WEN is currently undervalued, as this method offers an upside potential of 15.88% from its latest closing price, June 30 of 2019, of $ 19.58, although with medium risk. The main driver of WEN revenues has come from the franchisees, which represent 59% of the total revenues. In the recent years, WEN has made some adjustments to its modus operandi, with a lot of restaurants managed by the company becoming franchised. This resulted in a significant of the Net Income of 2018. WEN wants to maintain the actual proportion of Franchised/companyoperated restaurants. While WEN has a strong presence in the North American market, it does not have a significant international presence. In fact, one of the company’s goals is to expand its business to the international markets, as well as, to expand its brand throughout the world, thereby increasing the company’s value. Although entry costs into the fast-food market are low, it’s quite challenging to have a strong brand and to be recognized in this segment. If we look at this industry in developed countries, we find a mature market, although growth is difficult. If we look at emerging markets, there are good opportunities to enter and expand the business. This is what most of Wendy’s competition has been doing and it’s what Wendy’s is starting to do, and this can be an important step toward sustained growth. This expansion is being made through the establishment of new franchising partners.. 1. Figure 1: Historical Share Price Source: Reuters and Author.
(10) 2. Business Description. Figure 2: Wendy's Logo Source: Wendy’s Story. Wendy’s History: Wendy’s is an international fast-food company founded in 1969 by Dave Thomas in Columbus, Ohio. By 1978, Wendy’s had already opened a thousand restaurants, including in Canada. By 2001, Wendy’s had established six thousand restaurants in Canada. Figure 3: Wendy's Sales Distribution Source: WEN Annual Report 2018. and the USA. In 2008, Triarc announced the acquisition of Wendy’s, and its name changed to Wendy's/Arby's Group, Inc. Currently, the company owns, operates, and franchises fast-food restaurants located throughout countries such as the United States, Singapore, the Middle East, North Africa, the Russian Federation, the Eastern Caribbean, Argentina, the Philippines, and Japan. Wendy’s is settled in 6711 places in the world, but the company only owns 353 of. Figure 4: Global System Worldwide Source: WEN Proxy Statement 2019. them. Wendy’s is recognized for its high-quality food and creative advertising. Wendy’s doesn’t sell food to franchisees but rather has selected suppliers with agreed prices and costs that supply the ingredients to each restaurant. Figure 5: Same-Restaurant Sales Source: WEN Proxy Statement 2019. Wendy’s operational segment The main business of Wendy’s is fast food meals, which in some restaurants. include. breakfast.. WEN. specializes. in. hamburger. sandwiches, chicken filet sandwiches, nuggets, chili, French fries, baked potatoes, freshly prepared salads, and desserts. Two-thirds of Wendy’s sales come from pick-up/ drive through windows available in its restaurants. Nearly 95% of Wendy’s restaurants are franchised, and the company has very standardized processes to keep the food’s high quality, clean-up, and to train the employees. Wendy’s internal auditors make regular visits to evaluate each restaurant and give recommendations to improve its quality.. 2. Figure 6: Adjusted EBITDA Source: WEN Proxy Statement 2019.
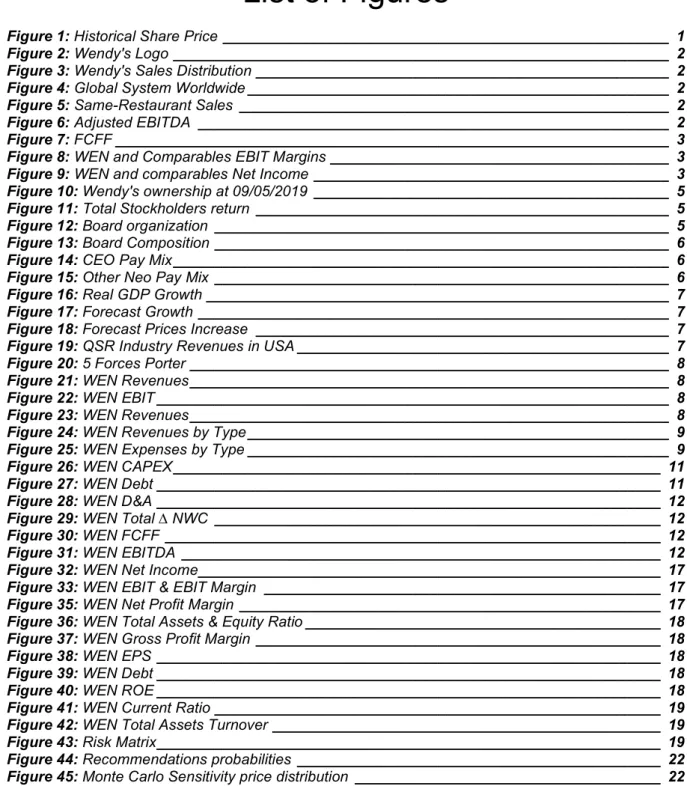
(11) Wendy’s Market Share According to QSR magazine, in 2018, Wendy’s was the world third-largest quick-service restaurant burger, following McDonald's and Burger King,. Figure 7: FCFF Source: WEN annual report 2018. with a market share of 3.7%, and the brand was ranked in the sixth position in the quick-service restaurant segment. As we can see in figure 3, the most significant stake of Wendy’s sales in 2018 came from the North American Market (95%), with a residual percentage coming from the rest of the world. Most of Wendy’s restaurants are franchised. Company only operates restaurants in North America. Company key drivers of profitability In 2018 Wendy’s revenues increased roughly 30%. This growth can be. Figure 8: WEN and Comparables EBIT Margins Source: Bloomberg. explained by a rise in the sales from company-operated restaurants, an increase in franchise rental income and additional advertising funds that came from franchisees. The sales from company-operated restaurants in 2018 totalled $ 651.6 million, against $ 622.8 million in 2017, which represented an increase of 4.6%. According to the company’s financial report for 2018, this increase was due to the rise of 1.3% of company-operated same-restaurant sales, and to an increase in the number of company-operated restaurants in operation during 2018, as opposed to 2017. In 2017, the company suffered a decrease in sales, and this was explained by the sale of some company-operated restaurants to franchisees which resulted in a reduction in sales of 316.4 million. However, same-restaurant sales increased in both years and both types of restaurants: franchised and company-operated restaurants. In 2017 and 2018, the increase of the level of same-restaurant sales was respectively 2.2% and 1% for franchised restaurants and 0.2% and 1.3% for company-operated restaurants. The increase in same-restaurant sales was due to the rise in average per customer check amount, and not to the number of customers, which decreased in both years. The increase of the average per customer check amount can be explained by the changes in product mix, and the strategic price increases of company’s menu items. The increase in franchise revenue during 2018 was due to the end of the image activation program in 2017, as well as to an increase of the number. 3. Figure 9: WEN and comparables Net Income Source: Bloomberg.
(12) of franchised restaurants. Also, mentioned above, it is also explained by the 1 % rise of same-restaurant sales. The small decrease in franchise fees during 2018 was because of changes in accounting policies. In relation to cost, the firm increased their percentage of revenues expensed as cost of sales in the past two years. In 2018 the percentage of sales expensed as cost of sales increased 1% while in 2017 it had increased 1.5%. These increases were explained by the Company as being primarily due to a rise in restaurant labour rates, higher commodity costs and higher insurance costs, partially offset by benefits from strategic price increases of the menu items. Wendy’s uses the following measures as key drivers of profitability: . Same-restaurant sales- which refers to the difference in revenue generated by the company’s existing restaurants over a certain period, compared to an identical period ended 15 months before.. . Restaurant margin- Restaurant margin is the revenue of company-operated restaurants minus the operational costs divided by the revenue of company-operated restaurants.. . Systemwide sales- which refers to the total amount of the chain’s sales, including company-operated restaurants and franchised restaurants. This indicator, which totalled $10,283.2 million in 2017, increased by 3.5%, when compared to the total of $9,930.2 million in 2016. The increasing is explained by the increase in international franchised sales by 14.8%, as well as the increase in North America systemwide-sales by 3%. In 2018, systemwide-sales increased by 1% due to the increasing of international systemwide franchised sales by 13% and to the increasing of North America systemwide-sales by 2%.. . Average Unit Volumes – This indicator consists of the sum of average weekly sales of all company-operated restaurants and is stated in thousand US Dollars. There was a small increase in these figures, from 1545.9 in 2016 to 1580.4 in 2017 and to 1596.1 in 2018. However, this indicator decreased with respect to international franchised restaurants, which according to the company was due to the instability of the relevant countries, as well as the impact of the currency fluctuations.. 4.
(13) Company strategies Fast food restaurants usually follow a cost leadership strategy. However,. Figure 10: Wendy's ownership at 09/05/2019 Source: Nasdaq. WEN’s strategy is slightly different. This fast-food company tries to achieve a balance between cost leadership and differentiation. WEN wants to improve its efficiency without putting the quality of its products at stake. This commitment is illustrated by one of the company’s slogans “fresh but not frozen food”. As a result, WEN has opted not to charge lower market prices to ensure the quality of its products. This may be considered a risky strategy, but we have seen the emergence of new brands offering superior products at slightly higher prices. Chipotle and Panera are two good examples of this strategy. This is a new. Figure 11: Total Stockholders return Source: WEN Proxy Statement 2019. segment inside the fast-food sector that is recognized by this type of approach, which is called fast-casual food, and millennials seem to like it. A fast-casual restaurant offers the facilities of the typical fast-food restaurant but with a more welcoming space. Millennials are very concerned with their health and try to maintain a balanced diet. WEN is aware of these concerns and is trying to make a transition to meet the interests of this universe of population. With this aim, the firm is investing in the development of healthier products. WEN is also currently changing the brand image to become a reference to the new generations. WEN is still using the freckled little girl with red braids as the company’s logo, but now she is an effective spokeswoman and a millennial. The fast-food segment needs to be very efficient to maintain low prices, and one of the top winning strategies is technology investment, which allows the company to be more efficient. The company is aware of that and will continue to invest in technology. The company is still investing in digital marketing. WEN launched an “image activation program”, to remodel its restaurants, including company-operated and franchised restaurants, with the aim of adjusting the design of the restaurants to the new times and to convey the idea of cleanness. This program was essential to the increase the chain’s sales.. 5. Figure 12: Board organization Source: WEN Proxy Statement 2019.
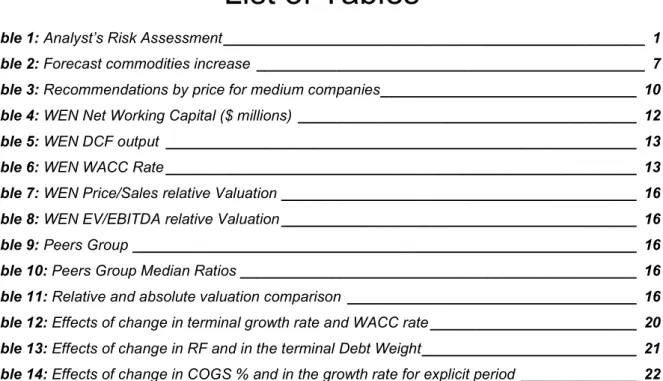
(14) WEN has a poor geographic coverage outside of the North American Market (Canada and USA), but now is trying to expand its market. Figure 13: Board Composition Source: WEN Proxy Statement 2019. coverage. The firm believes that the best way to generate long-term value for stockholders is expanding to more countries, especially to markets where the wages are lower than in the US.. 3. Management and Corporate Governance Shareholder Structure Wendy’s restaurants, LLC is 100% owned by Wendy’s company. Wendy’s Company is 17.39% owned by Trian Fund, 9.65% by Vanguard Group, 9.19% by BlackRock, 5.18% by WELLS FARGO, 4.40% by Eminence Capital and the other 54.19% is owned by other institutional holders. The Wendy’s Company’s corporate predecessor was incorporated in Ohio in 1929 and was reincorporated in Delaware in June 1994. Effective. Figure 14: CEO Pay Mix Source: WEN Proxy Statement 2019. September 29, 2008, in conjunction with the merger with Wendy’s, the Company’s corporate name was changed from Triarc Companies, Inc. (“Triarc”) to Wendy’s/ Arby’s Group, Inc. (“Wendy’s/Arby’s”). Effective July 5, 2011, in connection with the sale of Arby’s Restaurant Group, Inc. (“Arby’s”), Wendy’s/Arby’s changed its name to The Wendy’s Company. Management and Corporate Governance The Company’s Board of directors is the ultimate decision-making body of the Company, except concerning matters reserved to the stockholders. The. stockholders. elect. WEN’. Company. Board.. The board should have between 7 and 15 members. Currently, it has 11 members. The majority of Board directors should meet the independence criteria required by the applicable rules and listing standards of the NASDAQ Stock Market. The company’s Board should always have an Audit Committee, a Compensation Committee, and a Nominating Committee, and these committees must be composed of independent directors only. The Board can have more committees if it deems necessary or appropriate.. 6. Figure 15: Other Neo Pay Mix Source: WEN Proxy Statement 2019.
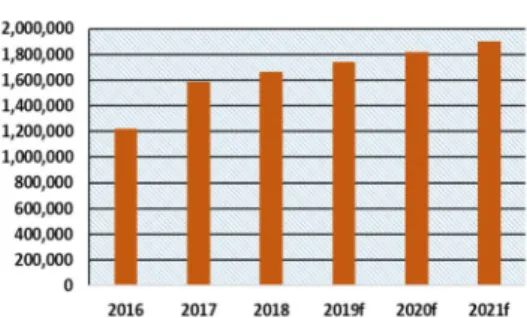
(15) 4. Industry Overview and Competitive Positioning. Figure 16: Real GDP Growth Source World Bank. Global Economy Outlook The Quick Service Restaurants (QSR) industry is sensitive to the economic cycles, and there is currently positive global economic outlook. The World Bank estimates an increase of the World’s GDP for 2019 of 2.9%. However, it is worth noting that in 2018 the GDP grew 3%, which means that the economy will slightly (0.1%) slowdown this year. Some events are affecting the economy, such as the trade war between the USA and China (which will possibly be extended to Europe), Brexit,. Figure 17: Forecast Growth Source: World Bank. and the rise of interest rates. The latter affects the more indebted countries. The World Bank believes that this deceleration will continue in the next years.. USA Economy Outlook WEN has its strongest presence in the US market. The World Bank forecasted that the growth of the US market would slightly slow down from 2.9% in 2018 to 2.5% in 2019, and this tends to get worse: the. Figure 18: Forecast Prices Increase Source: Deloitte. forecast for 2021 anticipates 1.6% growth. International Economy Outlook The evolution of the markets outside North America market is more difficult to forecast. WEN is present in a lot of developing countries where there is some political instability. This was the case of Venezuela, and the countries in the Middle East. If the world economy decelerates, these. Table 2: Forecast commodities increase Source: World Bank. countries will suffer more than developed countries. However, the forecasts are positive, and the World Bank estimates a 4.2% growth for developing countries in 2019, which is the same as 2018. Industry Overview. Figure 19: QSR Industry Revenues in USA. WEN is part of QSR industry. This industry had been growing over the years, as illustrated in figure 19, in the USA. 95% of WEN’s revenues has come from the North American market, the USA. being. the. major. contributor. to. these. revenues.. Fast-food companies’ most significant costs are food, raw materials and employment.. 7. Source: Statista.
(16) As illustrated in figure 18, which is based on Deloitte forecasts, the. Figure 20: 5 Forces Porter Source: Author. employment costs will increase soon. Fast Food companies should have a concern to adapt their operations in order to reduce the number employees required for each establishment. On the FY 2018, the weight of operational costs increased due to the increase of wages. With respect to food and raw materials costs, the World Bank foresees that the same will not increase in the future. The estimated CAGR of the quick services restaurants segment until 2022 is 4.61%. These are good news to the industry.. Figure 21: WEN Revenues Source: Author and Company data. Competitive Positioning SWOT Analysis: Strengths: . Strong brand image: Wendy’s has maintained a strong reputation. Quality, excellent restaurant service, and fresh ingredients are the brand’s main characteristics.. . Successful entrance in new markets: despite the weak geographic dispersion, Wendy’s has been well succeeded in the new markets where it entered.. . Figure 22: WEN EBIT Source: Author and Company Data. Strong distribution network: Wendy’s has been paying particular attention to its distribution network. The company wants to keep its coverage, retaining proximity to suppliers. The quality of raw materials is of essence.. . Strong training program for employees: Wendy’s has very well-defined training programs for employees. In a sector where it is hard to hire and to retain employees, the existence of an adequate training program for employees may be essential to attract and retain human capital.. 8. Figure 23: WEN Revenues Source: Author and Company data.
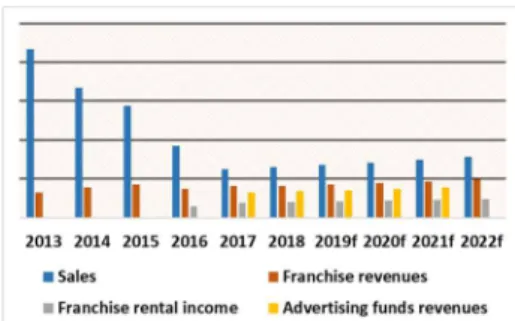
(17) Weaknesses: . Poor geographic coverage: 95% of WEN’s restaurants are. Figure 24: WEN Revenues by Type Source: Author and Company data. located in North America. . Low profitability rate: WEN has higher prices comparing to its competitors. However, its profitability is lower, and this could be explained by the higher investment in employees' training, more perishable products (not frozen ingredients) and because Wendy’s has a high days sales in inventory.. . Perceived as unhealthy. . Products easily imitable. . Low investment in technology. Opportunities: . Global Expansion: Expansion to new markets and new. countries. . Business Diversification: WEN is looking for new businesses.. . Growth of the fast-casual segment: People are increasing awareness of their health and therefore looking for healthier food. Fast-casual is a concept perceived as less harmful to health than fast-food but with slightly higher prices. Nowadays, this segment is growing. WEN is recognized for being healthier than competitors, which can be used as an opportunity. Conversely, this could be seen as threat if Wendy’s stops improving the quality of its meals.. Threats: . Franchisees financial health. . New healthy alimentation waves. . Environmental concerns. . Greater local suppliers’ power. . Wage increases: The fast-food segment has a high employee turnover and low wages.. 9. Figure 25: WEN Expenses by Type Source: Author and Company data.
(18) Porter 5 forces 1.. Competitive rivalry or competition (Strong force) - High level of players and low switching costs.. 2.. Bargaining power of buyers or customers (Strong force) – In spite of the considerable number of small clients, the high number of players and the low switching costs result in significant power of costumers.. 3.. Bargaining power of suppliers (Weak force) - There is a high number of suppliers. Consequently, each of them when considered separately does not the ability to influence the price.. 4.. Threat of substitution (Strong force) - There is a significant threat of new substitutes, the potential alternatives ranging from new food chains to small local restaurants.. 5.. Threat of new entry (moderate force) - Besides the high level of supply and the low entrance costs, there are significant costs to make the brand recognized.. 5. Investment Summary Table 3: Recommendations by price for medium companies. With a price target of $23.75 and an upside potential of 21.3% at the end of 2020 using the Discounted Cash Flow method and with the FCFF approach, our recommendation stands for BUY. The FCFE approach sustain our perspective that WEN is undervalued, with a price target of $ 21.51. The APV approach reinforce our BUY recommendation with a price target of $23.61. With the relative valuation through the multiples approach, we get a different average target price of $22.69, because the company is operating in a market with a medium risk. This reflects a BUY recommendation which supports our recommendation. Both methods indicate that WEN is undervalued. 10. Source: Author and CFA.
(19) For the forecast period, we estimate that the Revenues will increase with a CAGR of 4.61%, which corresponds to the estimate of analysts for the Quick service restaurants industry growth between 2018 and 2022. Although WEN’s Net Income in 2018 significantly increased, this increase was due to the sale of a 12.3% stake in Inspire Brands Inc. Since this extraordinary income in 2018 did not affect the EBIT, we believe that the latter will increase from 2019 until the end of the forecasted period. Risks to the price target: There are some operational risks like the decrease in the selling price or in demand for Wendy’s products, an increase in the raw materials costs and wages costs or an increase in the demand for healthy food instead of fast food. There are also risks related with the Terminal Period for the forecasted price target: the WACC rate and the growth rate. The WACC rate is primarily dependent on the cost of debt, cost of equity, the risk-free rate, the weight of debt, the weight of equity and the corporate tax r ate. So, we will test some of these variables after. Figure 26: WEN CAPEX Source: Author and Company data. 6. Valuation Discounted Free Cash Flow (DCF) method: Free Cash Flow to the Firm, Free Cash Flow to Equity and Adjusted Present Value In order to evaluate the company with these methods, we need to predict the Cash flows generated by the same in the next years, and these cash flows should be discounted with the WACC rate, unlevered Cost of Capital for the Adjusted Present Value method and with the Cost of Equity for the Free Cash Flow to Equity method, all these rates estimated for the firm. To that end, we relied upon certain assumptions, being the most important ones explained below and the additional ones further detailed in appendix 7.. Assumptions Analysis: Revenues: WEN has two sources of revenues: (i) the sales revenues that generated from the company-operated restaurants; and (ii) franchise revenues 11. Figure 27: WEN Debt Source: Author and Company data.
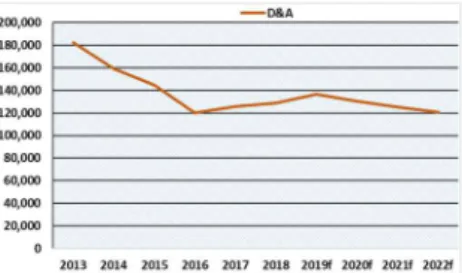
(20) Figure 28: WEN D&A. which came from the monies paid by the the franchisees to WEN. The last. Source: Author and Company data. type of revenues could be subdivided into three different types: Franchise rental income, Advertising funds revenues and Franchise sales revenues. Considering that, directly or indirectly, all revenues are linked to the sales we used the same CAGR for both types of income. The analysts estimate that the CAGR for the period of 2018-2022 will be 4.61%. Despite the signals that the economy would slow down, the truth is that WEN’s CAGR in 2018 and in the first half of 2019 did not slow down, and actually grew faster than the analysts estimated, so it makes. Figure 29: WEN Total ∆ NWC Source: Author and Company data. sense maintain this growth rate estimated by the analysts in the forecasts. Cost of Materials and Services WEN was restructured last year to become more efficient and had to incur in some extraordinary expenses. Consequently, the weight of the costs increased. Considering that the company is not planning to make significant changes in its structure, we assumed that the weight of costs will be the same in the future. In fact, the weight of costs will most likely decrease, but we. Figure 30: WEN FCFF Source: Author and Company data. chose to take more conservative approach. Table 4: WEN Net Working Capital ($ millions) Source: Author and Company data. Debt: The total financial debt will maintain the same debt to value ratio in the forecasted years which is equal to the median of this ratio of the last 5 years. Capital Expenditures (CAPEX): For capital expenditures, we assumed different levels for different years. For 2019 we assumed that the level will be the value estimated by the company, because the information about the types of investments that the company does is not available, so it is quite difficult to predict. For the next years, we assumed that the amount for each year will be the median between 2016 and 2019f. We chose only these years because these were the years where the level of investment stabilized. Depreciation and Amortization (D&A):. 12. Figure 31: WEN EBITDA Source: Author and Company data.
(21) In the last years, the level of D&A was higher than the level of CAPEX because WEN made significant investments in the past, and since 2014 the level of investment has decreased. Since WEN not expect to do large investments in the next few years and considering that the weight of depreciation and amortization in relation to the total fixed assets has been around 10% in the last three years, we believe it makes sense to maintain percentage. Net Working Capital (NWC): We predict that the current liabilities will be higher than the current assets. This difference could be explained by the increase in the accounts payable, especially the increase in the expenses related to the franchises. Due to this increase, the variation of NWC will be negative (Table 3). For the Terminal Period we predict that the NWC will be the median of the last 5 years. Interests: As further detailed below, the Cost of Debt was assumed to be the total interest paid divided by the Total Debt, so for the forecasted years, we used the same cost of debt. Table 5: WEN DCF output. DCF Valuation. Source: Author and Company data. The estimated period considered was four years, from December 31, 2018 to December 31, 2022. After this period, the Terminal Value is then added. With the FCFF method, we obtained a share target price of 23.75$ at the end of 2020, which represents an upside potential of 21.3%. Our calculation shows that WEN is undervalued, and our recommendation is BUY. We estimate that the FCFF of the company will continue to be positive, and the amount will increase until the end of the forecasted period. To compute the FCFF we used the following formula: FCFF = EBIT * (1-Tax rate) – Net increase in NWC - CAPEX + D&A. 13. Table 6: WEN WACC Rate Source: Author and Company data.
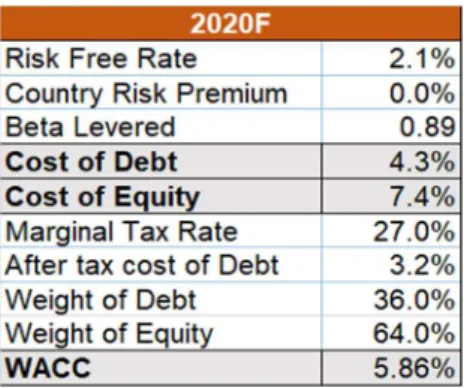
(22) WACC Assumptions The Weighted Average Cost of Capital (WACC) was estimated to discount the futures FCFF. To determine this measure, first, we need to compute the Cost of Equity (ke) and the Cost of Debt (kd), because WACC is especially dependent on the cost of each one and their respective weight in the capital structure. Because the capital structure of the company is quite stable and the riskfree used is similar to the average of the last ten years, we decided to compute only one Cost of Debt rate and one Cost of Equity rate, but the weights of each one in the capital structure changes during the years. To calculate the WACC rate we used the following formula: WACC = ke * [E(E+D)] + kd * [D(E+D)] * (1-T). The WACC rate computed for 2020 was 5.86% (table 6). According to the Aswath Damodaran’s calculations we reach a value of 6.31%, near the value that we estimated for 2020, the difference is related to the weight of debt, which is higher in WEN. The cost of debt is lower than the cost of equity, so a higher weight of debt turns the WACC rate lower.. The Cost of Equity (ke) is the rate of return that stockholders require for a company. We used the Capital Asset Pricing Model (CAPM) to estimate the Cost of Equity for 2020, and we reached a value of 7.4%. Because WEN is located in the USA, the country risk premium (CRP) is equal to zero. We used the following formula to calculate the cost of equity: ke = Rf + β * (MRP + CRP) We used as Risk-free rate (Rf) the US 3 months treasury bill on 30 June of 2019, which was 2.09%. To compute the Beta Levered (β) was used the formula below: βL = βu * [1+ D/E*(1-T)]. We used as unlevered Beta (βu) the Beta of the industry. According to the Aswath Damodaran's calculations on January 5, 2019, the value is equal to 0.63. For the Effective Tax Rate (T) we used the Corporate tax rate by country calculated by KPMG, which was 27%. After all the computations we reached a levered beta of 0.89. 14.
(23) For the Market Risk Premium (MRP), we used the final value of the Aswath Damodaran's calculations at the end of 2018, corresponding to 5.96%. The Cost of Debt (Kd) is the total interest paid in the last year divided by the average of the previous two years of total debt, and we reached a value of 4.3%. For the Tax Rate (T) we used the Corporate tax rate by country calculated by KPMG, which corresponds to 27%. For the Terminal Value (TV), we follow the Perpetuity Growth Model approach. For the computations, we assumed a Perpetuity WACC equal to the 2022 WACC rate of 5.80%, and a Perpetual Growth rate (g) of 1.9%. This growth rate is lower than the growth rate that we used for the explicit period, as it is more realistic for the long term and is in line with the USA inflation rate. The TV after these computations is discounted in the same way that the last forecasted FCFF was discounted. The formula that we used is the following: TV = [FCFF(TV)] / [(WACC – g). Free Cash Flow to Equity method FCFE is the cash available for the stockholders at the end of the year, after the expenses related to Debt’s payment. To evaluate the company with this method, we need to calculate the FCFE for each year, and then, discount these amounts with the Cost of Equity estimated above. To pass for the FCFF to the FCFE we used the following formula: FCFE = FCFF – Interests * (1-T) + Net Borrowing Because firm cannot increase or decrease its leverage forever, for the Terminal Period we assumed that the Net Borrowing is equal to zero. The Interests Expenses in the Terminal Period will be the average of the six years before and the estimated for the forecasted years. With this valuation, we got a share target price of $21.51, which represent an upside potential of 9.9% and sustain our perspective that WEN is undervalued. You can find more information of these computations in the Appendix 14.. 15.
(24) Adjusted Present Value Method. Table 7: WEN Price/Sales relative Valuation Source: Author, Company data and Bloomberg. With this method we get the valuation of the company if this was only financed by equity, and after is added the benefits associated with financing. We discounted the FCFF with the unlevered cost of capital, which is calculated based on the following formula: Ru = ke * [E(E+D)] + kd * [D(E+D)] After discounted we add the deductible benefits that come from the financing, i.e., the PV of interest tax shields, which come from the. Table 8: WEN EV/EBITDA relative Valuation Source: Author, Company Data, Bloomberg. following formula: Interest Tax Shield = Interests * Tax Rate With this method, we got a target price of $ 23.61, and this sustain our recommendation for BUY. You can find more information in Appendix 13.. Multiples Valuation: To get a price target with the multiples valuation we used the Enterprise Value to EBITDA (EV/EBITDA) and the Price to Sales (P/S) ratios.. Table 9: Peer Group Source: Author, Company Data, Bloomberg. With the EV/EBITDA ratio, at the end of 2020, we reached a price target of $ 23.31, representing an upside potential of 19.05% (table 8). With the P/S ratio, at the end of 2020, we reached a price target of $ 22.07, representing an upside potential of 12.72% (table 7). These results sustain our perspective that WEN is currently undervalued. The average of the two multiples price target is $ 22.69, which represents an upside potential of 15,89%. Despite the negative difference of 4,47% when compared with the DCF approach, our recommendation remains on BUY (table 11).. Table 10: Peer Group Median Ratios Source: Author, Company Data, Bloomberg. On Appendix 16, there is a graph with the comparison between the price target from relative valuation and the real price per share, and usually, in the past, the real price was above the price target from the relative valuation.. Multiples Assumptions: Our peer group consists of five companies. Bloomberg's suggested nine companies as the peer group. We compared last year’s multiples of these nine companies with the WEN’s multiples and among them we chose the companies which multiples were similar to WEN’s (table 9). 16. Table 11: Relative and absolute valuation comparison Source: Author, Company data and Bloomberg.
(25) This peer group was selected to compute the median of the forecasted EV/EBITDA and the forecasted P/S for 2020. As we can see in table 10, the forecasted median for P/S is equal to 2.93, and the forecasted median for EV/EBITDA is 16.70.. 7. Financial Analysis. Figure 32: WEN Net Income Source: Author and Company data. Between 2013 and 2015, WEN’s Net Income increased and in 2016 decreased. This decrease can be explained by the sale of some companyoperated restaurants and the consequent decrease in the sales volume, and the net income (without extraordinary income and expenses) fell again in 2018. In figure 32, we can see a considerable Net Income increase in 2018 but this is explained by the sale of stake in Inspire Brands, so it is not based on operating profit. If we analyse the EBIT and the EBIT margin (figure 33), and since. Figure 33: WEN EBIT & EBIT Margin Source: Author and Company data. indicators do not include the extraordinary income and expenses, we can see that these two indicators decreased between 2016 and 2018, and this was the reason why WEN decided to undergo a major restructuring in its core business, so as to turn the company more efficient and more profitable. WEN sold a significant number of its company-operated restaurants and is now more focused on increasing the number of franchisees rather than the number of company-operated restaurants.. Figure 34: WEN Revenues % per type Source: Author and Company data. If we look at figure 34, we can see that the percentage of revenues generated from of company-operated restaurants is decreasing since 2013, and that in 2018 it represented roughly 40%. The Gross profit margin increased until 2016 and decreased from then until 2018, and we estimate that it will remain unchanged for the forecasted. With regard to liquidity, if we look at figure 41, we can see that the current ratio increased in 2015, decreased until 2017, and in 2018 started to grow again. This increase is explained by the rise in cash and cash equivalents, this means that the company is more prepared to meet its short-term obligations. WEN equity ratio is quite unstable, and if we look at figure 36, we can see that this ratio has been decreasing since 2014, except for 2017-2018, which are an exception. The increases of net income, including 17. Figure 35: WEN Net Profit Margin Source: Author and Company data.
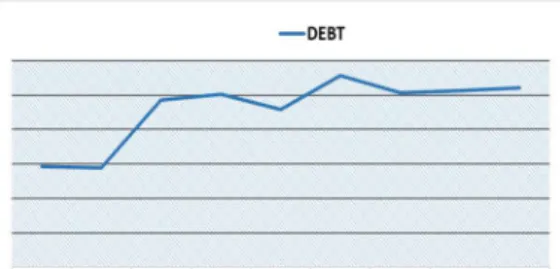
(26) extraordinary income, explain the increases of the equity ratio during. Figure 36: WEN Total Assets & Equity Ratio Source: Author and Company data. those years, so this is not a reliable indicator. In terms of solvency, the same should not be favourable for the company in the future and we do not forecast any improvement in this area. If we look at figure 39, we can see that debt is increasing, so the increase in the leverage of the company is a risk in the long-term. We do not forecast an increase in the number of shares outstanding, and in WEN’s outlook for the next years there is no reference to an increase of this number. If the increase occurs, it will most likely not be significant.. Figure 37: WEN Gross Profit Margin Source: Author and Company data. Considering that we estimate an increase of the net income until 2022 with the same number of shares, the EPS will increase in the future, which is a good indicator for potential investors.. 8. Investment Risks Market Risk & Financial risk | Commodities Quality. Figure 38: WEN EPS Source: Author and Company data. Shortages or interruptions in the supply or delivery of perishable food products can affect the brand reputation. There are potential problems related to the commodities. In the past, there were scandals such as the horse meat scandal, and these types of problems significantly and negatively affect companies’ image and reputation. The likelihood of these two risks being materialised is low, because WEN is very careful with the selection of suppliers and maintains very tight controls over supply and consumption chains.. Figure 39: WEN Debt Source: Author and Company data. Market Risk & Financial risk | Interest Rate Risk An increase in the interest rate can have a significant impact on company’s accounts. WEN has reported solid financial results but has been increasing their leverage. We believe that the company is hedging this risk and the probability is therefore low. However, if the interest rate increases, it can cause significant damage to the company's profitability and solvency. Market Risk & Financial risk | Commodities Costs Raw materials are the main production costs in WEN’s business. If the commodities prices increase, profit margins will be harmed. Franchisees' profit margins are low, so if the prices rise, franchisees' financial health will be affected. 18. Figure 40: WEN ROE Source: Author and Company data.
(27) Market Risk & Financial risk | Wage Expenses. Figure 41: WEN Current Ratio Source: Author and Company data. The QSR industry has a big employee turnover because the wages are very low, and it is difficult to maintain employees. The majority of them receive the national minimum wage and if that minimum wage increases, the company will have an increase in the costs and a decrease in the profit margins. Commodities' costs and wages expenses are the higher production costs. Market Risk & Financial risk | Changes in dietary habits Nowadays the increasing concern with health issues is leading people to adopt a different lifestyle by changing their eating habits. This is particularly. noticed. among. younger. generations. and. could. Figure 42: WEN Total Assets Turnover Source: Author and Company data. potentially harm the WEN business by decreasing WEN sales. Market Risk & Financial risk | Efficiency & IT As mentioned above, the profit margins are low like the salaries paid to the employees. To improve work conditions, restaurants need to create efficient processes to maintain or increase their returns. Nowadays, this efficiency depends on how the company is developed technologically. A failure in the IT systems could harm the business. One example of this development is the online orders. Market Risk & Financial risk | Exchange and inflation rates Even though developing countries are a huge opportunity to expand the business, their economic and political systems tend to be more unstable. One of the major risks when companies expand to these countries, is the exchange rates because the local currencies are weaker and more easily devalued. Another problem is inflation, and we can take the example of countries like Venezuela and Argentina where inflation is affecting WEN’s business. Regulatory & Legal Risk | Changes in regulation Countries have been changing their health policies and introducing some regulations to prevent illnesses related to malnutrition, especially in what concerns children and young people. These changes can represent significant costs. Also, social concerns with the environment have been putting pressure on governments to impose environmentally friendly policies and practices. There is for instance a general concern to ban disposable materials, and this type of regulation may increase company spending. 19. Figure 43: Risk Matrix Source: Author and Company data.
(28) Regulatory & Legal Risk | Taxes The increase of the tax rates will affect the company profits. These taxes can be labour taxes, disposable materials taxes, unhealthy food taxes, and profit taxes. WEN is present in some developed countries but is expanding to some developing countries. In developing countries the profit margins can be higher, as well as the revenues, but the tax system is more unstable, and this could affect the business. Regulatory & Legal Risk | Cybercrime Cybercrime is a significant risk when a company expands the business to the internet. WEN had problems in the past with cybercrime, and this affected not only the brand image but ultimately affected the customers' confidence. If a company cannot assure that the personal and payment data is safe, the customer will avoid ordering online. Regulatory & Legal Risk | Litigation Firms could lose money with litigation associated with employees, suppliers, States, or franchisees. Although the likelihood of some level of litigation is high, we do not anticipate that it will have a considerable impact on the company.. Sensitivity Analysis All the sensitivity analysis was based on the DCF valuation with the price target equal to $23.75/sh. In our valuation, the terminal period represents 88% of WEN’s Enterprise Value. So, first, we tested some possible changes in the terminal period. We started with a sensitivity analysis of the WACC rate for the terminal period and the growth rate (g) for the terminal period. Table 12: Effects of change in terminal growth rate and WACC rate Source: Author and Company data. In the table 12, we can see that if we maintain the growth rate at the same level and if the WACC rate starts to be 7% (1.20% higher) the recommendation instead of being BUY or HOLD will be SELL. If the WACC rate increases 0.20% the recommendation will be HOLD instead 20.
(29) of BUY. So, the price target is susceptible to a change in the WACC rate for the terminal period. The growth rate for the terminal period is very important to the firm's intrinsic value. If the WACC rate remains at the same level and the growth rate decreases 0.4%, the recommendation will be HOLD instead of BUY, and if it decreases 0.9%, the recommendation will be SELL. Another risk to the price target is the risk-free rate (RF) in the long term. In the table below, we can see that if the capital structure remains unchanged in the long term, i.e., the debt weight remains the same and if the RF increases to 2.78% the recommendation will be HOLD, and if the RF increases 1.61% the recommendation will be SELL. Because the cost of debt is lower than the cost of equity, we can see that if all other factors remain the same and the debt weight decreases 20% the recommendation starts to be SELL. Table 13: Effects of change in RF and in the terminal Debt Weight Source: Author and Company data. Even though the explicit period only represents 12% of the company's intrinsic value, we believe that it makes sense to test the sensitivity of the growth rate for this period. We tested the COGS as percentage of revenues, for both, explicit and terminal period. Some analysts estimated a CAGR for the explicit period lower than 4.61%, so we tested the growth rate for lower levels than this estimate (3.03% estimate), and we tested the values accordingly. We can see that if the COGS maintain the same percentage of revenues and if the growth rate changes to 2.86% the company will reach a price target of $21.90, which is lower than our estimate and is a HOLD recommendation. The higher percentage of COGS that WEN achieved in the last six years was 73.96%. We therefore tested the price target up to a COGS percentage of 75.1% and assumed that all other factors remain 21.
(30) unchanged. The price target will be 2.09$/sh which is a SELL recommendation. So, the efficiency of the company is an essential factor for its intrinsic value. You can find more sensitivity analysis in Appendix 16. Table 14: Effects of change in COGS % and in the growth rate for explicit period Source: Author and Company data. Monte Carlo Simulation. Figure 44: Recommendations probabilities Source: Author and CFA. We used the Crystal Ball Software to do the Monte Carlo Simulation, covering a total of 100.000 trials. We tested some variables related to the terminal period (cost of debt, cost of equity, debt weight, growth rate, COGS%, effective tax rate, equity risk premium and the risk-free rate), and for the explicit period we tested the COGS percentage and the growth rate in the explicit period. It is possible to find the sensitivity price distribution in figure 45. The Monte Carlo price’s mean is equal to $23.79 representing an Upside Potential of 21.5%, and that is a BUY recommendation. This mean is higher than our DCF price target of 23.75$.. 22. Figure 45: Sensitivity price distribution Source: Author and Company data.
(31) Appendices Appendix 1: Statement of Financial Position. Source: Author and Company data. 23.
(32) Appendix 2: Income Statement. Source: Author and Company data. 24.
(33) Appendix 3: Cash Flow Statement. Source: Author and Company data. 25.
(34) Appendix 4: Key Financial Ratios. Source: Author and Company data. 26.
(35) Appendix 5: Common-Size Statement of Financial Position. Source: Author and Company data. 27.
(36) Appendix 6: Common-Size Income Statement Wendy's Income Statement In % Sales Franchise revenues Franchise rental income Advertising funds revenue. 2013 87% 13%. 2014 81% 19%. 2015 77% 23%. 2016 64% 26% 10%. 2017 51% 34% 16%. 2018 41% 26% 13% 21%. 2019f 41% 26% 13% 21%. 2020f 41% 26% 13% 21%. 2021f 41% 26% 13% 21%. 2022f 41% 26% 13% 21%. Total Revenues. 100%. 100%. 100%. 100%. 100%. 100%. 100%. 100%. 100%. 100%. Costs and expenses: Cost of sales Franchise support and other costs Franchise rental expense Advertising funds expense. 74% -74%. 68% -68%. 63% -63%. 52% -52%. 58% -42% -1% -7%. 62% -35% -2% -6% -20%. 62% -35% -2% -6% -20%. 62% -35% -2% -6% -20%. 62% -35% -2% -6% -20%. 62% -35% -2% -6% -20%. Gross Profit. 26%. 32%. 37%. 48%. 42%. 38%. 38%. 38%. 38%. 38%. General and administrative. 12%. 13%. 14%. 5%. 17%. 14%. 12%. 11%. 11%. 10%. EBITDA Depreciation and amortization System optimization gains, net Reorganization and realignment costs Impairment of long-lived assets Impairment of goodwill Other operating expense, net Total Costs. 14% -7%. 19% -8%. 24% -8%. 26% -8%. 27% -8%. 27% -7%. 28% -6%. 1%. 1%. 1%. -1%. -94%. -89%. -2% -85%. 43% -8% -9% -5% -1% -1% 1% -78%. 25% -10% -3% 2%. -1%. 23% -8% 4% -1% -1%. -1% -82%. -84%. -83%. -82%. -80%. -79%. 6%. 11%. 15%. 22%. 18%. 16%. 17%. 18%. 20%. 21%. -3%. -5% -7,295 2.8% 0.0%. -8%. -10%. -6%. -6%. -6%. 0.1% 0.1%. 0.2% 0.1%. -8% -0.7% 28.3% 0.3%. -7%. 0.1% 0.0%. 0.2% 0.3%. 0.2% 0.3%. 0.2% 0.3%. 0.2% 0.3%. EBIT Interest expense Loss on early extinguishment of debt Investment income, net Other income (expense), net. -3% -1% 1%. Profit/Loss before income taxes Income taxes. 2% -1%. 10% -4%. 13% -5%. 14% -5%. 8% 8%. 36% -7%. 11% -3%. 13% -3%. 14% -3%. 15% -3%. 2%. 6%. 7%. 9%. 16%. 29%. 9%. 10%. 11%. 12%. 6%. 1% 1% 1% 9%. 9%. 16%. 29%. 9%. 10%. 11%. 12%. Income from continuing operations after taxes Discontinued operations: Income (loss) from discontinued operations Gain on disposal of discontinued operations Net income (loss) from discontinued operations Net income. Source: Author and Company data. 28. -0.01%. 2%.
(37) Appendix 7: Forecasting Assumptions. 29.
(38) Source: Author and Company data. 30.
(39) Appendix 8: WACC Assumptions. Source: Author, Aswath Damodaran and Company data. 31.
(40) Appendix 9: Discounted Cash Flow Assumptions. Source: Author and Company data. 32.
(41) Appendix 10: Multiples Assumptions. Source: Author, Bloomberg and Company data. 33.
(42) Appendix 11: Monte Carlo Simulation. 34.
(43) Source: Author and Company data. 35.
(44) Appendix 12: Dividend Discount Model. Source: Author and Company data. 36.
(45) Appendix 13: Adjusted Present Value Computations. Source: Author and Company data. 37.
(46) Appendix 14: Free Cash Flow to Equity Computations. Source: Author and Company data. 38.
(47) Appendix 15: Porter’s Five Forces. Source: Author. 39.
(48) Appendix 16: Sensitivity Analysis. Source: Author and Company data. 40.
(49) Appendix 17: Relative Valuation vs Price. Source: Reuters. 41.
(50) Appendix 18: CFA Recommendation System. Source: CFA Institute. 42.
(51) References Pinto, J. E.; Henry, E.; Robinson, T. R. and Stowe, J.D. (2010), Equity Asset Valuation. 2nd edition. CFA Institute Investment Series. New Jersey, John Wiley & Sons, Inc. Ohio History Central, Wendy’s. Available on: https://ohiohistorycentral.org/w/Wendy%27s [Consulted on 14/03/2019] Wendy’s Co (2013). The Wendy’s Company Annual Report 2013 [In line]. Available on: https://www.irwendys.com [Consulted on 15/03/2019] Wendy’s Co (2014). The Wendy’s Company Annual Report 2014 [In line]. Available on: https://www.irwendys.com [Consulted on 15/03/2019] Wendy’s Co (2015). The Wendy’s Company Annual Report 2015 [In line]. Available on: https://www.irwendys.com [Consulted on 15/03/2019] Wendy’s Co (2016). The Wendy’s Company Annual Report 2016 [In line]. Available on: https://www.irwendys.com [Consulted on 15/03/2019] Wendy’s Co (2017). The Wendy’s Company Annual Report 2017 [In line]. Available on: https://www.irwendys.com [Consulted on 15/03/2019] Wendy’s Co (2018). The Wendy’s Company Annual Report 2018 [In line]. Available on: https://www.irwendys.com [Consulted on 15/03/2019] Wendy’s Co (2019). The Wendy’s Company Notice of 2019 Annual Meeting of Stockholders & Proxy Statement [In line]. Available on: https://www.irwendys.com [Consulted on 18/04/2019] Market Realist (2019). Must-know: McDonalds’ risks [In line]. Available on: marketrealist.com/2014/07/must-know-mcdonalds-risks/ [Consulted on 30/04/2019] YOURSTORY (2019). Top five trends that will shape the fast-food restaurant industry this year [In line]. Available on: https://yourstory.com/2019/04/trends-shape-the-fast-food-qsr-industry [Consulted on 20/04/2019] Franchise Help (2019). Fast Food Industry Analysis 2019 – Cost & Trends [In line]. Available on: https://www.franchisehelp.com/industry-reports/fast-food-industry-analysis-2018-cost-trends/ [Consulted on 21/04/2019]. 43.
(52) Statista (2019). Fast Food Industry – Statistics & Facts [In line]. Available on: https://www.statista.com/topics/863/fast-food/ [Consulted on 21/04/2019] Damodaran (2019). Data:Current [In line]. Available on: www.pages.stern.nyu.edu/~adamodar/New_Home_Page.htm [Consulted on 23/07/2019].. Sources with restricted access: Radiant Insights (2018). Global Quick Service Restaurant (QSR) IT Market Size, Status and Forecast 2025 [In line]. Available on: https://www.radiantinsights.com/research/global-quick-service-restaurantqsr-it-market-size-status-and-forecast-2025 [Consulted on 25/07/2019] Infiniti Research Limited (2017). Quick Service Restaurants Market in the US 2017-2021 [In line]. Available on: https://www.reportlinker.com/p05256521/Quick-Service-Restaurants-Market-in-the-US.html [Consulted on 21/04/2019]. Technavio (2018). Global Quick Service Restaurants Market 2018-2022. [In line]. Available on: https://www.researchandmarkets.com/reports/4538672/global-quick-service-restaurants-market-20182022#pos-1 [Consulted on 21/04/2019].. 44.
(53) Abbreviations CapEx. Capital Expenditure. CFF. Cash Flow from Financing Activities. CFI. Cash Flow from Investing. CFO. Cash Flow from Operations. D&A. Depreciations & Amortizations. WACC. Weighted Average Cost of Capital. Ru. Unlevered Cost of Capital. DCF. Discount Cash Flow. g. Growth rate for the terminal period. CRP. Country Risk Premium. WEN. Wendy’s Co. RF. Risk Free Rate. Ke. Cost of Equity. MRP. Market Risk Premium. Kd. Cost of Debt. FCFF. Free Cash Flow to the Firm. FCFE. Free Cash Flow to Equity. APV. Adjusted Present Value. EBITDA. Earnings Before Interests, Taxes, Depreciation and Amortization. EBIT. Earnings Before Interests and Taxes. T. Tax Rate. 45.
(54) 46.
(55)
Imagem
+7

Documentos relacionados
A preocupação constante na melhoria da educação permite um reajustamento contínuo da prática educativa. Este cuidado gerou a aplicação de várias metodologias, entre elas
Quando se fala em distalizadores intrabucais, logo se remete aos movimentos indesejáveis, como já citados anteriormente, a perda de ancoragem, a rotação e extrusão dos
No que diz respeito aos modos de entrada para a internacionalização das empresas, conclui-se que a Hoti Hotéis se internacionaliza unicamente através
As entidades administrativas em causa não têm entre si qualquer relação hierárquica, embora a própria Constituição não estabeleça uma igual dignidade
Depois, na FAO, onde estou trabalhando há sete anos, percebi que havia todo um mundo “lá fora”, para além da América Latina, em que as mulheres rurais também enfrentavam lutas
No caso da versão “duas fases em duas ordens” espera-se uma interacção entre o factor relativo a instruções de controlo mental e a sua ordem, traduzindo especificamente uma
A dependência é total relativamente aos sacerdotes da mesma Ordem quanto à celebração de missas (em Cástris estas são obrigatoriamente duas por dia), com especial destaque para
Avaliou-se sob condições de solo hidromórfico na Estação Experi- mental Terras BakaS/EMBRAPA CLIMA Tiimmanoo, Capão do Leão, RS, Brasil, a produção de forragem, teor de proteína
