PERFORMANCE VARIATION OF VERTICAL OPEN REFRIGERATED
DISPLAY CASES IN-SITU OPERATION AND TESTING ACCORDING TO
ISO AND ASHRAE STANDARDS
S. M. NASCIMENTO
(a), G. G. HEIDINGER
(b), P. D. GASPAR
(c), P. D. SILVA
(d)(a)(b) Eletrofrio Refrigeração Ltda, r João Chede, 1599, Cidade Industrial,
Curitiba - PR, 81170-220, Brazil
+55 (41) 2105-6097, (a) [email protected]; (b) [email protected] (c) (d) University of Beira Interior, Engineering Faculty, Dept. of Electromechanical Engineering,
Covilhã, 6201-001, Portugal
+351 275 329 759, (c) [email protected]; (d) [email protected]
ABSTRACT
Refrigerated display cases are an equipment widely used in sales environments, such as stores and super markets. Most equipment are open type since they provide a good marketing appeal. This type of equipment is used to expose perishable foods or chilled drinks. Manufacturers seek during the design phase of the equipment to certify its suitability to the testing standards with the lowest energy consumption and ensuring food safety. With the aim to assist the development of new equipment that meet the test conditions established by testing standards and market needs, experimental tests were conducted comparing real operation conditions and test conditions following the testing standards ISO 23953/2005 and ASHRAE 72-2005. The experimental results show that test conditions required by standards are stricter than in-situ operation, providing higher conservation temperatures (56% increase) and energy consumption (17% increase).
The experimental study considers an open vertical refrigerated display case that demands high electrical energy consumption due to its characteristics. The tests performed in the laboratory using a climatic chamber determine approximately 17% higher thermal load values than those of in-situ operation with remote refrigeration system. This condition arises from the different airflow conditions that are found inside stores when comparing with the conditions and patterns imposed by standards for equipment testing. This difference has a negative impact in the commercial scope since equipment manufacturers relate lower thermal load values than those determined in tests of similar models according to standards.
1. INTRODUCTION
Since ancient times, man found cooling method to ensure a temperature of foods products below the environmental temperature in order to preserve them for longer periods of time. The perishable food products, from production to the final consumer, are preserved and channelled through the cold chain. According to Rigot (1991), the cold chain can be described by five main links: Cold in the production stage; Cold during storage; Refrigerated transportation; Cold in the distribution stage; and Home cooling. The fourth link in the cold chain, which is the subject of this paper, is commonly referred as commercial refrigeration since it is placed at the trade level. ASHRAE (2010) indicates that the percentage of the energy consumed in a typical supermarket due to the refrigeration systems reaches 50%. This energy is consumed by compressors, refrigerated display cases, walk-ins and condensers. The vertical and open refrigerated display cases (VORDC) are type that consumes more energy. According to Faramarzi (1999), ASHRAE (2010) and Gaspar et al. (2011), the thermal load due to ambient air infiltration in a VORDC corresponds respectively to 67% - 77%, 73.5% and 78% - 81% of the total thermal load. This condition results from the low efficacy of the air curtain in separating (thermal and mass) two contiguous spaces with different thermal environments, whose access must be kept open for operational and/or commercial reasons. The application of air curtains results from the need of a non-physical sealing between the food products stored in cold and the consumer, so that he can see and handle without constrains the food product to purchase, and thus increasing the sales potential.
The effectiveness of this aerothermodynamics sealing is highly dependent on ambient air conditions, i.e. its temperature (Tamb), relative humidity (øamb) and velocity - module (vamb) and direction (amb). The thermal
entrainment is associated with the variation of these parameters, which impact on the overall performance of the equipment is significant and differentiated as shown by Gaspar et al. (2010a, 2010b). Considering that the
global demand for commercial refrigeration equipment is forecast to rise 4.4% per year through 2016 to $32.0 billion (Freedonia, 2013), the combined analysis of these data confirms the need to evaluate the influence of ambient air conditions on the stability of the air curtain of VORDC in order to develop methodologies and procedures that promote the reduction of energy consumption, improve the thermal performance and consequently ensure the food safety. This experimental and numerical work aims to evaluate the parameters of ambient air velocity on the stability of air curtains of VORDC with double air curtain, when tests are performed in the laboratory following the indications of the ISO 23953 (2005) or ASHRAE Standard 72 (2005) standards.
2. STATE OF THE ART
The work developed by various researchers has focused, for this type of equipment, in qualifying and quantifying the perceptible thermo-physical properties of the jet that provides a cold air curtain. Hayes & Stoecker (1969) developed a correlation that describes the ability of the air curtain to provide a proper separation between environments. The correlation is given by a dimensionless parameter named as deflection modulus, Dm, which is the ratio between the air curtain momentum and the modulus of the transverse forces
caused by temperature difference between the contiguous environments. Faramarzi (1999) determined the relative weight of the cooling load components for VORDC, composed by thermal loads from infiltration, radiation, conduction, product pull-down cooling, devices (lights and fans), defrost and anti-sweat heaters, and product respiration. According to EN-ISO 23953 (2005), the total cooling load can be determined by eq. (1).
𝑄̇𝑡𝑜𝑡= 𝑚̇𝑟𝑒𝑓∙ ∆𝑖 (1)
Chen et al. (2005, 2009, 2011) developed studies using Computational Fluid Dynamics (CFD) codes to evaluate the thermo-physical parameters of the air curtain in VORDC. The performance of the air curtain was evaluated by the following dimensionless numbers/parameters: Reynolds number, Grashof number, Richardson number and dimensionless temperature. The results provided the following conclusions: There is a range of values of Reynolds number, dependent of the height/width ratio of the air jet, that provide an optimal thermal insulation of the cold air curtain jet; The Grashof number provides the fluctuation proportion of the buoyancy force that acts on a viscous fluid in situations involving heat transfer by natural convection while the Richardson number is related to the influence of natural convection in relation to forced convection It can be stated that air curtains with small height/width ratio provide a good thermal performance. Navaz et al. (2005) developed studies using Digital Particle Image Velocimetry (DPIV) focusing mainly in studying the effectiveness of the air curtain and maintaining the temperature of food products to a predetermined value. The results evaluation indicates that the Reynolds number has direct effect on the ambient air entrainment due to its role in the turbulence development. According to Navaz et al. (2005), the best range of values for Reynolds number in the discharge air grille (DAG) is about 3200-3400. In that study, the authors defined the Thermal Entrainment Factor, TEF, to quantify the thermal entrainment of the air curtain with the ambient air, varying 0 < TEF < 1. The analysis of the correlation shows that a TEF close to 0 provides a low thermal entrainment with the ambient air. The correlation described by Navaz et al. (2005) does not take into account the air flow through the perforated back panel (PBP). Yu et al. (2009) developed the TEF equation considering this air flow. The results obtained by Yu et al. (2009) show a good approximation for TEF and temperature value at the return air grille (RAG) with deviations of 0.9% and 0.1 °C respectively. These deviations indicate that the correlation has a good approximation at the engineering level and can be applied in the design of VORDC. Gaspar et al. (2009, 2010a, 2011) evaluated the stability of the air curtain for climatic classes n.er 1, n.er 2 and
n.er 3 according to EN-ISO 23953 (2005) and other classes beyond the standard. The evaluation was made by
experimental testing and numerically using CFD models. The results showed that the VORDC performance strongly depends on the ambient air conditions such as temperature, humidity, velocity and direction of ambient air flow in relation to the VORDC's frontal opening. These authors showed that (1) the cooling load increases with the air temperature and relative humidity of the external environment, (2) the increase of the ambient air velocity increases more significantly the power consumption of the VORDC than the airflow direction change from parallel to perpendicular in relation the frontal opening of the VORDC, (3) the
parallel to perpendicular, being the worst case for θamb = 45°. In the case study, TEF = 0.25, 0.32, 0.3 for θamb
= 0°, 45°, 90° respectively. However, the majority of studies abovementioned were based in VORDC with a single jet in DAG. This paper presents the initial calibration for experimental studies in a VORDC with double jet in DAG. This kind of equipment is used when is needed a "stiffer" aerothermodynamics sealing to separate the contiguous spaces.
3. EXPERIMENTAL STUDY
3.1. Experimental apparatus
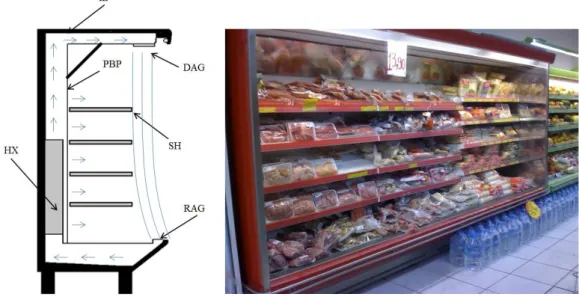
The VORDC provided by Eletrofrio Refrigeration LTDA - Brazil has 2.5x1.1x2.1 m3. It comprises (1) an
insulating body (IB) surrounding all the equipment; (2) tube and fins heat exchanger (HX); (3) discharge air grille (DAG); (4) return air grille (RAG); (5) perforated back panel (PBP) and shelves (SH) as shown in Figure 1. The temperature of the refrigerated compartment is provided by the cold air mass flow that exits DAG and PBP and returns to RAG to be cooled again in the HX. The air flow exiting DAG forms an air curtain which protects the inner refrigerated compartment. Note that this equipment has a primary air curtain (PAC) and a secondary air curtain (SAC) in order to promote a more effective aerothermodynamics sealing. The air for SAC is collected from the bottom front of the VORDC.
The device has four fans with 53 W each to supply a flow rate of 0.4 m3.s-1 to DAG and PBP. The air, before
reaching the DAG, passes through an evaporator with dimensions 2.20x0.13x0.35 m3 constituted by 222 fins
and three rows of tubes in the air flow direction and 8 rows of tubes perpendicular to it. The DAG has a total width, b, of 140 mm, which is equally distributed to form the PAC (bPAC = 70 mm) and SAC (bSAC = 70 mm).
This equipment is used to display products with temperature class M1 (-1 °C to +5 °C). It was installed a remote mechanical system with a compressor Octagon 2DC-3.2 and water condenser. The measuring instruments were selected in order to obtain reliable measurements of the relevant physical properties variation collected every minute during the experimental test.
Figure 1. Vertical open refrigerated display cabinet.
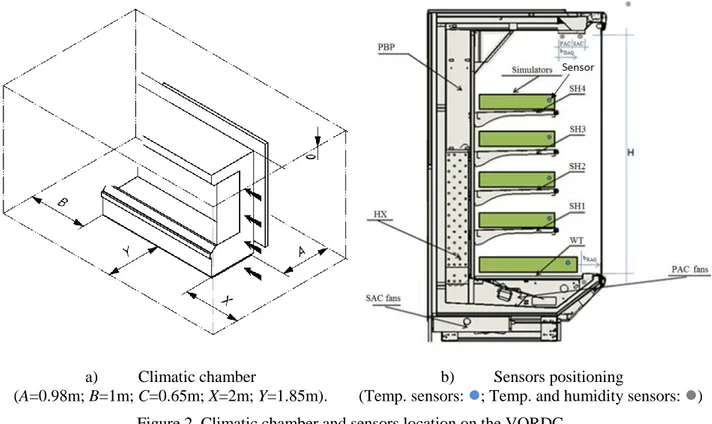
The experimental essays (EE) followed EN ISO 23953 (2005) and were performed in a climatic chamber designed in accordance to the standard as shown in Figure 2a. Figure 2b shows the middle section of the VORDC. Air temperature and humidity sensors Super MT 530 were placed in DAG, RAG and ambient. Temperature sensors type PT1000 were placed in the test M-packages (product simulators). A Coriolis flow meter MASSFLO 2100 DI 6 was installed at the liquid refrigerant line. Table 1 shows the experimental techniques and probes/experimental measuring devices used to collect the relevant physical properties.
a) Climatic chamber
(A=0.98m; B=1m; C=0.65m; X=2m; Y=1.85m).
b) Sensors positioning
(Temp. sensors: ; Temp. and humidity sensors: ) Figure 2. Climatic chamber and sensors location on the VORDC.
Table 1. Experimental techniques and probes/experimental measuring devices.
Experimental technique Model Measuring range Accuracy
Thermometry PT 1000 -40°C to +80°C ± 0.3 °C
MT 530 Super -10°C to 70°C ± 1.5 °C
Hygrometry MT 530 Super 20% to 85% ± 5%
Anemometry HD2903TC3.2 0.05 m.s-1 to 1 m.s-1 ± 2%
Flowmetry MASSFLO 2100 0 to 1000 kg.h-1 ± 0.1%
Barometry AKS 32 0 to 200 psig ± 0.3%
3.2. Experimental testing procedure
The calibration of the climate chamber was performed by two different procedures, EE1 and EE2. EE1 followed the EN ISO 23953 (2005) that suggests an experimental evaluation of the chamber performance to comply with air velocity from 0.1 m.s-1 to 0.2 m.s-1. For tests conducted in VORDC, the standard suggests an
air velocity of 0.2 m.s-1 parallel to the frontal opening of the equipment, with the VORDC switched off. In EE2
was followed the method used by some equipment manufacturers. It consists in following the ISO suggestions, but the calibration of the air velocity to 0.2 m.s-1 parallel to the frontal opening of the equipment is performed
with the VORDC switched on. Data was collected over 24 hours. Each EE was carried out three times to minimize uncertainty.
4. NUMERICAL STUDY
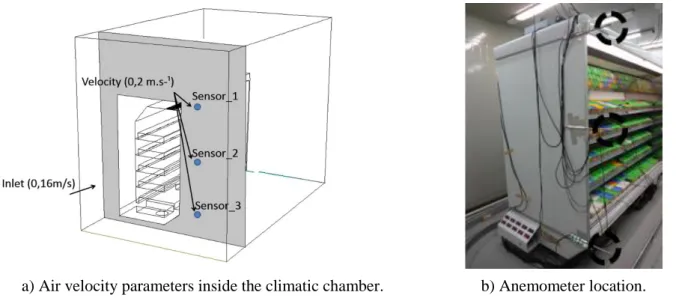
A numerical study based on Computational Fluid Dynamics was developed to assist the calibration procedure of the air velocity in front of the VORDC. The numerical results were used to fit the air flow settings in order to ensure the same air velocity value in the three points shown in Figure 3a.
The numerical study was developed for a simplified 3D geometry of the VORDC. The geometry was developed in CAD software - SolidWorks and transferred to Gambit software to generate the computational mesh. The Fluent CFD code was used to simulate the air flow in the climate chamber for two different settings
and the external surroundings required a computational grid with 1.941.924 cells and 373.132 nodes. The models require such high number of control volumes due to the geometrical distances variations near the end walls of the equipment. This mesh refinement allowed the development of a high quality grid without high skewness levels and aspect ratios.
Nascimento et al. (2013) obtained the experimental data of air velocity and relative humidity for the same VORDC, which were considered as boundary conditions (BC) in the numerical models. The air velocity at the climatic chamber inlet was calculated to allow an air velocity of 0.2 m.s-1 parallel to the frontal opening of the
VORDC. Due to free area reduction at the lateral flow head of the VORDC and consequent air velocity increase, the air velocity at the inlet face of the climate chamber was imposed to vamb = 0.16 m.s-1. In EE1,
DAG and RAG areas were considered as walls (VORDC switched off). In EE2 (VORDC switched on), the PAC mass flow rate was imposed non-uniformly along length between 0.021 kg.s-1 to 0.031 kg.s-1. The mass
flow rate at SAC was imposed at a constant value of 0.027 kg.s-1. The air temperature at PAC and SAC were
imposed at TPAC = 0ºC and TSAC=18 ºC respectively. The RAG area was fixed to a pressure outlet BC. Figure
3a shows the plane where the air velocity reaches 0.2 m.s-1. The temperature and relative humidity of air at the
inlet face of the climatic chamber were fixed to Tamb = 25 °C and amb = 60% as defined in EN ISO 23953
(2005) for climate class n.er 3.
a) Air velocity parameters inside the climatic chamber. b) Anemometer location. Figure 3. CFD model and location of velocity measurements to set boundary condition values.
The numerical predictions of temperature pathlines for EE1 (VORDC switched off) are shown in Figure 4a. The predictions show that the air flow inside the room tends to concentrate in its lower part due to the difference of air density in result of the heat generated by the fluorescent lamps mounted in the ceiling of the climatic chamber. This result indicates that the climatic chamber was empty when the air flow was calibrated and the air flow may not have the same direction when the VORDC is switched on. Figure 4b shows the temperature pathlines for EE2 (ORDC switched on). In this case study, the air flows to the upper part of the climatic chamber. Again, this condition is due to differences in air density throughout the chamber. The heat exchange between the air curtain and external air (RAG to DAG height), is predicted to increase the air temperature near to the floor close to 18 °C.
The numerical simulation was necessary for a better understanding of the air flow inside the climatic chamber and to predict the changes of air velocity value parallel to the air curtain. The numerical simulations help to set the climatic chamber air flow that fits the 0.2 m.s-1 in front of the VORDC opening, due to the difficulty to
obtain experimentally a uniform flow along the plane perpendicular to the air curtain. The air velocity value that meets EN ISO 23953 (2005) was only accomplished with auxiliary ventilation: five centrifugal fans positioned on a vertical line at 1.5 m from the head of VORDC) shown in Figure 5.
a) ORCD switched off. b) ORCD switched on. Figure 4. Pathlines of air temperature [K] for the numerical case studies.
Figure 5. Location of centrifugal fans used to provide auxiliary ventilation.
5. RESULTS ANALYSIS AND DISCUSSION
This section includes the analysis of the experimental results of tests performed considering the different initial procedures to set the external air velocity: EE1 (VORDC switched off) and EE2 (VORDC switched on). Figure 6 shows the air velocities values during the initial procedure of setting the external air velocity in locations given by the sensors 1 to 3 (see Figure 4) for EE1. The values of the average air velocity over 7 hours are 0.18 m.s-1; 0.21 m.s-1 and 0.19 m.s-1 in positions 1 to 3 respectively. Figure 7 shows the air velocity
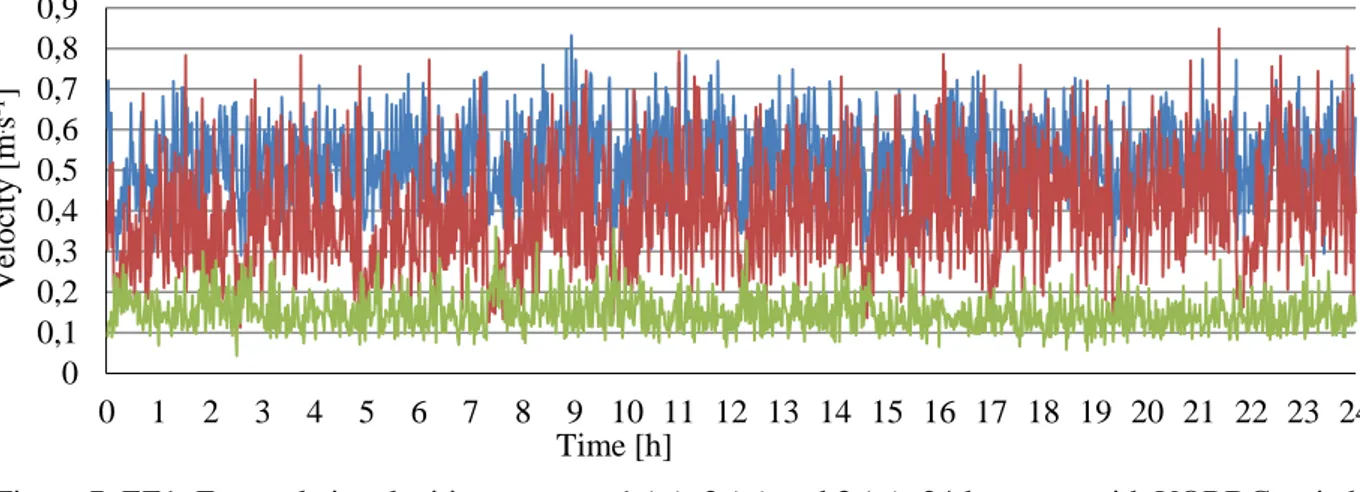
distribution for EE1 during the 24-hour tests to the VORDC. It is shown as increase in air velocity sensors 1 and 2 to 0.52 m.s-1 and 0.39 m.s-1, respectively. In sensor 3 is measured a decrease of 0.15 m.s-1. This condition
was also predicted by the numerical simulations. In EE2, the external air velocity was adjusted to meet a mean value of 0.2 m/s of the horizontal air velocity in sensor 1, 2 and 3. After accomplishing this condition, a 24-hour test to the ORDC was also performed. In this case study, the external air velocity in the measuring points was around 0.2 m.s-1 during the 24-hour test.
0 0,1 0,2 0,3 0,4 0,5 A ir v el oci ty [m .s -1]
Figure 7. EE1: External air velocities at sensor 1 (−), 2 (−) and 3 (−): 24-hour test with VORDC switched on.
Table 2 shows the thermal cooling load values and M-packages temperature at different heights (shelves) for the two case studies. The temperature of M-packages (product simulators) in EE1 stabilized in higher values than in EE2 (plus 56%). In EE2 is determined a reduction of the thermal cooling load of approximately 17% in relation to EE1.
Table 2. Thermal cooling load and M-packages temperature at different heights (shelves) for the case studies.
Case
study Heat load [kcal.h-1]
M-packages temperature [°C] Shelf 4 (SH4) Shelf 3 (SH3) Shelf 2 (SH2) Shelf 1 (SH1) Well tray (WT) EE1 5512 9,8 8,7 8,6 9,2 10,7 EE2 4575 4,1 3,3 2,9 3,1 3,6
The thermal cooling load and storage temperatures of products obtained in EE2 are the values reported by the manufacturer, although the test does not follow completely the standard as the calibration of air velocity in the climatic chamber is performed with the VORDC switched on. The thermal cooling load of 4575 kcal/h matches with the value published by the manufacturer and it is used by him in all installations, since the ventilation conditions inside the stores are less demanding than defined in EN ISO 23953 (2005).
Another comparison that is worth to be mentioned is the ambient air velocity defined in ASHRAE standard 72-2005. This standard suggests an air velocity parallel to the frontal opening of the VORDC between 0.15 m.s-1 and 0.25 m.s-1. As this standard allows testing the VORDC with lower air velocity, the performance
results for the same ORDC will be better. Future work will be developed with the aim of comparing the performance of the VORDC when subjected to the test conditions of ASHRAE and ISO. The results should contribute to the development of new equipment with reduced energy consumption, heat exchangers size and production cost.
5. CONCLUSIONS
The numerical results show the air flow pattern inside the climate chamber. This prediction allows to adjust the airflow to perform the case studies EE1 and EE2. The case studies provided different results of thermal cooling load and M-packages temperature. These values were compared with the data reported by the manufacturer. The data analysis allows to conclude that the environmental conditions of the climatic chamber imposed in EE2 (VORDC switched on) are less demanding to the operation of the VORDC. Performing tests with this condition allows marketing a VORDC with lower energy consumption without showing operation problems. Another possibility is to perform tests according to ASHRAE standard 72-2005, as the procedure to adjust the air velocity in the climatic chamber can be carried out with the VORDC switched on and using a lower air velocity (0.15 m.s-1). It is possible to obtain better performance results for the same VORDC
performing the tests with this standard. 0 0,1 0,2 0,3 0,4 0,5 0,6 0,7 0,8 0,9 0 1 2 3 4 5 6 7 8 9 10 11 12 13 14 15 16 17 18 19 20 21 22 23 24 V el oci ty [m .s -1] Time [h]
NOMENCLATURE
b air curtain width (m) Subscripts
H Air curtain height (m) amb ambient
i Enthalpy (J.kg-1) BC Boundary condition
𝑚̇ Mass flow rate (kg.h-1) DAG Discharge air grille
𝑄̇ Thermal power (W) EE Experimental essay
T Temperature (K) HX Heat exchanger
v Velocity (m.s-1) IB Insulating body
PAC Primary air curtain Abbreviation
CFD Computational fluid Dynamics RAG Return air grille
DAG Discharge Air Grille SAC Secondary sir curtain
RAG Return Air Grille SH Shelve
PBP Perforated Back Panel sim simulator
TEF Thermal Entrainment Factor PAC Primary Air Curtain
SAC Secondary Air Curtain Greek symbols
𝜃 Airflow direction ( º )
Relative humidity (%)
REFERENCES
1. ASHRAE. 2010, “ASHRAE Handbook: Refrigeration”, ASHRAE, Inc.
2. Chen, Y., Yuan, X.-L. 2005, Simulation of a cavity insulated by a vertical single band cold air curtain, Energy
Conversion and Management 46(11-12), 1745-1756.
3. Chen, Y. 2009, Parametric evaluation of refrigerated air curtains for thermal insulation, International Journal of
Thermal Sciences 48(10), 1988-1996.
4. Chen, Y., Xia, D.H. 2011, The flow characteristics analyses of refrigerated air curtains in multi-deck display cabinets, International Congress of Refrigeration), 23rd ed., Prague, Czech Republic.
5. Faramarzi, R. 1999, Efficient display case refrigeration, ASHRAE Journal 41(11), 46–52.
6. Foster, A.M., Madge, M., Evans, J.A. (2005), The use of CFD to improve the performance of a chilled multi-deck retail display cabinet, International Journal of Refrigeration, 28(5), 698–705.
7. Gaspar, P.D., Gonçalves, L.C.C., Vogeli, A. 2009, Dependency of air curtain performance on discharge air velocity (grille and back panel) in open refrigerated display cabinets, ASME International Mechanical
Engineering Congress and Exposition, Lake Buena Vista, Florida, U.S.A.
8. Gaspar, P.D., Gonçalves, L.C.C., Ge, X. 2010, CFD parametric study of ambient air velocity magnitude influence in thermal behaviour of open refrigerated display cabinets, 5th European Conference on
Computational Fluid Dynamics (ECCOMAS CFD 2010), Lisbon, Portugal.
9. Gaspar, P.D., Gonçalves, L.C.C., Ge, X. 2010, Influence of ambient air velocity orientation in thermal behaviour of open refrigerated display cabinets, ASME ESDA 2010, Istanbul, Turkey, July.
10. Gaspar, P.D., Gonçalves, L.C.C., Pitarma, R.A. 2011, Experimental analysis of the thermal entrainment factor of air curtains in vertical open display cabinets for different ambient air conditions, Applied Thermal Engineering 31(5), 961–969.
11. Gaspar, P.D., Gonçalves, L.C.C., Pitarma, R.A. 2011, Análise Experimental da estabilidade de cortinas de ar de equipamentos de refrigeração para diferentes condições do ar ambiente, International Conference on
Engineering UBI2011 -28-30 Nov 2011 - Universidade of Beira Interior - Covilhã, Portugal.
12. Hayes, F.C., Stoecker, W.F. 1969, Design data for air curtains, ASHRAE Transactions 75(2), 68-180.
13. Nascimento, S.M., Heidinger, G. G., Gaspar, P.D. 2013, Experimental quantitative evaluation of thermal performance in refrigerated display cabinets with variation of air curtain thickness and porosity of the back panel,
3rd IIR Int. Conference on Sustainability and the Cold Chain, PARIS / April 2-4, 2013.
14. Navaz, H.K., Henderson, B.S., Faramarzi, R., Pourmovahed, A., Taugwalder F. 2005, Jet entrainment rate in air curtain of open refrigerated display cases, International Journal of Refrigeration 28(2), 267–275.
![Figure 4. Pathlines of air temperature [K] for the numerical case studies.](https://thumb-eu.123doks.com/thumbv2/123dok_br/18877264.932041/6.892.99.807.88.352/figure-pathlines-air-temperature-k-numerical-case-studies.webp)