Testing multidimensional keys of development: governance, entrepreneurship and social cohesion
Maria Helena de Almeida Sílvia Pinto de Brito Fernandes
Research Centre for Spatial and Organizational Dynamics (CIEO) University of Algarve - Faculty of Economics
Campus de Gambelas 8005-139 Faro Algarve - Portugal Email: [email protected] Office: +351 289 800915 - Ext: 7189 Abstract
This paper intends to contribute to an on-going change of perspective in territorial policies, more focused on a place-based integrative development strategy, which can be enhanced by social capital. This includes organizational and institutional learning for knowledge and skills’ transfer and governance coordination of the layers involved. Several concepts and indicators can be combined to support a conceptual framework for governance redefinition and sustainable growth. A comparison with related quantitative and qualitative indicators across countries highlights an approach for building a common culture that could facilitate governance and growth sustainability. It is less the size or the level of economic development that explains the different performances across countries/regions, than their levels of capital endowment (social, institutional, cultural) and the ability to properly exploit it. The most intangible aspects (entrepreneurship, participation, cohesiveness) are key elements in making the difference through the creation, valuation and maintenance of distinctive places and communities.
Key-words: governance, social capital, institutional learning, sustainable growth, indicators, cluster analysis, discriminant analysis
Introduction
The great paradox of our generation is that the increasing scale and scope of our global economic affairs is simultaneously reawakening our sensitivities towards local issues and identities. An important feature of this paradox is that its resolution depends on overcoming two corresponding trends militating against it, namely increasing inequality and increasing volatility (Pritchett, 1997). For example, the technology that turns life more stimulating and prosperous for some is turning it more precarious and uncertain for many others (Ritzen and Woolcock, 2000). Thus, before questioning the platforms of information and communication technologies, supportive of collective learning, it is important to consider that there are not only important differences among nations, but territorial disparities within countries are particularly significant (Pezzini, 2003).
The accountability of the new risks and rewards of globalisation shall entail building more responsive institutions that can anticipate problems and encourage leadership through all levels of society to build bridges across the widening social and economic divisions. One effective tool is multi-level governance through its functional integration, which according to Cattan (2002), highlights the limiting nature of traditional administrative boundaries for socio-economic analysis. Functional areas are based on labour mobility and local employment markets and most countries use them as a framework for socio-economic territorial analysis, structural studies of local labour markets and assessment of regional disparities. In the larger administrative areas, structural problems requiring regional initiatives are not easily identifiable as they are concealed by average situations (Cattan, 2002). Often these are also inappropriate to register crucial phenomena such as clusters and innovation systems. The territorial analyses based on functional areas make possible a more detailed diagnosis and help identify areas in need of assistance.
The increasing complexity of organizations,together with the growing scale of informationactivities, puts new challenges on governance and growth. It isbelieved that investing in social valuesbased on mutuality, trust and respect could yield long-term benefits such as corporate well-being and innovativeness. The benefits are believed to be based onbetter knowledge sharing, lower transaction costs due to a communicative spirit, and a greater coherence of action (Widén-Wulff and Ginman, 2004). Good governance and the policy framework cannot be “bought”, but they can be supported by capacity building and by the transfer of knowledge and resources. However, there is a need for deeper considerations and a more focused research agenda into the cohesiveness of communities and the quality of public institutions and their relationship with sustained and equitable economic growth. We
need to know more about how to foster a greater sense of cooperation and inclusion in environments where there is division and distrust. Cooperative and healthy educated people are not only more productive workers, but they are also better parents, neighbours and citizens. It requires, among other aspects, credible local leaders who are able to articulate the interests and aspirations of the people to identify a set of objectives around which those can coalesce. This implies a genuine sense of membership and responsibility from all stakeholders and a commitment to work together.
It is interesting that the benefits of good leadership and cohesiveness are not new, as anciently the holly scriptures already said “…in the multitude of people there is an adornment of a king, but in the lack of population is the ruin of a high official”, and also “…one isolating himself will seek his own selfish longing, against all practical wisdom he will break forth”. Most bad things in societies come from inner hostile conditions such as poverty, war, inequality, lack of cooperation and corruption. Thus, the director of an international agency of humanitarian assistance, describing the hope and aspirations of poor people, said: “the poor want, above all, peace and safety and so they wish either national or international policies to be more trusty and fair, for not having their efforts crushed by the dominant power of enterprises and rich countries”1
.
The conceptualisation of the role of social relationships in development represents an important departure from earlier theoretical approaches and, therefore, it has important implications for contemporary development research and policy. It is beginning to generate a remarkable consensus regarding the role and importance of institutions and communities in terms of development. The communities can be characterised by their endowments of both intra-community ties and extra-community networks, whose different combinations account for the range of outcomes associated with social capital. The inclusion of this concept in the fields of organizational behaviourand institutional learning is recent and needs a more solid theoretical framework. Granovetter (1995) argues that economic development takes place through a mechanism that allows individuals to draw initially on the benefits of close community membership but that also enables them to acquire the skills and resources to participate in networks that transcend their community, thereby progressively joining the economic mainstream. According to Barr (1998) either poor entrepreneurs, operating small local firms in traditional sectors whose networks contribute to reduce risk and uncertainty, or larger regional firms that share knowledge about technology and global markets, can both help and hinder economic
1
From an article in the Watchtower review, “Will Anyone be Able to Change the World?”, published by the Jehovah’s Witnesses Association, 1st November 2005.
progress. The challenge to social capital theory, research and policy is thus to identify the conditions under which the many positive aspects can be harnessed, like spreading access to formal institutions.
The object of this paper is to contribute for a better understanding of how social, regulative and economic aspects are anchored to each other and to explore the mechanisms behind this interaction. Possible measures and contexts for this kind of research are then suggested through an empirical analysis. The aim is tracing whether there can be said to prevail underlying dimensions when dealing with a number of proxies for social capital and its association to governance and growth. A standardized methodology will open a door to a whole range of new research approaches to fill the gap that exists in the literature as no general method of measurement has been established.
Research Hypotheses
Hypothesis 1: Do these arguments help to order our thoughts about sustainable growth achievement?
Concerning the empirical treatment of the concept of social capital, some authors2 separate it into three alternative approaches: situational or instrumental, social-psychological and cultural. Grootaert (1998) lists a number of indicators and summarizes them in two strands: horizontal and vertical social capital. Whiteley (2000) claims that the concept covers two main dimensions: the behavioural, that influences cooperation between formal institutions and stakeholders, and the attitudinal which is related with norms and trust for combating corruption. Independently of the dimensions explored, these studies invoke that development is better achieved under good governance and with a good social environment. Social cohesion and social capital are intimately related and require good complementary institutions to manage new forms of conflict, opportunity, rights, transactions and information, all of which in turn are important determinants of a society’s prosperity (Ritzen and Woolcock, 2000). When social capital refers to the norms and networks that enable people to act collectively, it focuses on its sources while recognising that important features such as trust and reciprocity are developed in an iterative process (Woolcock and Narayan, 2000). The communities endowed with a diverse stock of social networks and civic associations are in a stronger position to confront poverty and vulnerability (Narayan, 1995). However, the sources of social capital need to be distinguished from the consequences derived from them. Imputing only desirable outcomes to social capital, or equating them
with it, ignores the possibility that these outcomes may be sub-optimal or that desirable outcomes attained today come at significant costs tomorrow. These features of social capital are well documented by the empirical evidence and have important implications for growth and poverty issues.
The way communities themselves are structured turns in large part on their relationship with the state. Weak, hostile, or indifferent governments have a profoundly different effect on community life and development projects than do governments that respect civil liberties, uphold the rule of law, honour contracts, and resist corruption (Isham and Kaufmann, 1999). Svendsen (2003) argues that power centralisation distorts economic freedom lowering the general trust towards institutions. Other approaches, increasingly influential, rely on quantitative cross-national studies of the effects of government performance and social cohesion on economic growth (Knack and Keefer, 1997; Zak and Knack, 2001; Knack, 2002). These authors equate social capital with the quality of a society’s political, legal and economic institutions. Drawing on various indexes of institutional quality, their studies show that issues such as trust, civil liberties and bureaucratic quality are positively associated with economic performance. Several empirical and methodological questions can be raised about these studies, but in aggregate their message is clear: extensive corruption, suppressed civil liberties, vast inequality, divisive ethnic tensions and failure to safeguard property rights are major impediments to prosperity. The most comprehensive definitions of social capital are multidimensional, incorporating different levels and units of analysis, and the nature and forms of social capital change over time as the balance shifts between informal organisations and formal institutions. Also because no long-standing cross-country surveys were initially designed to measure social capital, contemporary researchers have had to compile indexes from a range of approximate measures (trust, confidence in government, social mobility, partnerships, etc).
One of the great virtues of the discourse on social capital is that it provides a common language for the different stakeholders, enabling them to interact and communicate more easily. Although this is difficult to achieve as the circumstances of each country are unique, growth research can give us some insight into possible generalisations by showing us the average pattern (Temple, 2001). One way of making our generalisations more widely applicable is to discriminate more finely between societies, by introducing extra dimensions into our analysis of the growth process. Among the dimensions recently proposed, the concept of social capital appears to be a potentially effective way of discriminating between countries and their growth prospects. It provides a useful umbrella term for those aspects of societies which, though difficult to measure, are widely thought to be an important determinant of long-run economic success. Knack and Keefer (1997) use trust measures in their work and show
empirical evidence that the effect of trust is greater in low income countries, based on an interaction term in the growth regressions. Knack (2001) also reports a significant and positive correlation between investment and trust within an OECD sample and La Porta et al. (1997) show evidence on positive associations between trust and some measures of government performance. Knack and Keefer also report a strong correlation between trust and education, noting that education may strengthen trust and civic norms if learning reduces uncertainty about the behaviour of others, or if students are taught to behave cooperatively.
Then what can a policy-maker in Mexico, Turkey or Portugal actually do faced with the evidence (from the World Values Surveys) that they govern a low-trust society? Standard recommendations, such as attempting to eliminate corruption and improve the legal system, are nothing new and make good sense quite independently of any emphasis on social capital. This has a normative connotation implying that trusting relationships are good for social cohesion and for economic success. Putnam (2000) also argues that at the level of a community, enterprise or nation, the quality of life will be higher if membership of the community brings with it active participation. Nevertheless Edwards and Foley (1998) are critical of approaches that focus on items such as social psychological attributes or which use behavioural measures like recorded levels of trust and personal membership of civic associations. They argue instead for approaches that concentrate on social relations and which therefore place questions of power and inequality at the centre of the analysis.
A study of the European Commission (2005), that proposes a framework to monitor the implementation of the EU sustainable development strategy, arranges a set of indicators into three main dimensions of analysis: Economic, Social and Behavioural. The variables grouped in the
economic sphere are for example growth rate of GDP, unemployment rate, labour productivity, R&D
expenditure, etc; some items related with the social sphere are income inequality, at-risk-of poverty rate, job mobility, tertiary education attainment, etc.; and items grouped in the behavioural sphere are for example trust, partnerships, consumer confidence, life-long learning, etc. This framework is a step towards a common culture which contributes to coordinate more efficiently the several layers and agents involved through an integrative approach of governance. Nevertheless an important feature to have in mind is that these dimensions include different types of measures, which depend on a complex balance between individual liberties and social norms.
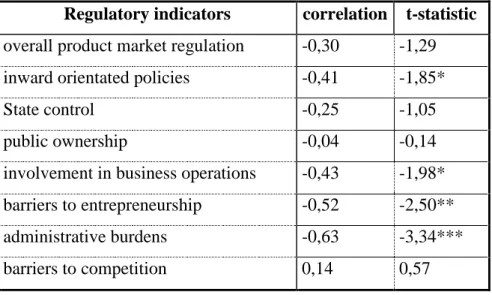
This balance should consider cross-dimensional influences in order to avoid undesired situations such as over-regulation or under-managed communities. For instance, the following table shows some results of correlations between MFP growth3 and OECD product-market regulatory indicators (Bassanini et al., 2000):
Table 1 – correlation between growth and regulatory indicators
Regulatory indicators correlation t-statistic
overall product market regulation -0,30 -1,29 inward orientated policies -0,41 -1,85*
State control -0,25 -1,05
public ownership -0,04 -0,14
involvement in business operations -0,43 -1,98* barriers to entrepreneurship -0,52 -2,50**
administrative burdens -0,63 -3,34***
barriers to competition 0,14 0,57
* Significant at 10% level; ** at 5% level; *** at 1% level.
The estimated changes in MFP rates include changes in technological progress as well as changes in efficiency with which factors of production are used. This work reports some bivariate correlations between OECD indicators of product-labour market regulations and MFP growth. It provides some supporting evidence that the negative impact of stringent regulations and administrative burden on the efficiency of product markets also results in a negative impact on overall economic growth. The corollary would be that recent policy efforts to relax regulations should have a positive influence on future growth. Another interesting result is that the correlations between skill-upgrading and labour productivity across OECD countries are less significant than the correlations between labour productivity and employment changes (job-to-job mobility). Thus only careful cross-national research, including research that is attentive to differences in political and socio-economic context among nations, and preferably longitudinal in character, could test the more general claims about the role of civil society in sustainable development.
Hypothesis 2: If a framework can be derived from this discussion, can it be tested empirically?
Country’s social cohesion, which contributes to the inclusiveness of its communities and responsive institutions, has a vitally important role in managing the effectiveness of that country’s policy response to the vagaries of the global economy. If social scientists can demonstrate this empirically, then policymakers should be able to see its significance for their country and act accordingly. Socio-economic factors, individual preferences, choices and behaviours tend to be “invisible” driving forces for both economic and social development, but are not fully surveyed from the sustainability perspective. The EU strategies and policy documents encompass several priority subjects on which no information or only partial information is available. To overcome this technical constraint and assure the necessary data for policy making in a longer time perspective requires compiling a list of “best available” and “best needed” indicators (European Commission, 2005). The first refer to those that can be produced on the basis of existing data, which may not be the ideal measures but serve as proxies for them. The second are related mostly with qualitative or intangible problems for which methodologies are not developed yet or the quality of existing data is poor or the level of desegregation needed is not accomplished. These difficulties call for different kinds of development efforts relating to concepts and data collection procedures. And these concerns recognize the importance of proper indicators that will serve to inform policy makers and the general public of the latest developments in trends concerning sustainable growth. The list of indicators can be adapted in line with any priorities and issues emerging in the contexts of governance, social cohesion, social capital and institutional learning. It can contribute to design territorial policies more capable to face the challenges of economic integration and to achieve a balance between economic growth, social cohesion and effective governance.
Dealing with social capital entails a number of risks: there is still no agreed definition, its measurement is problematic and it is highly context-dependent which causes difficulties when it comes to attempting to aggregate it across levels. Nevertheless there are key reasons why we should explore the potential utility of social capital as a policy concept. It helps to counterbalance reliance on policy concepts and instruments which are too narrow to deal effectively with the complexities and interrelated issues of the modern world. For example, technological innovation and human capital are both very powerful in their own terms and essential features of prosperity, but they cannot be taken out of their contexts of social relationships. Merely increasing the stock of human capital in any given society will not ensure social or economic progress. This focus on relationships allows the issue of social cohesion to be addressed and its maintenance in turn contributes indirectly to enhanced economic performance. Social capital also introduces a moral dimension into policy thinking: the economy is not simply a machine to
be engineered at a technical level without reference to its social context as the quality of relationships in any given social unit will determine its sustainability. One related question is how far organisations encourage their staff to play a part in the life of the surrounding community, in the course of which they may well acquire skills which impact significantly on their economic performance. Thus, the impact of training may be as much in the strengthening of networks and information flows as in the acquisition of individual competencies or improving productivity (Schuller, 2001). On the other hand, where there is low trust and poor communication an exclusive policy focus on increasing skills and qualifications will do little to reverse decline or attack social exclusion. Another related question is about how ICT (information and communication technologies) can be geared to enhance social cohesion, for example in its use within educational systems or in the way it may be used to enhance community capacities at local level.
In order to derive a framework that overwhelms some of these risks, an empirical approach follows the research hypothesis reasoning and bases its steps on:
- a cross-country cluster analysis of profiles related with a set of indicators (variables) reflecting these concerns (see Appendix 1);
- a discriminant analysis of the clusters obtained pointing the variables that most discriminate them and induce the underlying dimensions when dealing with social capital and its association to governance and sustainability.
Figure 1 – Clusters obtained from the Cluster Analysis
hierarchical cluster analysis Dendrogram using Average Linkage (between Groups)
Rescaled Distance Cluster Combine
C A S E 0 5 10 15 20 25 Label Num +---+---+---+---+---+ Poland 19 Slovakia 22 Latvia 13 Greece 7 Portugal 20 Cyprus 12 Czech Republic 3 Lithuania 14 France 9 Italy 11 Belgium 2 Ireland 10 Slovenia 21 Austria 18 United Kingdom 25 Germany 5 Spain 8 EU25 1 Estonia 6 Netherlands 17 Luxembourg 15 Hungary 16 Denmark 4 Finland 23 Sweden 24 Cluster 3 Cluster 1 Cluster 2 Cluster 4
Table 2 - Prior Probabilities for Groups (Clusters)
Average Linkage
(Between Groups) Prior Cases Used in Analysis
Unweighted Weighted 1 ,250 14 14,000 2 ,250 3 3,000 3 ,250 6 6,000 4 ,250 2 2,000 Total 1,000 25 25,000
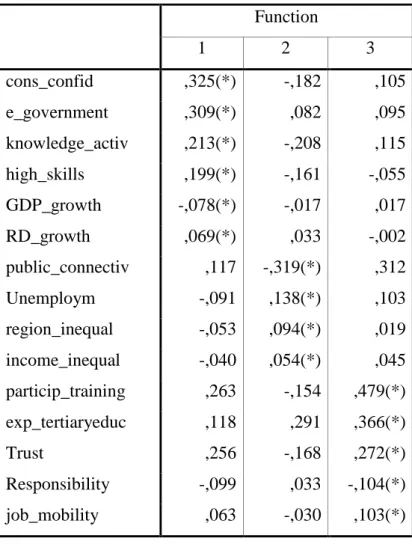
Table 3 - Structure Matrix (Discriminant Analysis) Function 1 2 3 cons_confid ,325(*) -,182 ,105 e_government ,309(*) ,082 ,095 knowledge_activ ,213(*) -,208 ,115 high_skills ,199(*) -,161 -,055 GDP_growth -,078(*) -,017 ,017 RD_growth ,069(*) ,033 -,002 public_connectiv ,117 -,319(*) ,312 Unemploym -,091 ,138(*) ,103 region_inequal -,053 ,094(*) ,019 income_inequal -,040 ,054(*) ,045 particip_training ,263 -,154 ,479(*) exp_tertiaryeduc ,118 ,291 ,366(*) Trust ,256 -,168 ,272(*) Responsibility -,099 ,033 -,104(*) job_mobility ,063 -,030 ,103(*)
Legend: pooled within-groups correlations between discriminating variables and standardised canonical discriminant functions; variables are ordered by absolute size of correlation within function.
(*) Largest absolute correlation between each variable and any discriminant function.
The main dimensions of this approach are based on these three functions and are characterised by the variables which have the largest absolute correlation between them and any discriminant function. And the role of each function (title) relates with the common goal or profile of variables most correlated with it:
F1: Governance (cons_confid; e_government; knowledge_activ; high_skills; GDP_growth;
RD_growth)
F2: Cohesiveness (public_connectiv; unemploym; region_inequal; income_inequal)
F3: Entrepreneurship (particip_training; exp_tertiaryeduc; trust; responsibility; job_mobility)
Note: due to the negative nature of the variables related with function 2 (F2), the real behaviour of this function is lacking cohesiveness.
Table 4 - Wilks' Lambda
Test of Function(s)
Wilks'
Lambda Chi-square df Sig.
1 through 3 ,001 99,585 45 ,000
2 through 3 ,023 54,865 28 ,002
3 ,168 25,870 13 ,018
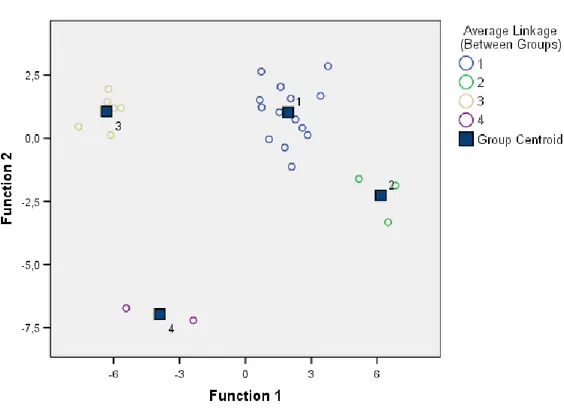
The elected discriminant functions are F1 (Governance) and F2 (Cohesiveness), as showed by the results in this table, through the Wilks’ Lambda coefficient which is proportional to intra-group variability. As these functions have lower coefficients and thus accomplish less intra-group variability, they are indicated to explain most significantly the inter-group variability. The major focus is on the variables most correlated with the discriminant functions as they represent the features that differ most between groups (discriminant variables). A joint analysis of these aspects is important as the variables affect the results, not only individually but also together through their inter-correlations which have different impacts on group formation. The canonical derived map shows the cluster’s positioning on a cross-function discriminant plan (between F1 and F2):
Figure 2 – Map with the Discriminant Functions and Clusters
. Cluster 1 (14 cases) – EU25, Belgium, Czech Republic, Germany, Estonia, Spain, France, Ireland,
Italy, Lithuania, Netherlands, Austria, Slovenia, United Kingdom
. Cluster 2 (3 cases) – Denmark, Finland, Sweden
. Cluster 3 (6 cases) – Greece, Cyprus, Latvia, Poland, Portugal, Slovakia . Cluster 4 (2 cases) – Luxembourg, Hungary
Cluster 4 – not used in this study due to its limitations (first, there are only two countries in this group which are very different; second, few data were available for both in some of the indicators used)
Cluster 2 – shows significant governance and cohesiveness (remember that, due to the negative nature of the variables related with function 2 (F2), the real behaviour of this function is lacking cohesiveness
-> A question arises from these results: Why does not the cluster 1 lose governance, as it lacks cohesiveness like cluster 3?
An eventual explanation is related with the F3 role (Entrepreneurship): as the variables high skills and
knowledge activity are higher in cluster 1 than in cluster 3, this last expends less on tertiary education
and participated training which explain higher unemployment and inequalities in cluster 3. And this scenario affects consumer-confidence index, thus citizens of its countries are expected to reclaim more trust and responsibility from the institutions and governance as the data confirm. These arguments are also based on correlation coefficients between the variables as the bivariate correlation analysis shows (see Appendix 2).
-> Other question is: Why cluster 2 is well succeeded in the underlying dimensions of this approach?
Observing the table of data for the variables used (Appendix 1), the countries of cluster 2 are the only where the consumer-confidence index is positive and relatively high. And comparing it with variables related with public efficiency issues, such as public-connectivity and e-government, there is a significant correlation between them (Appendix 2). These countries also experience considerable levels of trust and also of high-skills and knowledge activity. It is interesting to acknowledge that these are the countries which less reclaim for more responsible institutions. In fact, e-learning and knowledge media in general can play an important role in societies because effective learning occurs through active social communication and interaction. The importance of e-learning has been emphasised by recent studies which examine it as a platform where not only individuals learn but where the region or the community as a whole also learns. As this learning environment matures, its elements gain new knowledge and skills and share them valuing their cohesive commitment.
The right approach: specific context or single measure?
Determining which measures are most useful in any given setting and how best to use them in any given research context highlights other issues such as data availability, scale of analysis and type of methodology. Although a multidimensional approach is required for operating within a range of social realms, there is still a tension between the systemic character of relations and the policy need for simple cost-effective indicators. On the one hand, different types of relationships and norms are expected to operate among different networks and on the other hand, some policy research questions
call for a single measure or at least a simpler framework. Different analytic techniques are appropriate for different types of research questions, thus choosing the most relevant and efficient measurement approach will depend on the research and evaluation setting. Where data or resources are limited adhering to the principles of a common framework enables a standard approach, applicable to any context. Also individual level data can be aggregated to provide a picture of the wealth of social-economic systems in a particular community or communities. The individual-oriented approach enables an assessment of the level and distribution of social capital within a group or community. However, it has some limitations as the information gathered is restricted to respondents’ own perceptions and experience.
Existing community data may be useful as a compliment to this measure for informing research questions that could help to interpret relationships between social capital and various outcomes, such as institutional performance, within an area. Sustainable development policies must adopt a systemic approach directed towards a strategic system of interventions, and not focused on the individual agents. This is due to the choices and behaviours of a multiplicity of agents which require a good coordination scheme of policy actions. A “network” form of governance is desired to achieve coordination through a dynamics of multilateral interaction among the agents, involving them in the process of setting targets and in cooperation to achieve them.
The great number of partners and conflicting interests may have a “paralysing” effect on decision making processes what stands for strategic mechanisms such as negotiation, compensations and progressive convergence towards shared views. When conflicts and information asymmetries exist, agents may be induced to pursue their own interests that requires reducing these asymmetries through the implementation of shared rules and social norms. These are likely to improve the circulation of information among partners and increase the ability of all partners to understand the distributed information. Also there is a need of accountability mechanisms, which reinforce partners’ trust, through institutional chains to control the fulfilment of mutual engagements, account the results achieved and the use of resources. Some operative questions could be tested in future research: Do institutions of governance in our country/region systems meet these requirements?; What steps can be taken to properly adjust these institutions?
Limitations and Future Research
There are still major weaknesses, both in the availability of data and in the extent to which the sought data can be used to explain variations in economic performance or social well-being. The argument can be extended to the links between sustainable economic growth and social capital as sustainability resembles social capital in being multi-faceted. One aspect is the broadening of sustainable growth to include social and economic as well as environmental factors. It also resembles social capital in the way that relationships and interdependence are central to it, and the challenges it presents for a broader and more dynamic approach to policy-making. In its more recent forms, social capital addresses the interaction between economic openness and social change on the one hand, and the maintenance of trust and stability on the other (Leadbeater, 1999). Social context will shape strongly the character of social capital, so that it will have different meanings in different cultural settings. A social capital-based analysis of local conditions may reveal the weakness of supply-focussed policies and point to the need for wider, more integrated and multilevel policy action. And this could rethink the variables and dimensions more appropriate to use.
In addition, a longitudinal analysis is needed so that changes over time can be analysed for capturing the trajectories of social capital. There are controversial trends of its accumulation such as: (1) polarisation and networks density, which threat the ways resources are accumulated and shared, resulting in groups at risk of social exclusion; (2) as social capital depends on people being able to participate actively in community life, external job-mobility can affect its accumulation since it reduces local employment. If social cohesion is to be maintained and improved, we need more sophisticated and flexible instruments for assessing and evaluating the implications of our actions, which will have to accommodate widely differing time-scales. Its focus on horizontal as well as vertical relationships, and on the sharing of information and values, suggests a different form of coordination developed through the ongoing interaction between stakeholders. Another limitation is the few number of countries compared, and namely poor countries should be included as they double the rich group4 and whose decreasing conditions threaten the global economy. More countries will also surmount the disequilibrium among the clusters obtained.
4 Their reality is quite different: while the life expectancy in the rich countries is over 73 years, in half of the poor it is under 45 years of age (2005 Britannica Book of the Year, cited in an article “What hope exists for the poor?”, Jehovah’s witnesses Association, 8th November 2005).
The institutional view of social capital in addressing macroeconomic policy concerns is also a weakness as it lacks a microeconomic component. Neither the state nor societies are inherently good or bad as governments, corporations and civic groups are variable in the impact they can have on attaining collective goals. If states, firms and communities alone do not have the resources needed to promote sustainable development, complementarities and partnerships forged both within and across these different sectors are required. Identifying the conditions under which these synergies emerge, or fail to emerge, is a central task of development research and practice. Although the state is the ultimate provider of public goods and reinforcer of the role of law, the communities and firms also have an important role to play in creating the conditions that produce, recognise and reward good governance. Evans (1996) concludes that synergy between government and citizen action is based on complementarity and embeddeness. The first refers to mutually supportive relations between public and private actors and the second refers to the nature and extent of the ties connecting citizens and public officials.
Woolcock (1998) shows that a range of development outcomes flows from different combinations of community capacity and state functioning and Narayan (1999) suggests that different interventions are needed for different combinations of governance and social capital in a community or society. In communities or societies with good governance and high levels of social capital, there is complementarity between state and society, and economic prosperity and social order are likely. The synergy view suggests three central tasks for theorists, researchers and policy-makers: to identify the nature and extent of a community’s social relationships and formal institutions; to develop institutional strategies based on these social relations and to determine how the positive aspects of social capital - cooperation, trust and institutional efficiency - can offset isolation, corruption and poverty. To come to concrete policy recommendations for using social capital as a development tool, more comparative research is required to examine cross-country variations in poverty reduction, institutional performance and economic growth. Incorporating the concept of social capital into development policy requires to: use social institutional analysis to identify correctly the range of stakeholders and their interrelations and understand how proposed policy interventions will affect their power and interests; invest in the organisational capacity of the poor and help to build bridges between communities and social groups (participatory processes); call for information disclosure policies to encourage informed citizenship and accountability of both private and public actors; improve physical access and modern communications technology that can foster information exchange across social groups; see social capital as a component of correct development projects.
This process is fraught with multiple dilemmas, especially for external non-governmental organisations, extension services and development agencies as it may entail altering social systems that are the product of longstanding cultural traditions or of powerful vested interests. Although it is early to announce the arrival of a new development paradigm, it is not unreasonable to claim that a consensus is emerging about the importance of social relations in development. In unpacking the literature on social capital and development, a recurring message is that the nature and extent of the interactions between communities and institutions hold the key to understanding the prospects for development in a society. Then practical lessons emerging from development projects should also inform social capital theory. It is only with collaborative efforts, with all that this entails regarding perseverance, negotiation and mutual willingness to learn, that genuine progress will be made.
References
Barr, A. (1998) “Enterprise Performance and the Functional Diversity of Social Capital”, Working Paper Series 98-1, University of Oxford, U.K.
Barrios, S. and E. Strobl (2005) “The Dynamics of Regional Inequalities”, OECD Economics Department Working Papers No. 229, Paris
Bassanini, A; S. Scarpetta and I. Visco (2000) “Knowledge, Technology and Economic Growth: Recent Evidence from OECD Countries”, OECD Economics Department Working Papers No. 259, Paris
Cattan, N. (2002) “Redefining Territories: Functional Regions”, CNRS-UMR Géographie-cités, Paris Dasgupta, P. and I. Serageldin (1999) “Social Capital, a Multifaceted Perspective”, Washington D.C.: The World Bank, pp. 172-214
Edwards, B. and M. Foley (1998) “Social Capital and Civil Society beyond Putnam”, American
Behavioural Scientist, Vol. 42, Nº 1, pp. 124-139
European Commission (2005) “Sustainable Development Indicators to Monitor the Implementation of the EU Sustainable Development Strategy”, Brussels
Evans, P. (1996) “Government Action, Social Capital and Development: Reviewing the Evidence on Synergy”, World Development, Vol. 24, Nº 6, pp. 1119-1132
Granovetter, M. (1995) “The Economic Sociology of Firms and Entrepreneurs” in Portes, A. (Ed.) The Economic Sociology of Immigration: Essays on Networks, Ethnicity and Entrepreneurship, New York: Russell Sage Foundation
Grootaert, C. (1998) “Social Capital: The Missing Link?”, Social Capital Initiative Working Paper nº 3, Washington D.C.: The World Bank
Isham, J. and D. Kaufmann (1999) “The Forgotten Rationale for Policy Reform: The Productivity of Investment Projects”, Quarterly Journal of Economics, Vol. 114, Nº 1, pp. 149-184
Knack, S. (2001) “Trust, Associational Life and Economic Performance” in Helliwell, J. (Ed.) The Contribution of Human and Social Capital to Sustained Economic Growth and Well-Being: International Symposium Report, Quebec: Human Resources Development Canada
Knack, S. (2002) “Social Capital and the Quality of Government: Evidence from the U.S. States”,
American Journal of Political Science, Vol. 46, Nº 4, pp. 772-785
Knack, S. and P. Keefer (1997) “Does Social Capital have an Economic Payoff? A Cross-Country Investigation”, Quarterly Journal of Economics, Vol. 107, Nº 4, pp. 1252-1288
La Porta, R.; F. Lopez-de-Silanes; A. Schleifer and R. Vishny (1997) “Trust in Large Organizations”,
American Economic Review, Vol. 87, Nº 2, pp. 333-338
Leadbeater, C. (1999) “Living on Thin Air: The New Economy”, Harmondsworth, Penguin Books Narayan, D. (1999) “A Dimensional Approach to Measuring Social Capital”, Washington D.C., World Bank
Narayan, D. (1995) “Designing Community-based Development”, Social Development Paper 7, World Bank, Environmentally and Socially Sustainable Development Network, Washington D.C. Processed
Pezzini, M. (2003) “Cultivating Regional Development: Main Trends and Policy Challenges in OECD Regions”, Head of Territorial Reviews and Governance Division, OECD
Pritchett, L. (1997) “Divergence, Big Time”, Journal of Economic Perspectives, Vol. 11, Nº 3, pp. 3-17
Putnam, R. (2000) “Bowling Alone: The Collapse and Revival of American Community”, New York: Simon & Schuster
Ritzen, J. and M. Woolcock (2000) “Social Cohesion, Public Policy, and Economic Growth: Implications for Countries in Transition”, paper prepared for the Annual Bank Conference on Development Economics, Paris
Scarpetta, S., A. Bassanini, D. Pilat and P. Schreyer (2000) “Economic Growth in the OECD Area: Recent Trends at the Aggregate and Sectoral Level”, OECD Economics Department Working Papers No. 248, Paris
Schuller, T. (2001) “The Complementary Roles of Human and Social Capital”, Isuma, Vol. 2, Nº 1, pp. 18-24
Svendsen, G. (2003) “Political Economy of the European Union: Institutions, Policy and Economic Growth”, Cheltenham: Edward Elgar
Temple, J. (2001) “Growth Effects of Education and Social Capital in the OECD countries”, OECD Economic Studies
Whiteley, P. (2000) “Economic Growth and Social Capital”, Political Studies, Vol. 48, Nº 3, pp. 443-466
Widén-Wulff, G. and M. Ginman (2004) “Explaining Knowledge sharing in Organizations through the Dimensions of Social Capital”, Journal of Information Science, Vol. 30, Nº 5, pp. 448-458
Woolcock, M. (1998) “Social Capital and Economic Development: Toward a Theoretical Synthesis and Policy Framework”, Theory and Society, Vol. 27, Nº 2, pp. 151-208
Woolcock, M. and D. Narayan (2000) “Social Capital: Implications for Development Theory, Research and Policy”, The World Bank Research Observer, Vol. 15, Nº 2, pp. 225-249
Appendix 1 Country consumer confidence (1) Real GDP growth rate (2) unemploy ment (2) knowledge activity - KIS (2) job_to_job
mobility (3) high skills (2)
participation in training (1) regional inequalities (1) income inequalities (3) public connectivity (2) Trust (4) more responsibility (4) E-government availability (2) R&D expend. growth rate (3) expenditure on tertiary education (1) EU25 -11,6 2 9,2 33,1 : 38,4 9,4 : : 21,2 : 8,9 41 2,7 37,1 Belgium -14,1 2,9 8,4 38,6 5,2 43,5 9,5 1,18 4,3 : 29,2 7,6 35 6,2 42 Czech Republic -0,1 4,4 8,3 24,6 4,4 37,7 6,3 0,99 3,4 3,1 24,5 5,8 30 9,2 37,6 Denmark 15,4 2,1 5,5 42,3 10,9 43,2 27,6 : 3,6 42,5 66,5 1,3 58 5,2 50,5 Germany -14,1 1,6 10,3 33,4 5,7 41,8 6 0,92 4,3 31,3 37,5 6,5 47 1,2 41,4 Estonia -10,3 7,8 9,7 27,5 7,4 39 6,7 1,54 5,9 14,2 23,5 11 63 11,7 : Greece -34,7 4,7 10,5 24,9 : 32,6 3,7 0,8 6,6 7,2 23,8 9,3 32 3,4 24,9 Spain : 3,1 11 26,1 6,5 30,7 5,2 1,04 5,1 22 34 18,9 55 12,7 34,7 France -13,2 2,3 9,6 36,2 8,1 38,6 7,8 0,75 : : 21,3 3,8 50 1,1 32 Ireland -4,2 4,5 4,5 33,4 : 40,1 7,2 : 5,1 11,4 36,1 4,6 50 3,5 29,4 Italy -20,5 1,2 8 30,2 4,6 39,2 4,7 1,31 : : 32,6 12,2 53 5,9 31,3 Cyprus -39,6 3,8 4,9 26,2 7,6 28,2 9,3 : 4,1 10,4 : : 25 14,1 48 Latvia -15,2 8,3 10,4 24,6 7 33,8 9,1 2,21 : 12,1 17,1 20,7 5 5,3 33,9 Lithuania -7,3 7 11,4 25 4,9 33 6,5 0,96 : 8,9 25,9 13,7 40 9,8 35 Luxembourg -4,2 4,5 4,8 38 4 45,4 6,3 : 4 35,6 24,8 5,4 20 : : Hungary -24,2 4,6 6,1 28,5 4,1 34,2 4,6 1,22 : 14,9 22,3 17,4 15 5,1 : Netherlands -6,7 1,7 4,6 41 : 49,4 16,5 1,01 : 17,2 60,1 0,8 32 2,7 43,9 Austria -5,2 2,4 4,9 31,3 5,5 37,6 12 1,19 4 17,6 33,4 4,2 72 4,8 41,4 Poland -20 5,3 19 24,3 4,9 31,7 5,5 1,35 : 11,9 18,4 14,5 10 -3,8 43,4 Portugal -41,2 1,2 6,7 22,2 5,6 25,9 4,8 1,17 7,4 10,3 12,3 9,1 40 -2,4 26,7 Slovenia -20,6 4,2 6,3 24,2 5,9 36,1 17,9 0,58 : 11,7 21,7 19,8 45 2,5 38,2 Slovakia -23,5 5,5 18,2 25,1 : 35,2 4,6 1,38 5,4 20,9 15,9 17,1 15 1,3 37,7 Finland 13,2 3,6 8,8 40,3 9,5 43,4 24,6 1,12 3,6 43,3 57,5 2,9 67 2 43,2 Sweden 6,3 3,6 6,5 47 3,1 44,1 35,8 0,77 : 35,8 66,3 1,9 74 12,4 56,1 United Kingdom -2,9 3,2 4,7 42,1 10,2 40,6 21,3 0,75 5,3 19,5 28,9 3,4 59 5,9 42,7
Sources: Eurostat, OECD, WVS Consumer confidence indicator: financial situation; general economic situation; unemployment expectations;savings (1) year 2005 Knowledge activity - KIS: employment in knowledge services as a % of total employment
(2) year 2004 Participating in education and training (Lifelong learning) Europe in figures, Eurostat yearbook 2005
(3) year 2003 Regional inequalities: measured using the standard deviation of the logarithm of Regional GDP per capita (Barrios & Strobl, 2005). (4) World Values Survey 1999/2000 Public connectivity - share of individuals using the internet for interacting with public authorities
Appendix 2 Spearman’s Coefficient cons_ confid GDP-growth unemploy ment knowledge activity job- mobility high-skills particip-training region-inequal income- inequal public-connectiv Trust responsi bility e-govern ment RD-growth exp- tertiaryeduc cons_confid 1,000 -,107 -,242 ,617** ,181 ,587** ,566** -,283 -,085 ,533** ,717** -,459* ,581** ,258 ,323 GDP-growth -,107 1,000 ,342 -,403* -,128 -,309 -,227 ,259 ,030 -,070 -,318 ,437* -,418* ,160 -,274 Unemployment -,242 ,342 1,000 -,489* ,005 -,453* -,466* ,480* ,008 -,122 -,315 ,607** -,228 -,074 -,145 Knowledge activity ,617** -,403* -,489* 1,000 ,092 ,850** ,596** -,372 -,071 ,474* ,667** -,721** ,513** ,100 ,391 Job-mobility ,181 -,128 ,005 ,092 1,000 -,065 ,385 -,003 ,095 ,102 ,046 -,153 ,368 ,168 ,239 high-skills ,587** -,309 -,453* ,850** -,065 1,000 ,540** -,250 -,139 ,374 ,667** -,554** ,386 -,052 ,273 particip-training ,566** -,227 -,466* ,596** ,385 ,540** 1,000 -,383 -,275 ,357 ,395 -,596** ,506** ,202 ,668** region-inequal -,283 ,259 ,480* -,372 -,003 -,250 -,383 1,000 ,023 -,159 -,141 ,536** -,190 ,020 -,185 income-inequal -,085 ,030 ,008 -,071 ,095 -,139 -,275 ,023 1,000 ,042 -,018 -,060 ,138 ,018 -,223 public-connectiv ,533** -,070 -,122 ,474* ,102 ,374 ,357 -,159 ,042 1,000 ,396* -,233 ,310 -,111 ,334 Trust ,717** -,318 -,315 ,667** ,046 ,667** ,395 -,141 -,018 ,396* 1,000 -,440* ,594** ,210 ,350 Responsibility -,459* ,437* ,607** -,721** -,153 -,554** -,596** ,536** -,060 -,233 -,440* 1,000 -,395 -,063 -,528** e-government ,581** -,418* -,228 ,513** ,368 ,386 ,506** -,190 ,138 ,310 ,594** -,395 1,000 ,263 ,208 RD-growth ,258 ,160 -,074 ,100 ,168 -,052 ,202 ,020 ,018 -,111 ,210 -,063 ,263 1,000 ,137 exp-tertiaryeduc ,323 -,274 -,145 ,391 ,239 ,273 ,668** -,185 -,223 ,334 ,350 -,528** ,208 ,137 1,000