first name & family name: Antbnio Carvalho Page number: 1
ACOUSTICAL
MEASURES IN CHURCHES
PORTO’S CLhIGOS
CHURCH, A COMPREHENSIVE
EXAMPLE
Antonio P. 0. CarvalhoLaboratory of Acoustics, Faculty of Engineering, University of Port0 Rua dos Bragas
P-4050-123 Porto, Portugal carvalho@fe.up.pt
Abstract
This paper summarizes the methodology applied on a research program in Church Acoustics. The acoustical behavior of Catholic churches must be analyzed regarding three domains: quality for speech (intelligibility), quality for music and quality of the sound distribution within the room. To characterize the physical response of each church several objective acoustical measurements (RT, EDT, etc.) are taken at several receiver locations and using two sound source positions (altar and nave) in each room. The quality of music and speech is judged subjectively by a group of listeners that is asked to evaluate live music performances and speech tests. The quality for music perception is judged using a seven-point semantic differential rating scale regarding several subjective parameters (intimacy, envelopment, etc.). The quality for speech perception is also measured objectively using the RASTI with and without the use of the churches’ sound reinforcement systems from the altar area and from the elevated lateral pulpits. This paper presents the use of this methodology with the Porto’s Clerigos church as a comprehensive example.
INTRODUCTION
This paper is a comprehensive analysis of the methodology used in the research program initiated in 1991 by the author at the University of Port0 (Portugal) and University of Florida (USA). The aim of the project is to explore methods to evaluate, predict and preview the acoustical qualities of churches. The program involves field measurements in a very large number of Portuguese Roman Catholic churches. Portugal is one of the oldest European countries and played a prominent role in some of the most significant events in world history. It presents an almost perfect location to trace the history of Catholic Church buildings in the world. Portuguese churches can be considered a representative example of Catholic churches in the world. This paper presents the methodology used using as example one of the most important Portuguese churches.
SELECTED CHURCH
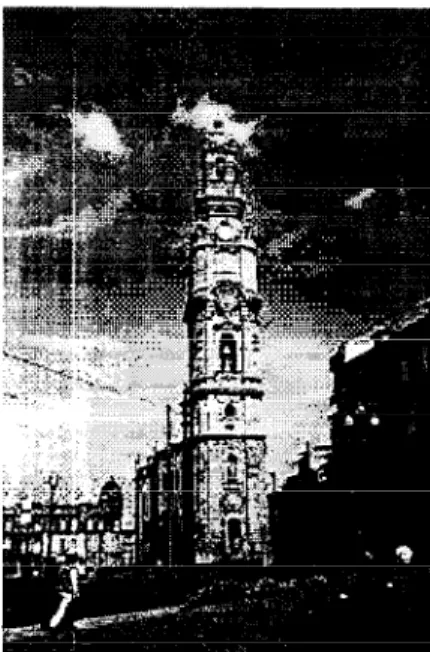
The Clerigos church (built between 1735 and 1748) is Porto’s most proud Emblem. It is a baroque church designed by the Italian architect Niccolo Nasoni (1691-1773) which activity was prodigious in Port0 judging by the numerous monuments edified by him. It is flanked to the west by a 76-meter high granite belfry that is today the main symbol of the town and dominates the entire downtown area due to its elevated location in a summit. The church is remarkable for its facade, the interior staircase of the presbytery, the liturgical decoration and the polychromatic rococo altarpiece by Manuel Porto. The elliptical plan shape of the nave shows its Italian influence. The Clerigos church is a national monument since 1910 (Fig. l-3).
Fig. I ~ Clkrigos ’ church be&y. Fig. 2 - Ckrigos ’ church interior.
first name & family name: Anthio Carvalho Page number: 3
METHODOLOGY
Method Summary
The main research hypothesis is that the acoustics differences within and among churches could be measured. The study has included two major components to date:
l Objective studies - Objective acoustical parameters are measured at multiple locations in each church (RT, EDT, C&O, D50, TS, L, BR-RT, BR-L and RASTI). [l, 21
l Subjective studies - Evaluations of live musical performances and speech intelligibility testing. This work is characterized by the use of a sample of listeners and evaluation of subjective parameters (loudness, intimacy, reverberance, envelopment, balance, clarity, echoes, background noise and overall impression) on several locations in each church. [2,3]
The churches were measured while unoccupied. The limitations using this type of methodology for evaluations were fully realized. The acoustical response of the church changes when it is fully occupied. Nevertheless this methodology gives a normalized sound environment that could be easily compared among churches (most of the available bibliographic data were determined for unoccupied conditions). Therefore consistency of data is useful for possible comparison purposes. Transfer functions to account for the presence of persons were studied [4].
Sample of Churches Used
This study reports on acoustical field measurements done in a survey of 56 Roman Catholic churches in Portugal that were built between the 6th century and 1997 [l-3]. The churches were selected to represent the main architectural styles found throughout Portugal and to represent the evolution of church construction. The evaluations were held in churches grouped by large periods of history and architecture: Visigothic (6th- 1 lth centuries), Romanesque (1 lth- 13th centuries),
Golhic (13th- 15th centuries), Renaissance (16th-17th centuries), Baroque (17th- 18th centuries),
Neoclassic (1 Sth- 19th centuries) and Contemporary (20th century).
The Parameters
Architectural Parameters.
The acoustical variations found among churches may be explained by the effects of the architectural features. Fifteen architectural parameters were chosen (Table 1).( Height Nave (m) 19.0 ( I
Nave (or To&l) stands for the entire church excluding (or including) lateral chapels and main altar (apse)
Acoustical Objective Parameters.
Six monaural acoustical measures were chosen to provide the greatest potential to describe the dual functions of speech and music found in churches. The measurements chosen included Definition for speech; Clarity and Center Time for music; and Reverberation Time and Loudness for their hypothesized role in characterizing the overall acoustical impression in a room. Loudness was included due to its strong relation with the sensations of loudness and intimacy. The sense of acoustic intimacy, to feel involved or detached from the sound performed, is, in a church, an important subjective quality and perhaps plays a role in the creation of an environment of mystique or dignity in the place. The acoustical measures used are:- Reverberation Time (RQ It was calculated from reverse integration of the logarithmic decay curve obtained from an impulse response. RT is suggested to be a measure of the subjective sense of reverberance, however, to a lesser degree than EDT.
- Early Decay Time (EDT). It is an adaptation of the RT now measured from a decay of 10 dB. EDT is suggested to be a measure of the subjective sense of reverberance, clarity and overall acoustical impression.
- Clarity with a time window of 80 ms (C80) is the ratio in dB between the energy received in the first SO ms of the received signal and the energy received afterwards. This limit was proposed as the limit of perceptibility for music. C80 is suggested to be a measure of the sense of clarity.
- Definition with a time window of 50 ms (D50) is the ratio between the energy received in the first 50 ms and the total energy received. It lies between 0 and 1. The duration of 50 ms was called the limit of perceptibility regarding speech. It is hypothesized to be a measure of how clear a sound appears to a listener - the higher the D50, the clearer the sound.
- Center Time (Ts) is the point in time where the energy received before this point is equal to the energy received after this point. It is also hypothesized to be a measure of how clear a sound appears to a listener - the lower the TS, the clearer the sound.
- Loudness or Relative Strength of arriving energy (L or G) is the ratio, in dB, of the total energy received at a particular position in the enclosure and the energy received due to the direct sound alone (measured at 10 m from the source in an anechoic environment). It is a measure of the ability of a room to intensify sound at a particular position when compared with an anechoic environment. It is also used to verify the uniformity of the sound field in a room and to determine if the transmitted energy to the room is deficient at some frequencies. It is suggested to be a measure of the sense of loudness and intimacy.
Two bass ratios were calculated. They are usually used to evaluate balance by comparing the loudness and RT for the low frequencies and high frequencies. They are usually used to evaluate the subjective sense of timbre, tonal balance or warmth. They are defined as follows:
- Bass Ratio based on Reverberation Time BR-RT = [RT(125,) + RT(250)] I [RT(500) + RT(lk)] - Bass Ratio based on Loudness BR-L = [L(125) + L(250) - L(500) - L(lk)l I2
The method used to calculate the acoustical measures is based on the integrated impulse- response method. A limited-bandwidth noise-burst is generated and transmitted into the church by a loudspeaker via an amplifier. The room’s response to the noise-burst (called the impulse response) is then sampled from the RMS detector output of the sound level meter. The loudspeaker was placed at two sound source locations in each church: one in front of the altar to standardize the measurements and to be able to compare results among churches and another in the center of the main floor to simulate the sound of the congregation. Each measurement was
first name & family name: Ant6nio Carvalho Page number: 5
calculated from an ensemble of three pulse responses in each of four receiver positions. The microphone at each location was placed at 1.30 m above the floor.
Speech intelligibility was quantified by the calculation of the Rapid Speech Transmission Index (RASTI). This method, a simplified version of the Speech Transmission Index, involved measurement of the reduction of a transmitted test signal that has certain characteristics representative of the human voice and has been related to subjective intelligibility. The RASTI is a value between 0 and 1 derived from the measured reduction in signal modulation between the transmitter and receiver positions. The transmitter location was in front of the main altar at about 1.65 m above the floor to represent a standardized speech situation during services. The level of the source was +lO dB compared with the RASTI standard level due to the large volume of some of the churches. Four positions in each church were used for the receiver location. In each receiver position three measurements were taken [2, 51.
Binaural measurements were also taken using a dual channel real-time frequency analyzer to test the hypothesis that a new binaural acoustic measure can be useful in room acoustics studies. In the simultaneous analysis of signals it is no longer the signals themselves that are of primary interest, but rather the properties of the physical system responsible for the differences between them. The idea was to use both instant spectra (channels A and B inputs) and their cross spectrum to find the coherence values where A and B are microphones placed at both ears of a test person in the middle central nave. A pink noise source was used with the loudspeaker in front of the altar. The coherence gives a measure of the degree of linear dependence between the two signals, as a function of frequency. It can also be interpreted as a squared correlation coefficient expressing the degree of linear relationship between two variables (I if there is a perfectly linear relationship between both signals at both ears, 0 if there is no relationship whatsoever between ear signals). A new binaural acoustical measure (derived from the coherence) was defined and called BACH, Binaural Acoustic CoHerence [6] and used for further analysis to test its validity in identifying differences among churches.
Acoustical Subjective Parameters.
A group of 16 college students from the School of Music and Performing Arts was chosen to judge the quality of music and speech throughout the churches. In each church the listeners were seated in two similar locations. They listened to music for ten minutes by a live performance from oboe and cello then rated the acoustical qualities of the church on a questionnaire sheet with ten semantic differential rating scales with seven points:l Loudness (or strength of the sound): I (extremely weak) to 7 (extremely strong);
l Clarity (the degree to which notes are distinctly separated in time and clearly heard): 1 (not clear enough) to 7 (extremely clear);
l Reverberance (the persistence of sound in space): I (totally dry) to 7 (too reverberant);
l Intimacy (the auditory impression of the apparent closeness of the orchestra or players): I (absence of intimacy) to 7 (extremely intimate);
l Directionality (the auditory impression that the sound comes from the axis of the sound source; importance of the direct sound field): I (very bad) to 7 (excellent);
l Envelopment (the sense of being immersed in the sound or surrounded by it; importance of the reverberant field): I (not surrounding at all) to 7 (extremely surrounding);
l Balance (the relative levels of bass and treble frequencies): I (totally unbalanced) to 7 (very well balanced);
l Echoes (long delayed reflections clearly audible): I (none detected) to 7 (clearly heard); l Background Noise (the sound heard other than from the source in the performance area): I
(not audible) to 7 (too loud);
l Overall Impression (of the acoustical quality of the room): I (very bad) to 7 (very good). For the speech intelligibility tests a young theater student, was used as a speaker. In each church she read a different list of 80 short words within the same sentence: “Say (word) please” (in Portuguese). The sentences were said with similar loudness and rhythm. The list of words used in each church was chosen from an innovative 600-word list that represents the Portuguese language. In each church the listeners were seated in four similar locations (A, B, C and 0).
Equipment
The equipment used was a sound level meter Briiel & Kjcer @a) 223 1 or 2260, filter set B&K 1625, Room Acoustics module B&K BZ7 109, sound source B&K 4224, notebook computer and application software B&K VP7155, speech transmission meter B&K 3361, l/2” diameter microphones B&K 4129 and 4165, dual channel real-time frequency analyzer B&K 2144, microphone preamplifiers B&K 2639, and application software B&K 5306.
RESULTS FOR THE CLlhIGOS
CHURCH
Tables 2 to 6 present the results found for the objective parameters. The variability of the sound distribution within the room is show in Table 2 by the standard deviation values where it is shown that the RT and EDT present a more homogeneous distribution than the values for D50 and CSO. Table 3 shows the six frequency averaging options used to test the collected data. Tables 7 and 8 show the results for the subjective parameters.
Table 2 - Mean values measured in the CXrigos church (3 measurements in each of 4positions within the room) with standard deviation (sd) for two sound source (SS) locations.
Freq. band
125
250 500lk
2k
4k
(Hz)
mean sd mean sd mean sd mean sd mean sd mean sd1 SS on the ALTAR area.
RT (4
3.91 0.42 3.68 0.00 3.38 0.20 3.33 0.21 3.10 0.22 2.35 0.18 EDT(s) 2.94 0.07 3.13 0.33 3.11 0.22 2.97 0.25 2.67 0.20 2.18 0.23 CSO (dB) 1 0.2 t 2.7 1 -3.4 RT (s) 1 4.06 TS (ms) 1 188 1 56 f 28 ~~ 273 38 251 50 217 42 177 36 L (dB) 1 15.1 [ 2.3 [ 14.4 1 I.5 12.3 1.4 12.2 1.7 11.1 2.1 12.2 1.5 / Bass ratios 1 BR RT= 1.15 BR L = 2.40first name & family name: Anthio Catvalho Page number: 7
1 only 2 and 4 kHz frea. bands
I
onlv 4 frea. bands (125 to 11 on1on1
i
on1 on1
the 4 highest freq. b. (500 to 4k Hz) the 4 medium freq. b. (250 to 2k Hz) 3 freq. bands (500 to 2kHz)
2 freq. bands (500 and lk Hz)
1 2.68 1 2.45
3.25
2.77 1 -4.6 10.20 1
-3.4 1 U.16 1 249 11.4 j
Table 5 ~ RASTI values measured in the Clkrigos church (3 measurements in each
of
4 receiver positions and 3 sound source locations within the room).Receiver Position
A B C DAverage
sound source at the ALTAR (P.A. system off) 0.55 0.40 0.33 0.24 0.38 sound source at the PULPIT (P.A. system off) 0.38 0.44 0.34 0.24 0.35 sound source at the ALTAR (with P.A. system on) 0.50 0.55 0.55 0.49 0.52 Table 6 - Averaged values found in the Clkrigos church for the subjective perception for live
Table 7 - Live speech intelligibility scores the Clkrigos church (4 measurements in each
qf
4 positions within the room).POSITION
A B C DAverage
Words understood (%) 99 94 95 84 93
Distance to sound source - Altar (m) 3.8 7.4 13.2 20.4 -
To check the effect of the sound reinforcement system (SRS) from the Altar area and also of the Pulpit as the emitting location, the RASTI Gain was defined that represent the difference - between the RASTI values:
l RASTI-Gain-Altar-SRS = (RASTI-Altar-SRS.on) - (RASTI-Altar-SRSoff) l RASTI-Gain-Pulpit = (RASTI-Pulpit) - (RASTI-Altar)
If the RASTI-Gain is positive it represents that the SRS On improves the RASTI values; if negative it shows a decrease in the RASTI values on that receiver position by the of the SRS, and the same with the Pulpit data. To better understand the effect of the SRS and of the Pulpit as emitting location in the RASTI values within the churches, two Improvement Factors (rF) were defined as seen below.
As seen in Table 8, the use of the SRS considering all receiver positions within the church increases, on average, 38 per cent the RASTI or 0.14 its absolute values. The use of the Pulpit as emitting location decreases, on average, 8 per cent the RASTI or 0.03 its absolute value. If not using the closest position to the Altar (only positions B, C and D) the use of the SRS increases, on average, 64 per cent the RASTI. In this case the use of the Pulpit as emitting location increases, on average, 5 per cent the RASTI.
IF sRs
= (RASTI _ Altar _ ~Rii’.on)chwch.overoga (RASTI _ Altar _ SRS,off)church.av~~roge
Table 8 - RASTI Gain and the Improvement Factors calculatedfor the Clkrigos’ church. _ type RASTI Gain (all 4 positions) IF (all 4 positions) IF (without position A)
SRS 0.14 1.38 1.64
Pulpit -0,03 0.92 1.05
CONCLUSION
With all the data measured and calculated using the methodology describe above in all the selected churches, several analyses were done testing relationships among all those parameters. All the statistical analyses were done using the SYSTATBsofiware [7-121.
REFERENCES
[ 1] A. Carvalho, Influence of Architectural Features and Styles on Various Acoustical Measures in Churches, Ph.D. Dissert., (U. Florida USA, 1994)
[2] M. Lencastre, A Inteligibilidade da Palavra em lgrejas Catdlicas, atravks de Amilises de Carcicter Objective e
Subjective, MSc. thesis, (U. Porto, 1998)
[3] A. Morgado, Estudo Actistico de Igrejas Portuguesas atravb de Par&metros Subjectivos, MSc. thesis, (U. Port0 1996)
[4] A. Carvalho, “The significance of the Church Occupancy in the RASTI values in a Catholic Church”, Proc. CFA2000 (2000) [acceptedfor publication]
151 A. Carvalho, “Relations between rapid speech transmission index (RASTI) and other acoustical and architectural measures in churches”, Appl. Acoustics, 58/l, 33-49 (1999)
[6] A. Carvalho, “BACH, a New Binaural Parameter”, Proc. 15th Int. Congress on Acoustics, 2,409-412, (1995) 171 A. Carvalho, “Relationships between Objective Acoustical Measurements and Architectural Features in
Churches”, Proc. Sabine Centetial SympJl27th Acoust. Sot. of Am. Meeting, 3 11-3 14 (1994)
[8] A. Carvalho, “Effect of Architectural Styles on Objective Acoustical Measures in Portuguese Catholic Churches” Proc. WESTPRAC V, 1,613-618 (1994)
[ 91 A. Carvalho, “Prediction of Acoustical Measures in Churches”, Sound & Video Contractor, 13/l, (1995) [ 101 A. Carvalho, “The Sabine Equation and Coupled Spaces in Churches”, Proc. Inter-Noise ‘95, 1, 339-342 (1995) [ 1 l] A. Carvalho et. al., “Relationships between subjective and objective acoustical measures in churches”, Build.
Acoustics, 4/l, l-20 (1997)
[ 121 A. Carvalho et. al., “Catholic Churches, Sound-reinforcement Systems and RASTI”, Int. J. of Acoustics and Vibration, S/l (2000)