UNIVERSIDADE DO ALGARVE
Faculdade de Ciências e Tecnologia
CHROMATOGRAPHIC ANALYSIS AND COMPARISON OF
CHEMICAL COMPOSITION OF THE SAMPLES BETWEEN
OLIVE OILS IN EUROPE AND SOME CHINESE OILS
Miguel Duarte Ferro
Mestrado em Qualidade em Análises
(European Master in Quality in Analytical Laboratories)
Trabalho efectuado sob a orientação de:
Doutora Isabel Cavaco
Professor Yizeng Liang
C
HROMATOGRAPHICA
NALYSIS ANDC
OMPARISON OFC
HEMICALC
OMPOSITION OF THES
AMPLES BETWEENO
LIVEO
ILS INE
UROPE ANDS
OMEC
HINESEO
ILSDeclaração de autoria de trabalho:
Declaro ser o autor deste trabalho, que é original e inédito. Autores e trabalhos
consultados estão devidamente citados no texto e constam da listagem de
referências incluída.
_____________________________________
© A Universidade do Algarve tem o direito, perpétuo e sem limites geográficos, de arquivar e publicitar este trabalho através de exemplares impressos reproduzidos em papel ou de forma digital, ou por qualquer outro meio conhecido ou que venha a ser inventado, de o divulgar através de repositórios científicos e de admitir a sua cópia e distribuição com objetivos educacionais ou de investigação, não comerciais, desde que seja dado crédito ao autor e editor.
Aknowledgement
The work here presented was carried out in two different phases, the first one, the experimental part, in the Central South University, China, and the second one, the writing part, in the University of Algarve, Portugal.
First of all, I want to leave a very special thanks to Professor Yizeng Liang and his students Yang Yang, Long Xuxia, Hongdong Li and Wei Fan, for all his kindness, guidance and hospitality.
Then, I also have to say that without all the help and support from Doutora Isabel Cavaco, to whom I am most grateful, I would have never finished this work.
To my father and my brother, I also want to say thank you for all the encouragement, and most specially, to my mother.
Page | 5
Resumo
O azeite é um óleo vegetal caracteristico da denominada “dieta Mediterranica”, bem conhecida pelos seus efeitos benéficos para a saúde humana, tais como na prevenção de doenças cardiovasculares e na redução da incidência de cancro. Para além dos efeitos benéficos para a saúde, o azeite apresenta também uma elevada importância económica na região do Mediterrâneo, sendo esta responsável por mais de 90% da produção mundial de azeite. Tal como o azeite apresenta um forte impacto na economia dos países do Mediterrâneo, outros tipos de óleos vegetais apresentam também efeitos semelhantes em regiões distintas do Mundo, tal como o óleo de semente do chá em algumas províncias do sul da China. Para além do óleo de sementes do chá, vários outros tipos de óleo são também utilizados na preparação das refeições do dia-a-dia nas várias províncias da China, tal como o óleo de girasol, o óleo de colza, o óleo de sesamo, o óleo de milho e o óleo de amendoim, visto estes apresentarem preços bastante mais acessiveis quando comparados com o óleo de semente do chá.
As caracteristicas únicas de cada típo de óleo vegetal encontram-se directamente relacionado com a sua composição intrínseca, onde se encontra incluido tanto a distribuição dos ácidos gordos bem como as proporções entre eles. Visto a constituição em termos de ácidos gordos ser de tal forma importante para as caracteristicas dos óleos vegetais, o estudo da sua composição torna-se assim uma boa forma de caracterizar os diferentes óleos. Assim, a técnica de análise por CG-MS “fingerprinting” foi aplicada à caracterização dos diferentes tipos de óleo vegetal testados, tendo esta sido apta de identificar um total de 22 ácidos gordos entre os sete óleos analizados no laboratório da Central South University (CSU), onde 19 foram identificados no azeite, óleo de semente do chá, de milho, de amendoim e sésame, 20 no óleo de girasol e 22 no óleo de colza. Após a identificação dos ácidos gordos, métodos de quimiometria foram utilizados para a análise dos dados, nos quais se encontram incluidos o Principal Component Analysi (PCA) e o Partial Least Squares – Linear Discriminant Analysis (PLS-LDA). O principal objective da utilização destes métodos foi então o de observar se (1) é possível a formação de grupos entre as amostras de azeite de acordo com o seu local de produção na Peninsula Ibérica, e se (2) o método de “fingerprinting” utilizado pode ser validado para as análises de óleos vegetais através da comparação dos dados obtidos quer intra- quer interlaboratorialmente.
Page | 6
Através da utilização do método PLS-LDA foi-nos possível distinguir diferentes grupos de amostras de azeite de acordo com o seu local de origem na Peninsula Ibérica. Quando comparadas as amostras de azeite com as de óleo de semente do chá, foi notória a semelhança por estas apresentada em termos de “fingerprinting”, mas quando comparada estatisticamente, a sua composição em termos de ácidos gordos, foi observado a existência de diferenças significativas em quase todos os parâmetros analizados, apenas o ácido Oleico, o ácido Linoleico, o ácido Docosanóico e as MUFAs apresentaram valores de P≥0.05. Estando estas diferenças de acordo com os resultados obtidos através do modelo de PCA obtido, onde ambos os dois grupos de amostras conseguem ser perfeitamente separados.
De modo a verificar a validade deste método em termos da sua de repetibilidade, um novo conjunto de amostras voltou a ser preparado e analizado (2º batch), tendo sido posteriormente comparado com as primeiras amostras (1º batch) quer por modelos de PCA quer por PLS-LDA, tendo-se verificado que não existe separação entre os dois conjuntos de amostras, indicando assim que uma boa repetibilidade do método consegue ser obtida. No que diz respeito à reprodutibilidade, de modo a ser determinado este parâmetro as amóstras de óleo foram novamente preparadas e analizadas num outro laboratório, no Hunan Agricultural Product Processing Institute (HAPPI), mas visto que nem todos os parâmetros que definem a reprodutibilidade de um método puderam ser devidamente estabelecidos (tal como a utilização de um analista diferente), não será analizada a reprodutibilidade mas sim a precisão intermédia. Os resultados obtidos pelas análises efectuadas em ambos os laboratórios demonstraram assim que a precisão intermédia do método é bastante boa, conseguindo produzir resultados equivalentes em ambos os laboratórios.
Visto que no laboratório do HAPPI apenas foi possível a identificação de 12 ácidos gosdos para as amostras de azeite (em contraste com os 19 identificados no laboratório da CSU) e que mesmo com este reduzido número de ácidos gordos foi possível obter resultados semelhantes, resolvemos então testar todas as análises anteriormente efectuadas de modo a verificar se resultados semelhantes poderiam ser obtidos ao reduzir o número de ácidos gordos utilizados. Os resultados obtidos demonstram então que semelhantes conclusões podem ser produzidas quando recorrendo a um número mais restrito de ácidos gordos para as análises quimiométricas, demonstrando assim que estes 12 ácidos gordos possúem a informação relevante para o estudo em causa.
Page | 7
Sendo que por vezes nem sempre é possível a utilização de um padrão interno na preparação das amostras, decidiu-se também verificar se a ausência do mesmo iria alterar os as concluões obtidas pelas análises anteriormente produzidas, assim todos os resultados voltaram a ser analizados mas sem a utilização do padrão interno, tendo sido um ácido gordo que se encontra presente em todos os óleos vegetais escolhido para servir de pico de referência, o ácido Palmitico. Este pico de referência foi usado assim para o cálculo das áreas relativas dos restantes ácidos gordos. Os resultados obtidos com estas análises demonstraram que ao usar o ácido Palmitico como pico de referência em vez do padrão interno semelhantes conclusões podem ser obtidas, sendo esta uma possibilidade para a realização deste tipo de análises
Para além das análises efactuadas na CSU e no HAPPI, algumas amostras foram também preparadas na Universidade do Algarve (UAlg) através de um método diferente do anteriormente utilizado, mas onde apenas foi possível a análise de uma amostra e em diferentes condições de detecção (modo TIC, total ion current), tornando-se deste modo impossível a comparação destes resultados com os restantes dados, mas deixando uma porta aberta para uma possível continuação deste estudo.
Page | 8
Abstract
Olive oil is a well known vegetable oil due to its beneficial effects on human’s health and its strong economic importance in the Mediterranean area, being this region alone responsible for more than 90% of the olive oil’s world production. In other regions such as the Chinese one, olive oil is not that commonly used, and other vegetable oils such as tea seed oil, rapeseed oil, sesame oil, corn oil, sunflower oil and peanut oil are rather used to prepare the daily meals.
The unique characteristics of each type of vegetable oil is directly related to their fatty acid distribution, being this way the study of the fatty acid composition a good way to characterize them. So, GC-MS fingerprinting technique was applied for the characterization of the different oils, being able to identify a total of 22 fatty acids among the seven tested oils in the CSU’s laboratory. Then, chemometrics were applied for data analysis, which included Principal Component Analysis (PCA) and Partial Least Squares – Linear Discriminant Analysis (PLS-LDA), in order to see if (1) it was possible to group the olive oils according to their region of production in the Iberian Peninsula, and (2) this fingerprinting method could be validated for the analyses of vegetable oils through its both inter- and intra-laboratorial comparison.
With PLS-LDA we were able to group the olive oil samples according to their region of production, and also a clear distinction could be made between olive oil and tea seed oil by means of a PCA model. In terms of repeatability and intermediate precision, good results were also obtained from the analyses performed both in CSU and HAPPI. The same analyses were then performed resorting to a group of 12 fatty acids, and similar results could be observed as when using all the fatty acids, meaning that these 12 fatty acids posses sufficient information to characterize the different types of oil.
The use of Palmitic acid as a reference peak instead an internal standard was also tested, proving to be a good way to perform these analyses.
Page | 9
Chapter index
Aknowledgement ____________________________________________________________ 4 Resumo ____________________________________________________________________ 5 Abstract ____________________________________________________________________ 8 1 Introduction ____________________________________________________________ 181.2. Olive oil background __________________________________________________ 18 1.2.1. Economic weight ________________________________________________ 18 1.3. Edible fats and oils ___________________________________________________ 21 1.3.1. Nomenclature of fatty acids ________________________________________ 21 1.3.1.1. Saturated fatty acids (SFAs) ____________________________________ 22 1.3.1.2. Unsaturated fatty acids (UFAs) _________________________________ 23 1.3.1.3. Monounsaturated fatty acids ___________________________________ 23 1.3.1.4. Polyunsaturated fatty acids ____________________________________ 24 1.3.2. Fatty acids______________________________________________________ 25 1.3.3. Triacylglycerides _________________________________________________ 27 1.4. Vegetable oils characterization _________________________________________ 29 1.4.1. Background _____________________________________________________ 29 1.4.2. Principles of chromatography ______________________________________ 30 1.4.3. Gas chromatography _____________________________________________ 30 1.4.4. Gas chromatography – mass spectrometry ____________________________ 31 1.4.5. Fingerprinting ___________________________________________________ 33 1.5. Chemometrics ______________________________________________________ 33 1.4.1 Background _____________________________________________________ 33 1.4.2 Multivariate analysis _____________________________________________ 34 1.4.2.1 Principal component analysis _____________________________________ 35 1.4.2.2 Partial least square _____________________________________________ 35 1.5 Analytical performance parameters______________________________________ 35 1.5.1 Precision, repeatability, reproducibility and intermediate precision ________ 36 1.5.2 Trueness and bias ________________________________________________ 37 1.6 Aims of the work ____________________________________________________ 38
2 Experimental ___________________________________________________________ 39
Page | 10
2.2 Sample preparation __________________________________________________ 39 2.3 Replicate analyses ___________________________________________________ 40 2.4 GC-MS instrument and analytical conditions _______________________________ 40 2.4.1 MS conditions ___________________________________________________ 41 2.5 Fatty acid identification and data treatment _______________________________ 41 2.6 Multivariate Analysis _________________________________________________ 41
3 Results and discussion from the Central South University _______________________ 42
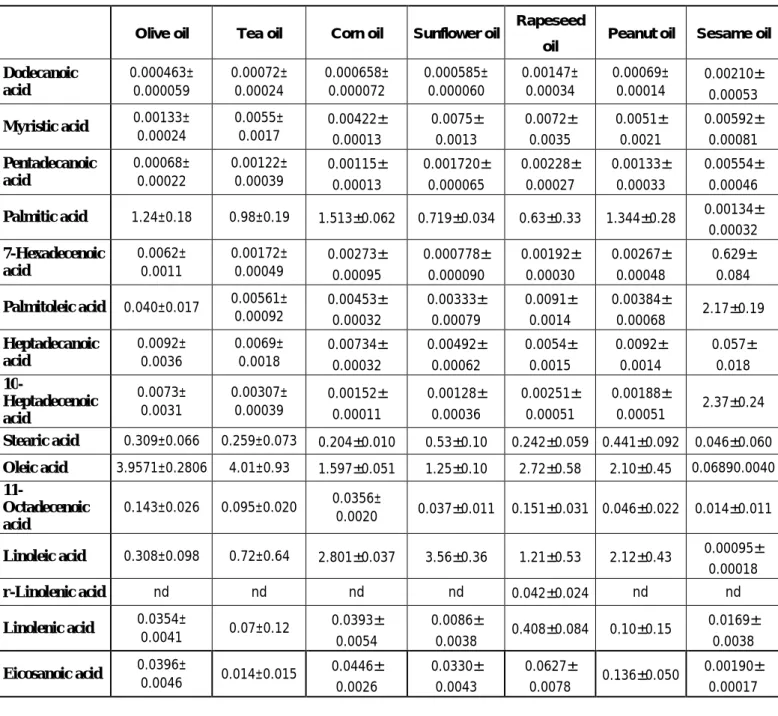
3.1 Fatty acid identification in the CSU ______________________________________ 42 3.2 European Olive oil ___________________________________________________ 43 3.3 European olive oil vs olive oil commercialized in China _______________________ 49 3.3.1 Preliminary considerations _________________________________________ 49 3.3.2 Chemometric analysis ____________________________________________ 50 3.4 Tea seed and olive oil _________________________________________________ 52 3.5 Analysis on all vegetable oils ___________________________________________ 56 3.5.1 Preliminary considerations _________________________________________ 56 3.5.2 Chemometric analyses on all vegetable oils ___________________________ 57 3.6 Analyses using only 12 selected fatty acids ________________________________ 58 3.6.1 European olive oil ________________________________________________ 59 3.6.2 European Vs China bought olive oil __________________________________ 62 3.6.3 Tea seed and olive oil _____________________________________________ 63 3.6.4 Analyses on all vegetable oils _______________________________________ 64 3.6.5 conclusions _____________________________________________________ 65 3.7 Intra laboratory validation of the method _________________________________ 66 3.7.1 General considerations ___________________________________________ 66 3.7.2 Olive oil samples _________________________________________________ 66 3.5.2 All oils from the first and second batch _______________________________ 68 3.8 Conclusions _________________________________________________________ 69
4 Results and discussion from the Hunan Agricultural Product Processing Institute ____ 71
4.1 Fatty acid identification in the HAPPI _____________________________________ 71 4.2 Inter laboratory validation of the method _________________________________ 72 4.2.1 Fatty acid identification in olive oil __________________________________ 72 4.2.2 Chemometric analysis of olive oil ____________________________________ 74 4.2.3 Chemometric analysis for all vegetable oils ____________________________ 75 4.3 Conclusions _________________________________________________________ 77
Page | 11 5 Results and discussion from the University of Algarve __________________________ 78
5.1 Fatty acid identification _______________________________________________ 78
6 Results and discussion without the use of an internal standard ___________________ 80
6.1 Choosing the best fatty acid to use as reference peak _______________________ 80 6.2 Results and discussion from the CSU’s laboratory ___________________________ 82 6.2.1 European Olive oil _______________________________________________ 82 6.2.2 European Vs Chinese bought olive oil ________________________________ 85 6.2.3 Tea seed Vs Olive oil ______________________________________________ 87 6.2.4 All vegetable oils_________________________________________________ 88 6.3 Results and discussion from HAPPI’s laboratory ____________________________ 89 6.3.1 Analyses on olive oil ______________________________________________ 89 6.3.2 Analyses on all vegetable oils _______________________________________ 90 6.4 Results and discussion for the comparison between the analyses performed at UAlg and CSU _________________________________________________________________ 91 6.5 Conclusions _________________________________________________________ 92
7 Conclusions ____________________________________________________________ 92 8 Bibliographic references __________________________________________________ 94 9 Annexes _______________________________________________________________ 97
Page | 12
Figure index
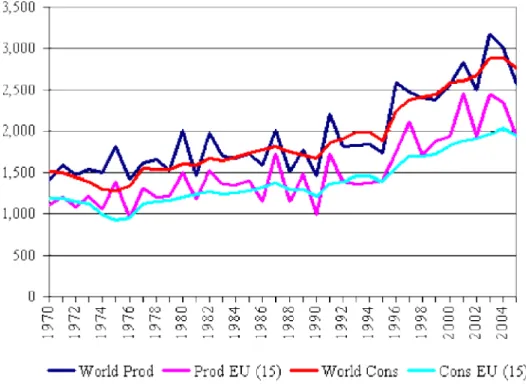
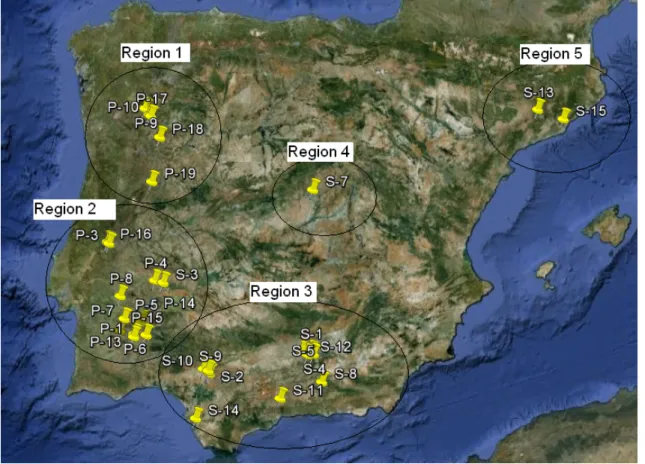
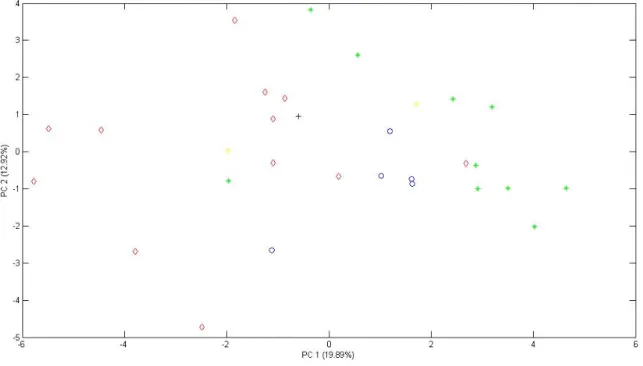
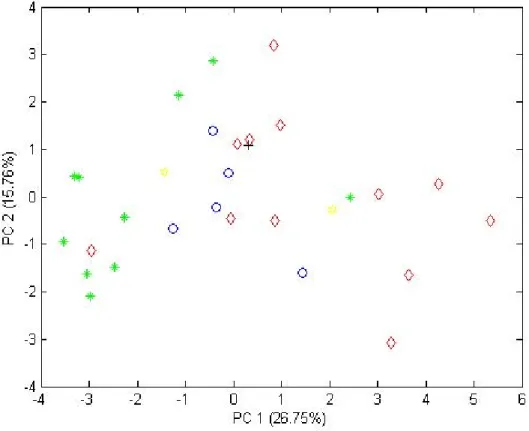
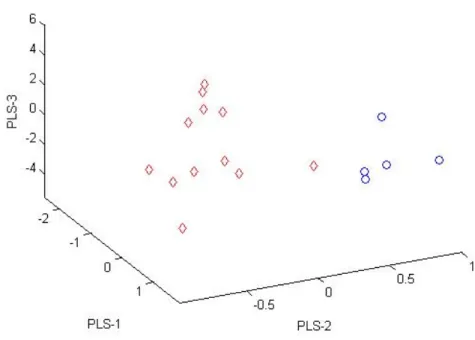
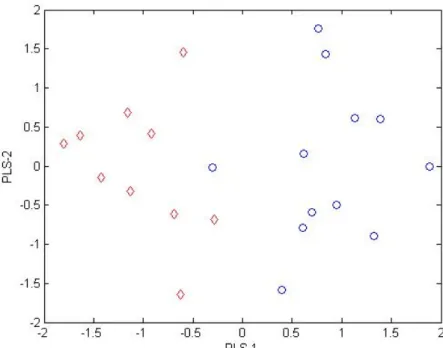
Figure 1. Evolution in the world’s production and consumption of olive oil.2 ______________ 18 Figure 2. World olive oil production (2008/2009).4 __________________________________ 19 Figure 3. Movements in average monthly producer prices for extra virgin olive oil.4________ 20 Figure 4. Oleic acid cis structure. ________________________________________________ 21 Figure 5. Schematic representation of a TAG structure. ______________________________ 27 Figure 6. Fisher projection of glycerol and triacylglycerol.6 ____________________________ 27 Figure 7. Block diagram of mass spectrometer.14 ___________________________________ 31 Figure 8. Schematic fatty acid esterification process. ________________________________ 32 Figure 9. Relationship between chemical measuring procedure and chemometrics.23 ______ 34 Figure 10. Comparison between precision and accuracy.33 ____________________________ 36 Figure 11. References commonly used to assess trueness in chemical measurements.34 ____ 37 Figure 12. Geographic distribution of the samples and separation of the regions. _________ 45 Figure 13. PCA scores plot of the European olive oil samples grouped by regions (region 1 – blue “o”; region 2 – red “◊”; region 3 – green “*”; region 4 – black “+”; region 5 – yellow “¤”). __________________________________________________________________________ 46 Figure 14. PLS-LDA scores plot of regions 1 (blue “o”) and 2 (red “◊”). __________________ 47 Figure 15. PLS-LDA model scores plot of regions 1 (blue “o”) and 3 (red “◊”). _____________ 48 Figure 16. PLS-LDA model scores plot of regions 2 (blue “o”) and 3 (red “◊”). _____________ 48 Figure 17. PCA scores plot of Portuguese olive oil (blue “o”), Spanish olive oil (red “◊”) and European olive oil bought in China (green “*”). ____________________________________ 50 Figure 18. PLS-LDA scores plot of European olive oils (blue “o”) Vs European olive oils bought in China (red “◊”).______________________________________________________________ 51 Figure 19. Typical GC-MS total ion chromatograms (TICs) of olive oil (A), and tea seed oil (B). Peaks’ identification: 1 = Dodecanoic acid, 2 = Myristic acid, 3 = Pentadecanoic acid, 4 = Palmitic acid, 5 = 7-Hexadecenoic acid, 6 = Palmitoleic acid, 7 = Heptadecanoic acid, 8 = 10-Heptadecenoic acid, 9 = stearic acid, 10 = oleic acid (Z)-,11 = 11-Octadecenoic acid, 12 =Linoleic acid, 13 = Linolenic acid, 14 = Eicosanoic acid, 15 = 11-Eicosenoic acid, 16 = Heneicosanoic acid, 17 = Docosanoic acid, 18 = Erucic acid, 19 = Tricosanoic acid, 20 = Tetracosanoic acid, IS = Internal Standard (tridecanoic acid). _____________________________________________ 53 Figure 20. PLS-LDA scores plot of olive oil (blue “o”) and tea seed oil (red “◊”). ___________ 55 Figure 21. PCA scores plot for all the oils, where Portuguese olive is “o”, Spanish olive oil “◊”, olive oil bought in China “*”, tea oil “+”, corn oil “¤”, sunflower oil “□”, rapeseed oil “◄”, peanut oil “►” and sesame oil “●”. ______________________________________________ 57 Figure 22. PCA scores plot of the European olive oil samples grouped by regions with 12 fatty acids (region 1 – blue “o”; region 2 – red “◊”; region 3 – green “*”; region 4 – black “+”; region 5 – yellow “¤”). ______________________________________________________________ 59 Figure 23. PLS-LDA scores plot of regions 1 (blue “o”) and 2 (red “◊”) for 12 fatty acids. ____ 60 Figure 24. PLS-LDA scores plot of regions 1 (blue “o”) and 3 (red “◊”) for 12 fatty acids. ____ 60 Figure 25. PLS-LDA scores plot of regions 2 (blue “o”) and 2 (red “◊”) for 12 fatty acids. ____ 61 Figure 26. PCA scores plot with 12 fatty acids of Portuguese olive oil (blue “o”), Spanish olive oil (red “◊”) and China bought olive oil (green “*”). _________________________________ 62
Page | 13
Figure 27. PLS-LDA scores plot of European olive oil (blue “o”) and European olive oil bought in China (red “◊”).______________________________________________________________ 63 Figure 28. PLS-LDA scores plot of olive oil (blue “o”) and tea seed oil (red “◊”). ___________ 64 Figure 29. PCA scores plot for all the oils, where Portuguese olive is “o”, Spanish olive oil “◊”, olive oil bought in China “*”, tea oil “+”, corn oil “¤”, sunflower oil “□”, rapeseed oil “◄”, peanut oil “►” and sesame oil “●”. ______________________________________________ 65 Figure 30. PCA scores plot comparison for the duplicate analysis on olive oil (a – 2nd batch and b – 1st batch), where Portuguese olive oil (blue “o”), Spanish olive oil (red “◊”) and European olive oil bought in China (green “*”). _____________________________________________ 66 Figure 31. PLS-LDA scores plot between the first batch (blue o) and the second batch (red ◊) of olive oils samples.____________________________________________________________ 67 Figure 32. PCA scores plot for all the oils from the second batch (a – 2nd batch, b – 1st batch), where Portuguese olive is “o”, Spanish olive oil “◊”, olive oil bought in China “*”, tea oil “+”, corn oil “¤”, sunflower oil “□” and rapeseed oil “◄”. ________________________________ 68 Figure 33. PCA scores plot for all the oils for both first (blue) and second (red) batches, where Portuguese olive is “o”, Spanish olive oil “◊”, olive oil bought in China “*”, tea oil “+”, corn oil “¤”, sunflower oil “□”, rapeseed oil “◄”, peanut oil “►” and sesame oil “●”. _____________ 69 Figure 34. Typical GC-MS single ion monitoring (SIM) chromatogram of an olive oil sample (P-10) performed in Hunan Agricultural Product Processing Institute. _____________________ 73 Figure 35. PCA scores plot for the olive oil samples analyzed at HAPPI’s laboratory, where Portuguese olive oil (blue “o”), Spanish olive oil (red “◊”) and European olive oil bought in China (green “*”). ____________________________________________________________ 75 Figure 36. PCA scores plot for all the oils analyzed in HAPPI, where Portuguese olive is “o”, Spanish olive oil “◊”, olive oil bought in China “*”, tea oil “+”, corn oil “¤”, sunflower oil “□”, rapeseed oil “◄”, peanut oil “►” and sesame oil “●”. _______________________________ 76 Figure 37. PCA scores plot for all the oils analyzed in CSU (blue) and HAPPI (green), using PCs obtained from the CSU model, where Portuguese olive is “o”, Spanish olive oil “◊”, olive oil bought in China “*”, tea oil “+”, corn oil “¤”, sunflower oil “□”, rapeseed oil “◄”, peanut oil “►” and sesame oil “●”._______________________________________________________ 77 Figure 38. Typical GC-MS total ion chromatogram (TIC) of olive oil (sample C9) from the
laboratory at UAlg. ___________________________________________________________ 78 Figure 39. Chromatogram representation of every used type of oil, identifying the internal standard and palmitic acid, where A: olive oil, B: corn oil, C: rapeseed oil, D: sunflower oil, E: tea oil, F: peanut oil, G: sesame oil. ______________________________________________ 81 Figure 40. PCA scores plot of the European olive oil samples grouped by regions with Palmitic acid as reference peak (region 1 – “o”; region 2 – ”◊”; region 3 – “*”; region 4 – ”+”; region 5 – “¤”). ______________________________________________________________________ 82 Figure 41. PLS-LDA scores plot of regions 1 (blue “o”) and 2 (red “◊”) with Palmitic acid as reference peak. _____________________________________________________________ 83 Figure 42. PLS-LDA scores plot of region 1 (blue “o”) and 3 (red “◊”), with Palmitic acid as reference peak. _____________________________________________________________ 83 Figure 43. PLS-LDA scores plot of regions 2 (blue “o”) and 3 (red “◊”), with Palmitica acid as reference peak. _____________________________________________________________ 84
Page | 14
Figure 44. PCA scores plot of Portuguese olive oil (blue “o”), Spanish olive oil (red “◊”) and European olive oil bought in China (green “*”), where A: using Palmitica acid as internal
standard and B: Tridecanoic acid as internal standard. _______________________________ 85 Figure 45. PLS-LDA scores plot of European olive oil (blue “o”) and European olive oil bought in China (red “◊”), whith the use of Palmitic acid as internal standard. ____________________ 86 Figure 46. PLS-LDA scores plot of olive (blue “o”) and tea seed (red “◊”) oils with Palmitic acid as reference peak. ___________________________________________________________ 87 Figure 47. PCA scores plot for all the oils with Palmitic acid as reference peak, where
Portuguese olive is o, Spanish olive oil ◊, olive oil bought in China *, tea oil +, corn oil ¤,
sunflower oil □, rapeseed oil ◄, peanut oil ► and sesame oil ●. ______________________ 88 Figure 48. PCA scores plot for the olive oil samples analyzed at HAPPI’s laboratory with Palmitic acid as reference peak, where Portuguese olive oil (blue “o”), Spanish olive oil (red “◊”) and European olive oil bought in China (green “*”). ____________________________________ 89 Figure 49. PCA scores plot for all the oils analyzed in HAPPI using Palmitic acid as reference peak, where Portuguese olive is “o”, Spanish olive oil “◊”, olive oil bought in China “*”, tea oil “+”, corn oil “¤”, sunflower oil “□”, rapeseed oil “◄”, peanut oil “►” and sesame oil “●”. ___ 90 Figure 50. PCA scores plot for olive oils analyzed at CSU (Portuguese olive, blue “o”; Spanish olive oil, red “◊”; olive oil bought in China, green “*”) and UAlg (Olive oil bought in China, yellow “►”). ________________________________________________________________ 91
Page | 15
Table index
Table 1. List of the main saturated fatty acids and their typical sources.5 _________________ 23 Table 2. List of the main monounsaturated fatty acids and their typical sources.5 ___________ 24 Table 3. Most important n-3 PUFAs.5 _____________________________________________ 24 Table 4. Most important n-6 PUFAs.5 _____________________________________________ 25 Table 5. Fatty acid content of major oils and fats (values in wt%).6 _____________________ 26 Table 6. Number of TAGs in fat containing x different fatty acids.7______________________ 28 Table 7. Fatty acid identification from the different tested oils in CSU, represented as relative fatty acid value (fatty acid peak area/internal standard area) ± standard deviation. ________ 42 Table 8. Identification of the different olive oil samples. _____________________________ 44 Table 9. Classification results between regions one, two and three by PLS-LDA method. ____ 49 Table 10. Origin and type of olive oil samples purchased in China. ______________________ 49 Table 11. Relative fatty acid values (fatty acid peak area/internal standard area) of olive and tea seed oil, indicating the fatty acids with significant difference between the two oils by T-test._______________________________________________________________________ 53 Table 12. Classification results between some of the regions by PLS-LDA method, using 12 fatty acids. ______________________________________________________________________ 61 Table 13. Fatty acid identification from the different tested oils in HAPPI, represented as relative fatty acid value (fatty acid peak area/internal standard area) ± standard deviation. _ 71 Table 14. Fatty acids identified in the two different laboratories for olive oil samples. ______ 73 Table 15. Fatty acid identification in olive oil for the three different laboratories, CSU, HAPPI and Ualg.___________________________________________________________________ 79 Table 16. Classification results between three of the regions by PLS-LDA method. _________ 84 Table 17. Classification results between European olive oil and China bought olive oil by PLS-LDA method, both Tridecanoic acid as internal standard and Palmitic acid as reference peak. 87
Page | 16
List of abbreviations
CRM – Certified reference material
CSU – Central South University
DAG – Diacylglycerol
EVOO – Extra virgin olive oil
FFA – Free fatty acid
GC – Gas chromatography
HAPPI – Hunan Agricultural Product Processing Institute
HPOO – Home production olive oil
ICS – International Chemometrics Society
IR – Infrared spectroscopy
IUPAC – International Union of Pure and Applied Chemistry
LC – Liquid chromatography
MUFA – Monounsaturated fatty acid
MS – Mass spectrometry
m/z – Mass-to-charge ratio
NMR – Nuclear magnetic resonance spectroscopy
PUFA – Polyunsaturated fatty acid
PC – Principal component
PCA – Principal component analysis
PLS – Partial least squares
Page | 17
SIM – Single-ion monitoring
SFA – Saturated fatty acid
TAG – Triacylglycerol
TIC – Total ion current
UAlg – University of Algarve
UFA – Unsaturated fatty acid
UV-vis – Ultraviolet and visible
Page | 18
1
Introduction
1.2.
Olive oil background
Olive groves are a culture with deep roots implemented in the European Continent, mainly in the Mediterranean region. From ancient times that olive oil plays an important role in the Mediterranean diet, being abundantly used in the preparation of almost all the traditional dishes in this region. The most important components in olive oil are the fatty acids, and their proportion with each other will strongly influence the characteristics and nutritive value of the oil. Being known for its health benefits, among others working as a cancer prevention due to its high amounts of phenolic antioxidants and squaline,1 olive oil has also a great importance in the economic sector of the Mediterranean countries.
1.2.1.
Economic weight
From the middle of the 90s a world expansion of the olive oil sector has been observed, both in the production and consumption sector (Figure 1), being the Mediterranean Basin responsible for more than 90% of this world production.
Page | 19
According to Figure 2, it can be seen that Spain is by far the biggest world olive oil producer, being alone responsible for more than 40% of the word production (08/09 crop year), followed by Italy (with 19,5%) and Greece (12,9%). Portuguese olive oil represents about 2% of the world’s production.3
Figure 2. World olive oil production (2008/2009).4
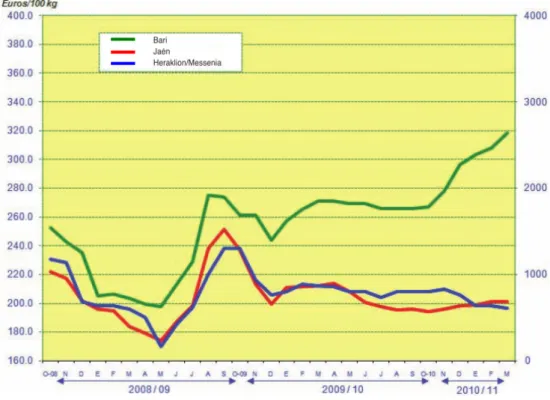
By the amount of olive oil produced in the Mediterranean region, one can easily deduce that that this product represents a strong pillar in the economy of these countries. It is also the three main producing countries who possess the key markets of the EU, Jaén (Spain), Bari (Italy) and Heraklion/Messenia (Greece). The prices paid to producers of extra virgin olive oil on these markets (Figure 3) affect roughly 73% of the olive oil produced in the world, having also an impact on the prices paid in the other producing countries, particularly on exporting prices.
The world commercial flows (imports and exports) usually present themselves quite balanced, indicating that this sector does not generate surplus. From the non producing countries there are several countries, such as USA, Japan, Canada, Australia and Brazil, who have been registering a positive evolution in the consumption of olive oil, making
Page | 20
them a target market of high interest. As emerging markets it can also be highlighted countries like China, Russia and South Korea.4
Figure 3. Movements in average monthly producer prices for extra virgin olive oil.4
As the olive oils has such a huge impact in the Mediterranean countries economy, also other kinds of vegetable oils possesses similar roles in other regions, such as the tea seed oil in some of the southern provinces of China, such as Hunan (roughly one-seventh of the country's population).
Tea seed oil is a high quality edible oil obtained by squeezing mature seeds of Camellia oleifera and Camellia sinensis. Its fatty acid composition (Palmitic (C16:0), Stearic (C18:0), Oleic (C18:1) and Linoleic (C18:2)) is comparable to olive oil, as well as its high oleic acid content, low saturated fat, high antioxidants and excellent storage qualities, being even known around the world as “oriental olive oil”.
Page | 21
1.3.
Edible fats and oils
Edible fats consist on a complex mixture that contains a wide range of compounds, being some of them essential for human’s health and regularly present in a healthy diet. Dietary fats include all the lipids in plants and animal tissues that are ingested as food, and they may be either solid or liquid at normal room temperature, being usually called oils when they are liquid and fats when they are solid. These fats and oils are mainly composed by triacylglycerols (TAGs), diacylglycerols (DAGs), free fatty acids (FFAs), phospholipids and other minor compounds. All fats are derivatives of fatty acids and glycerol, being the TAGs and DAGs made up of fatty acids molecules, two and three, respectively, esterified to a glycerol backbone. Fatty acids constitute then the major component of TAGs and DAGs, and specially the first ones are required in human nutrition as a source of energy and for metabolic and structural activities.
1.3.1.
Nomenclature of fatty acids
There are several systems of nomenclature for fatty acids, but the most complete and unambiguous is the systematic nomenclature recommended by the International Union of Pure and Applied Chemistry (IUPAC). As an example, let us take the oleic acid, which has the following structure (Figure 4):
Figure 4. Oleic acid cis structure.
The commonly named oleic acid, in systematic nomenclature is the “cis-9-octadecenoic acid”.
Page | 22
Although the IUPAC nomenclature is precise and clear, the names are long and not practical, therefore trivial names and abbreviations are frequently used. There are several abbreviated notations for dietary fatty acids and all of them adopt the C:D form, where C is the number of carbon atoms and D the number of double bonds in the carbon chain. A very often used abbreviated nomenclature for naturally occurring cis unsaturated fatty acids is the “n minus” system. This term refers to the position of the double bond closest to the methyl end of the carbon chain. In this nomenclature the “cis-9-octadecenoic acid” would be abbreviated to “18:1n-9”, since it has his double bound located at the 9th carbon counting from the methyl end.
Another widely used abbreviated system applicable to a large number of fatty acids is the delta system, which classifies according to the number of carbon atoms between the carboxyl group and its nearest double bond, specifying the position of the double bond as well as the cis/trans configuration. With this system “cis-9-octadecenoic acid” would be abbreviated to “cis-Δ9-18:1”, but in order to simplify the notation the “Δ” can be dropped being just “9c-18:1”.5 In this work, whenever it is appropriate, each one of these different notation may be used.
1.3.1.1. Saturated fatty acids (SFAs)
Characterized by having only single bounds on their carbon chains, the SFAs have the general formula of R-COOH. They are further classified according to their chain length: short, medium, long and very long:
Short-chain fatty acids: From 3-7 carbon atoms; Medium-chain fatty acids: From 8-13 carbon atoms; Long-chain fatty acids: From 14-20 carbon atoms;
Very-long-chain fatty acids: From 21-above carbon atoms.
A list of some of the most common dietary SFAs, which are mainly provided by animals, is shown below (Table 1). Appreciable levels of SFAs are also present in some tropical oils, especially in palm oil and coconut oil.5
Page | 23
Table 1. List of the main saturated fatty acids and their typical sources.5
Trivial name Systematic name Abbreviation Typical source Butyric Butanoic C4:0 Dairy fat
Cproic Hexanoic C6:0 Dairy fat
Caprylic Octanoic C8:0 Dairy fat, coconut and palm kernel oils
Capric Decanoic C10:0 Dairy fat, coconut and palm kernel oils
Lauric Dodecanoic C12:0 Coconut oil, palm kernel oil
Myristic Tetradecanoic C14:0 Dairy fat, coconut and palm kernel oils
Palmitic Hexadecanoic C16:0 Most fats and oils
Stearic Octadecanoic C18:0 Most fats and oils
Arachidic Eicosanoic C20:0 Peanut oil
Behenic Docosanoic C22:0 Peanut oil
Lignoceric Tetracosanoic C24:0 Peanut oil
1.3.1.2. Unsaturated fatty acids (UFAs)
Characterized by having one (monounsaturated fatty acid, MUFAs) or more several (polyunsaturated fatty acids, PUFAs) double bounds in their carbon chain. The UFAs are further classified into three groups, according to their carbon chain length:
Short-chain unsaturated fatty acid: From 19-below carbon atoms; Long-chain unsaturated fatty acid: From 20-24 carbon atoms;
Very-long-chain unsaturated fatty acids: From 25-above carbon atoms.
1.3.1.3. Monounsaturated fatty acids
Oleic acid is the most common MUFA that occurs in nature and it is present in considerable quantities in both animal and plant sources (Table 2).5
Page | 24
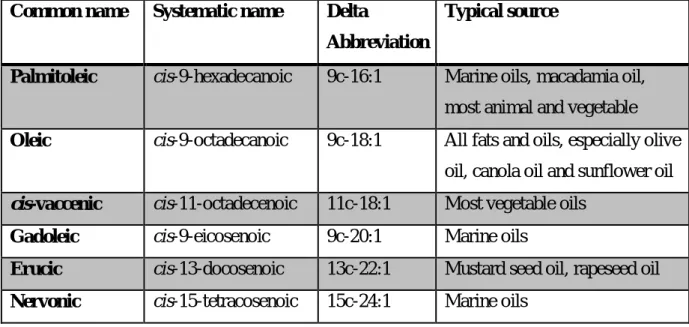
Table 2.List of the main monounsaturated fatty acids and their typical sources.5
Common name Systematic name Delta
Abbreviation
Typical source
Palmitoleic cis-9-hexadecanoic 9c-16:1 Marine oils, macadamia oil, most animal and vegetable
Oleic cis-9-octadecanoic 9c-18:1 All fats and oils, especially olive oil, canola oil and sunflower oil
cis-vaccenic cis-11-octadecenoic 11c-18:1 Most vegetable oils
Gadoleic cis-9-eicosenoic 9c-20:1 Marine oils
Erucic cis-13-docosenoic 13c-22:1 Mustard seed oil, rapeseed oil
Nervonic cis-15-tetracosenoic 15c-24:1 Marine oils
1.3.1.4. Polyunsaturated fatty acids
These fatty acids have 2 or more cis double bonds that are separated from each other by a single methylene group. These methylene-interrupted double bonded cis configured fatty acids can be split into 12 families, ranging from double bonds located at the n-1 position to the n-12 position, being the most important in terms of human health and nutrition the n-3 and n-6 families (Table 3 and 4)
Table 3. Most important n-3 PUFAs.5
Common name Systematic name N minus Abbreviation
Typical source
α-linolenic
cis-9,cis-12,cis-15-octadecatrienoic
18:3n-3 Flaxseed oil, canola oil, soybean oil
Stearidonic
cis-6,cis-9,cis-12,cis-15-octadecatetraenoic
18:4n-3 Fish oil, blackcurrant seed oil, hemp oil
Eicosapentaenoic cis-5,cis-8,cis-11,cis-14,cis-17-eicosapentaenoic 20:5n-3 Fish oil Docosapentaenoic cis-7,cis-10,cis-13,cis- 16,cis-16-22:5n-3 Fish oil
Page | 25 docosapentaenoic Docosahexaenoic cis-4,cis-7,cis-10,cis- 13,cis-16,cis-19-docosahexaenoic 22:6n-3 Fish oil
Table 4.Most important n-6 PUFAs.5
Common name Systematic name N minus Abbreviation
Typical source
Linoleic
cis-9,cis-12-octadecadienoic
18:2n-6 Most vegetable oils
γ-linolenic
cis-6,cis-9,cis-12-octadecatrienoic
18:3n-6 Borage and
blackcurrant seed oils
Dihomo-γ-linolenic cis-8,cis-11,cis-14-eicosatrienoic 20:3n-6 Animal tissues Arachidonic cis-5,cis-8,cis-11,cis-14-eicosatetraenoic
20:4n-6 Animal fats, liver, egg lipids and fish
Docosatetraenoic cis-7,cis-10,cis-13,cis-16-docosapentaenoic 22:4n-6 Animal tissues Docosapentaenoic cis-4,cis-7,cis-10,cis-13,cis-16-docosapentaenoic 22:5n-6 Animal tissues
1.3.2.
Fatty acids
Fatty acids are carboxylic acids with a log chain that can be either saturated or unsaturated. The broadest definition of fatty acids includes their carbon chain length, which in the most commonly natural occurring fatty acids vary between C4 and C22. The chain is built from groups of two carbon units, and double bonds may occur at specific positions relative to the carboxyl group. This results in even-chain-length fatty acids with a characteristic pattern of methylene interrupted double bonds, originating a wide number of fatty acids varying in their chain length and unsaturation.
More than 1000 fatty acids are know, but only less than 20 are encountered in significant levels in fats and oils that justify commercial importance. The most common
Page | 26
fatty acids are the C16 and C18 and, generally, below this chain length range they are characterized as short or medium chain and above as long chain-fatty acids. The fatty acid composition of the most widely traded oils and fats can be seen in the next table (Table 5).
Table 5. Fatty acid content of major oils and fats (values in wt%).6
16:0 18:1 18:2 18:3 Other
Butter
28 14 1 1 4:0 (9), 6:0-12:0 (18), 14:0 (14) +odd chain and trans
Coconut
9 6 2 - 8:0 (8), 10:0 (7), 12:0 (48), 14:0 (18)Corn
13 31 52 1Cottonseed
24 19 53 -Fish*
14 12 1 - 16:1n-7 (12), 20:1n-9 (12), 22:1n-11 (11), 20:5n-3 (7), 22:6n-3 (7)Peanut
13 37 41 - C20-C24 (7)Linseed
6 17 14 60Olive
10 78 7 -Palm
44 40 10 -Sesame
9 38 45 - 18:0 (6)Soybean
11 22 53 8Sunflower
6 18 69 - 18:0 (6)* Cod fish liver oil
Most plant oils contain the C18 fatty acids in higher amounts, while animal fats have a wider range of chain length.
Fatty acids may also be grouped based on the number of double bonds, where they can be SFAs, MUFAs or PUFAs. The double bonds of naturally occurring UFAs are very often to be with cis orientation, which means that the hydrogen atoms attached to the
Page | 27
double bound are on the same side. If the hydrogen atoms are on opposite sides, the configuration term is trans.
1.3.3.
Triacylglycerides
Fatty acids in oils and fats are found mainly esterified to glycerol. TAGs are the most important group of compounds present in dietary oils (from 95 to 98%); this group of compound is composed by trihydric alcohols (backbone) esterified with three fatty acids (Figure 5).
Figure 5. Schematic representation of a TAG structure.
Glycerol is a prochiral molecule, having a plane of symmetry, but if the primary hydroxyls are esterified to different groups, the resulting molecule is chiral and exists as two enantiomers. In Fisher projection of glycerol (Figure 6) the carbon atoms are numbered from 1 to 3 and the prefix sn- (for stereospecific numbering) denotes a particular enantiomer.6
Page | 28
The molecular structure of each TAG species can be described by the following attributes:
The total carbon number, which is the sum of the alkyl chain length of each of the three fatty acids;
The degree of unsaturation in each fatty acid;
The position and configuration (cis/trans) of the double bonds in each fatty acid.
Moreover, each TAG species may have and may be differentiated by its isomers according to the exact position of the three fatty acids on the glycerol backbone.7
Due to the vast number of fatty acids and the different combinations they may do on the backbone of the TAGs, the analysis of the TAG composition in oils or fats is always quite a challenging task. As an example, a simple seed oil composed by five different fatty acids may give 125 distinct TAG molecules (Table 6).
Table 6. Number of TAGs in fat containing x different fatty acids.7
Most natural TAGs don’t possess a random distribution of fatty acids on their glycerol backbone. In plant oils, unsaturated acids predominate at the sn-2 position, whit more saturated ones at sn-1 and sn-3. For the positions sm-1 and sn-3, the distribution of fatty acids is often similar, though not identical. In animal fats, the type of fatty acids predominant at the sn-2 position is more variable.6
Page | 29
Only oils that are rich in one specific fatty acid may contain a high amount of monoacid TAGs, such as the olive oil with oleic acid (C18:1) and sunflower with linoleic acid (C18:2).
1.4.
Vegetable oils characterization
1.4.1.
Background
Vegetable oils are made up of a complex mixture of compounds, where fatty acids in the form of di- and triglycerides are the main components. A series of minor polar compounds are also present in these oils, and their distribution is characteristic of different plant species from which they were obtained. Moreover, in the same species, the abundance and composition of fatty acids and these minor compounds may vary, depending on the agronomic and climatic conditions.
The composition of theses oils and their characteristic health benefits will depend on the vegetable, seed or nut from which they were extracted. Olive oil is one of the most expensive vegetable oils, and perhaps the most associated to health benefic properties, and therefore frequently adulterated with lower priced oils.8 To be sure about the authenticity of quality edible oils is of great importance both from the commercial value and health impact point of view. The organoleptic properties, high nutritional value and health benefits of quality oils are related to their intrinsic composition, including their unique fatty acid distribution, being the study of the fatty acid composition of the different vegetable oils a good way to characterize them.
Many analytical methods have been proposed to establish the authenticity of vegetable oils and to detect the occasional adulteration level. UV spectrophotometry,9 Raman spectroscopy 10 and IR spectrometry 11 have been widely used for edible vegetable oil analysis. However, these techniques have limitations working as detection methods, since the spectral differences of most vegetable oils, which contain the same FAs (mainly C16 or C18 and their TAGs, C50, C52, C54), are quite small. But since each vegetable oil possesses its own characteristic fatty acid composition, determining the fatty acid “fingerprint” by chromatographic methods provides quite some useful information regarding authenticity and possible adulteration of vegetable oils. Usually, fatty acid determination is carried out by liquid chromatography (LC) or gas
Page | 30
chromatography (GC), since these techniques, combined with mass spectrometry (MS), are the key techniques for lipid analysis, being GC nowadays extensively used for the compositional determination of fatty acids.12
1.4.2.
Principles of chromatography
Chromatography is an extremely versatile technique for the analytical laboratories. It performs the separation of two sample components based on their different distribution between the stationary phase and the mobile phase. The stationary phase, a liquid or solid, is fixed in the system, while the mobile one, a fluid (a gas in GC and a liquid in LC), is streaming through the chromatographic system.13 While the mechanisms of retention for various types of chromatography differ, all of them are based on the equilibrium between the analyte and both the stationary and the mobile phase. The distribution equilibrium of the eluting compounds through the phases is described by the distribution function:
=
[ ][ ]
Where [X]s is the concentration of the component X in the stationary phase at
equilibrium, and [X]m the concentration in the mobile phase. So, solutes with a large Km
value will be retained more strongly by the stationary phase than those with a small value.14
1.4.3.
Gas chromatography
In GC, the sample, usually in liquid state, is converted into vapor, being this way in the same physical state as the eluent used to carry it through the system. The stationary phase is usually a nonvolatile liquid supported on an inlet solid. The injection port, column and detector are heated to a temperature at which the sample has a vapor pressure of at least 10 torr, being the injection port and detector usually kept warmer than the column in order to promote a rapid vaporization of the injected sample, and prevent sample condensation in the detector.
Page | 31
The sample is automatically detected as it emerges from the column. By measuring the retention time and comparing this time with the one from a pure substance standard, it may be possible to identify the peak. The area under the peak is proportional to the concentration, and so the quantitative analysis may be performed.
When complex mixtures are applied, it is not a simple task to identify the many peaks present in the mixture. So, when dealing with complex mixtures, special detectors such as mass spectrometry may be applied to aid peaks’ identification.14
1.4.4.
Gas chromatography – mass spectrometry
Mass spectrometry is a sophisticated instrumental technique that produces, separates, and detects ions in a gas phase sample, being its basic components shown in the Figure
7. A sample with a moderate high vapor pressure is introduced in an inlet system,
operated under vacuum and high temperature. It vaporizes and is carried to the ionization source,
Figure 7. Block diagram of mass spectrometer.14
where analyte molecules, which are typically neutral, are ionized usually by high-energy electron bombardment, producing a positive ion called the molecular ion. The molecular ions are produced in different energy states and the internal energy is dissipated by fragmentation reactions, producing fragments of lower mass, which are themselves ionized or converted to ions by further ion bombardment. The ions are separated in the spectrometer by being accelerated through a mass separator. Separation is actually based on the mass-to-charge ratios (m/z) of the ions. The separated ions are then detected by means of an electron multiplier.14
Page | 32
Hyphenated instrumentation, which is the name given to the technology that uses two or more quantitative measurement devices simultaneously, such as GC coupled with MS, became widely recognized in the 60’s as the most sensitive and versatile available technique capable of identifying volatile organic compounds. But it was only later, with the development of selected ion monitoring techniques, that the true potential of GC-MS for quantitative analysis was generally appreciated.
Not only can a GC-MS separate the volatile components of complex mixtures as also records the mass spectrum of each component. This instrument may provide two separate dimensions of information about the analytes, CG the retention time, which is related to specific chemical properties of the analyte (volatility, polarity, functional groups etc.), and MS the molecular weight, which is indicative of the atomic composition.
Despite of the great potential of this technique, it also possesses some serious limitation, such as: for a compound to be analyzed by GC-MS it must have sufficient volatility and thermostability to pass through the gas chromatographic column intact in the vapor state, or to be capable of conversion to a derivative which can do so. This requirement prohibits the analysis for most of the known organic compounds by this technique.15
Due to the relatively high boiling point of acids, the separation of fatty acids by this technique has been limited. So in order to carry the analysis on these compounds an additional step must be added to the procedure, the esterification of the fatty acids (Figure 8).
Figure 8. Schematic fatty acid esterification process.
The esterification of the fatty acids, where the ester bonds are hydrolyzed and the free fatty acids that are formed in the process are converted into the corresponding FAME, will make the CG-MS analysis possible, since FAMEs are moderately apolar and sufficiently volatile.
Page | 33
1.4.5.
Fingerprinting
Fingerprinting technology is a highly sensitive and accurate detection method, which refers to the spectrum or image generated by certain analytical equipments. Fingerprinting classifies into three categories: electrophoresis fingerprinting, spectral fingerprinting and chromatographic fingerprinting.
Nuclear magnetic resonance spectroscopy (NMR),16 infrared spectroscopy (IR),17 ultraviolet and visible spectroscopy (UV-vis) 18 and MS 19 consist in the four main techniques of spectrum fingerprinting in organic analyses, and both GC 20 and LC 21 represent the main chromatographic ones.
MS spectrometry fingerprinting is a method from the spectral fingerprinting category, which is able to determine sample ions according to their m/z. First, the sample must be ionized, then the ions are separated when they pass through the electric and magnetic field, and finally the mass spectrometry of samples is obtained, allowing this way to obtain both qualitative and quantitative results. Organic MS is mainly used in food testing, and it is usually in tandem with GC or LC.22 In this work since the separation is made by GC, the introduction of MS fingerprinting will have the chromatography fingerprinting incorporated. This technique has been previously applied for the analysis of vegetable edible oils 8, 19 with quite successful results.
1.5.
Chemometrics
1.4.1
Background
The term chemometrics was firstly introduced in the early 70s by Svante Wold, who also established the International Chemometrics Society (ICS), and since then chemometrics has been developing, being nowadays widely applied to different fields of chemistry, especially analytical chemistry.
According to the ICS, chemometrics can be defined as “a new chemical discipline that uses the theory and methods from mathematics, statistics, computer science and other related disciplines to optimize the procedure of chemical measurement, and to extract chemical information as much as possible from chemical data”.23
Page | 34
Figure 9. Relationship between chemical measuring procedure and chemometrics.23
Figure 9 shows a schematic representation of the close relationship between
chemometrics and chemical measuring procedure, showing that at every step in the chemical measuring procedure, chemometrics can also provide some methodology for solving the problems in the procedure.23
1.4.2
Multivariate analysis
Hyphenated chromatographic systems, such as GC-MS and HPLC-MS, are extensively used to obtain detailed qualitative and quantitative information about the analyzed samples. With their high sensitivity, low limit of detection, possibility of analyzing a great number of analytes and identifying them with spectral dimension, makes hyphenated chromatographic systems a very strong analytical technique.
With the increasing amount and complexity of data obtained by modern hyphenated chromatographic instruments (multidimensional data), also more powerful data-processing techniques must be applied, so that we can extract useful information from this rich amount of data. In order to do so, multivariate data analysis is often applied.
The term multivariate analysis is used to describe analysis of data where numerous observations or variables are obtained for each individual or unit studied.24 There is an advantage in this type of analysis over those that only construct a separator of the different categories, since multivariate analysis associates an n-dimensional bounded region to each category, they allow the extraction of hidden information and the characterization of redundant information source that often totally masks the relevant information contained in the chemical composition.25
Page | 35
Multivariate analysis may be divided into three main groups, description, classification and prediction, with distinct purposes from each other. In the present work, emphasis is given to both principal component analysis (PCA) and partial least squares (PLS) for classification and prediction analysis, respectively.
1.4.2.1 Principal component analysis
PCA is used with the aim of simplifying the description of a set of interrelated variables. This technique can be summarized as a method of transforming the original variables into new variables, uncorrelated ones. These new variables are called the principal components (PCs). Each PC is a linear combination of the original variables. PCs are arranged in order of decrease variance, being the first PC the major axis of the points in the n-dimensional space that possesses most of the information, the second PC, perpendicular to the first one, the second most informative, and so on.24
PCA is a well-documented multivariate method in the data analysis of edible vegetable oils obtained by only chromatographic methods (GC/LC) 25, 26, 27 or in tandem with mass spectrometry (GC-MS).28
1.4.2.2 Partial least square
PLS regression is a multivariate method that combines features from PCA and multiple linear regression. Its goal is to predict a set of dependent variables from a set of independent variables (predictors). This prediction is achieved by extracting from the predictors a set of orthogonal factors called latent variables, which have the best predictive power.29
The use of PLS methods has also been reported for data analysis with experimental data acquired by the means of a GC-MS equipment.30
1.5
Analytical performance parameters
The validation of a method consists in the investigation whether the analytical process of the method is achieved, which is obtaining analytical results with an acceptable
Page | 36
uncertainty level.31 In practice, method validation is done by evaluating a series of method performance parameters, such as precision, trueness, linearity and sensitivity, among others.
There are several factors that can affect the ability of a measurement system to discriminate among the units it measures. These factors can be categorized generally into those that affect central location and those that affect the variability (spread) of the measurement. The variability factors are measured by repeatability and reproducibility (referring to the precision of a measuring method), while the ones related to the central location of the measurement by bias, stability and linearity (referring to the accuracy of a measurement system).32
Figure 10. Comparison between precision and accuracy.33
As Figure 10 clearly illustrates, being the target point at the center of each circle, for the case A it can be seen that both accuracy and precision are quite low, increasing the precision of the method in case B, but still with bad accuracy, and in case C both precision and accuracy can be noticed as high.
1.5.1
Precision, repeatability, reproducibility and intermediate
precision
As exemplified above, precision is a term that describes an instrument’s lack of random errors, being measured by repeatability and reproducibility.
The terms repeatability and reproducibility mean approximately the same, but they are applied in different contexts. Repeatability describes the closeness of output readings
Page | 37
when the same input is applied repetitively over a short period of time, with the same measurement conditions, instrument and observer, in the same location and conditions of use maintained throughout. Reproducibility describes the closeness of output readings for the same input when there are changes in the method of measurement, observer, measuring instrument, location, conditions of use and time of measurement. So, the spread in the measurements are referred to as repeatability if the measurement conditions are constant and reproducibility if they vary.33
Intermediate precision expresses “within laboratory” variations; this means that it is considered when the repeatability criteria are not fully met.
1.5.2
Trueness and bias
Bias may be defined as the difference between the mean value determined for the analyte of interest and the accepted true value.31 Trueness is defined as “the closeness of agreement between the average value obtained from a large set of tests results and an accepted reference value”, according to ISO 3534, and is evaluated in terms of bias through the analysis of reference samples. Since not all the references have the same level of traceability, the selected reference should be the one that has the suitable level of traceability for the purpose of the analysis.34
Figure 11. References commonly used to assess trueness in chemical measurements.34
The references commonly used in chemical analysis are listed in the figure scheme above (Figure 11), ordered according to their level of traceability.
Page | 38
1.6
Aims of the work
The main objectives presented with this work are:
To check for patterns in olive oil samples from different regions of the Iberian Peninsula through their fatty acid composition by GC-MS fingerprinting technique coupled with PCA and PLS chemometric methods, and also between European olive oil and Chinese tea seed oil.
To validate the used fingerprinting method for the fatty acid composition analysis of vegetable edible oils through its both inter- and intra-laboratorial comparisons coupled with PCA and PLS analysis.
Page | 39
2
Experimental
2.1
Samples and reagents
34 olive oil samples (19 from Portugal and 15 from Spain) were brought from Europe, while 15 more imported European olive oil samples were bought in China (8 from Spain, 4 from Greece and 3 more from Italy). The samples brought from Portugal were all purchased in local supermarkets and transferred from the original bottle to dark glass 50 mL flasks in such a way that the least possible air was left inside. The samples from Spain were provided by the University of Cadiz. All these samples were transported by plain from UAlg to the CSU.
Apart of olive oil, some local edible vegetable oils, such as tea seed oil (47 samples), rapeseed oil (11 samples), sesame oil (11 samples) corn oil (6 samples), sunflower oil (3 samples), and peanut oil (3 samples), were purchased from local supermarkets.
A 37-component FAME mix and the methyl tridecanoate internal standard solution were purchased from Sigma-Aldrich (Shanghai) Trading Co., Ltd. The solution of 0.4 M NaOH/CH3OH was freshly prepared in the laboratory by dissolving a reagent grade NaOH in methanol.
2.2
Sample preparation
For the analyses in both CSU and HAPPI, aliquots (50 µL) of sample were spiked with internal standard working solution (50 µL C13:0 methyl ester,100 g/L). 1 mL 0.4 M of NaOH-CH3OH was added and reacted for about 10 min in an ultrasonic bath. After the solution turned clear and transparent the methyl esters were extracted with 1 mL of hexane twice and diluted to a final volume of 2 mL.
For the analysis in the UAlg, fatty acids were converted to the corresponding FAME according to a modified protocol of Pereira, H. et al.35 where 50 µL of oil were measured and treated with 1.5 mL of derivatization solution (methanol/acetyl chloride, 20:1, v/v) in reaction vessels. The oil was disrupted with an IKA Ultra-Turrax disperser and then 1 mL of hexane was added and the mixture heated for 1 hour at 90 °C. Afterwords, samples were cool down in an ice bath and were then transferred into centrifuge tubes, 1 mL of distilled water and 3 mL of hexane were added and vortex for
Page | 40
1 min. Samples were then centrifuged at 1000 g for 5 min at 4ºC. The organic phase was then removed with a micropipette to new flasks. This process was repeted 3 more times. Samples were then filtered with 45 µm pore to chromatographic vials and dried with a nitrogen flow, resuspending them afterwards with a final volume of 500 µL with hexane. Previous to injection the sample was still dituted in a proportion of 1:4 (v/v) with hexane.
2.3
Replicate analyses
Due to time related issues, only in the analyses performed in CSU it was possible to prepare some replicate samples (2nd batch). True replicates were prepared for all 49 olive oil samples, nine for tea seed oil, three for corn oil, four for sunflower oil and three for rapeseed oil.
2.4
GC-MS instrument and analytical conditions
Three different sets of experiments were made, two batches performed in the Central South University (CSU) and one batch in the Hunan Agricultural Product Processing Institute (HAPPI). A few additional experiments were also performed in the University of Algarve (UAlg).
For the analysis performed in the laboratory from the CSU, all GC-MS analyses were performed by a Shimadzu GC2010A gas chromatography instrument coupled with a GCMS–QP2010 electronic impact quadrupole mass spectrometer (Shimadzu). In the gas chromatographic system, a DB-23 capillary column (30 m × 0.25 mm × 0.25 µm) was used. Column temperature was programmed from 120 ℃ to 160 at the rate of 20 ℃ /min, 160-190 ℃ at the rate of 6 ℃/min, 190-220 ℃ at the rate of 20 ℃/min, then hold 6 min at 220 ℃. The injection temperature was kept at 250 ℃, the carrier gas was Helium and the column flow 1.0 mL/min. A sample of 1 µL was injected with a split ratio of 500:1.
The analyses performed in HAPPI were carried out by an Agilent G1701EA GC/MSD Chemstation. All the conditions were set the same as the ones used before in CSU,