COMMERCE
?
Sérgio Vasconcelos-de-Oliveira
ISEG – Instituto Superior de Economia e Gestão [email protected]
António Palma-dos-Reis
ISEG – Instituto Superior de Economia e Gestão [email protected]
Abstract
This paper identifies that e-commerce adopters and non-adopters rate differently each of the supposed commerce qualities. While adopters consider that the most important qualities of e-commerce are best values on e-e-commerce, detailed information on e-e-commerce, timeliness, easiness of comparing and comfort, non-adopters rate personalization and availability higher than adopters do. The various patterns of attitude regarding e-commerce qualities were identified through a principal component factor analysis that proposed four factors: detail towards the optimal choice; practical; best values; and flexibility.
The structural equation model explained e-commerce adoption based on the factors above and identified that while high ratings of detail towards optimal choice, practical and best values have a positive impact on e-commerce adoption, high ratings of flexibility is negatively associated with it. The negative association between the valuation of flexibility as an commerce quality and e-commerce adoption suggests that e-e-commerce is not providing enough flexibility, which is composed by personalization and availability, since the adopters rate it lower than the non-adopters do, what leads us to recommend improvements on these features towards the encouragement of the Internet users that are not yet e-commerce adopters.
Keywords: E-Commerce; E-Business; User Acceptance; PCI – Perceived Characteristics of Innovation;
TAM – Technology Acceptance Model; Internet Usage; Diffusion; Cognitive Decision Models; Social Cognitive Model; Self-efficacy; Consumer Behaviour
Introduction
The development and diffusion of the Internet has changed the way people live and run their professional as well as their private life. The Internet, besides being part of the daily life of consumers, is also changing the way most companies communicate with their markets (Song and Zahedi 2006). E-commerce may, with the rise of all-in-one markets (Kambil 2000) and e-service orientation (Kannan et al. 2003), benefit not only buyers but also sellers (Pflughoeft et al. 2003). Given this level of Internet usage, some studies focused on the reasons why people are using the web (UMIC 2003). Even though shopping is not the most popular activity on the Web (NTIA 2002), it is relevant and its importance is increasing. Although some of the existing studies have focused on finding out why some people make online purchases while others don’t and why some of them buy more than others based on demographic
variables like gender (Tweney 1999), age (Dietz 1999), personality characteristics (Jones et al. 1998), computer knowledge (Schumacher et al. 2001) and total time of Internet utilization (CyberAtlas 2000), this work goes a step further by collecting the perceptions from Internet users regarding e-commerce qualities in a way that led the subjects to rank e-commerce qualities, independently from whether the subject was an e-commerce adopter or not. Besides, the data was collected from college students, a young and educated and, therefore, predictive, sample and analyzed towards answering the following research questions:
(i) Are e-commerce adopters and non-adopters perceptions regarding e-commerce qualities homogeneous?
(ii) If not, is it possible to identify a pattern on the relationship between the perceptions regarding the relative relevance of each the commerce qualities and the likelihood to be an e-commerce adopter?
(iii) Do the preferences of the non-adopters regarding the qualities of e-commerce provide any hint on how to improve e-commerce adoption?
Towards answering these questions, we identified the potential qualities of e-commerce based on the literature, surveyed 733 college students from a variety of campuses and evaluated empirically the model derived from the questions above.
The paper is organized as follows: Section I presents the introduction; Section II provides the literature review, both in terms of the former research on ecommerce adoption and in terms of the models explaining the adoption of information technologies; Section III proposes the research model; Section IV presents the methodology for addressing the research questions; Section V discusses the survey results, Section VI presents the conclusions for the study, managerial implications and further research directions..
Literature Review
The diffusion of the Internet has been playing an important role on the development of e-commerce. Perceiving the Internet as a channel providing information and direct sales to their customers, companies have invested in Internet based applications to get closer to their costumers or to establish their global presence. Meanwhile, the amount spent on online shopping is one of the indications of Internet’s
importance. According to (NRF/FORRESTER 2005), U.S. and Canadian citizens spent $4.4 billion online in October/2000, a figure that rose to nearly $6.4 billion in November/2000. Another study (Kopytoff 2005) indicates that between November 1st and December 26th, 2004, US total online sales reached $23.2 billion (€17.2bn), excluding travel, an increase of $4.7 billion over the same period in 2003.
E-commerce is also developing in Europe, especially in northern European countries where technology and e-commerce have been far quicker embraced than in southern European countries (Pastore 2001). In Sweden, the European country with the most developed e-commerce sector (Mintel International Group 2003), four out of five Swedes between the ages of 16 and 76 use the Internet. Half of all Internet users purchase goods or services for private purposes via e-commerce during the first six months of 2002 (LaRoche 2003). In Spain, total online sales went up from 0.48 million euros in 1997 to 1.53 billion euros in 2003 (Asociación Española de Comercio Electrónico 2003), and, in Portugal, online shopping grew from 21 million euros in 1999 to 600 million euros in 2004 (IDC 2002a), op. cit. (UAL 2004). In the UK, online retail sales rose from £10.8bn in 2003 to £18.1bn in 2004 (Richardson 2005).
The reasons why some Internet users adhere to e-commerce while others do not were studied in (Tweney 1999), (Jones et al. 1998), (Schumacher et al. 2001), (Dietz 1999) and (Liang 1998) as well as in other studies that found out additional variables influencing the predisposition for online buying: Perceived benefits were found to be the main driver for online buying (Burke 1997). The most important of these being: convenience, product information, customized products and services, and an enhanced shopping experience.
The online attitude of specific professional classes has been studied based on these variables. In what regards to the student category, it was identified that students are one of the most active groups on the web in the U.S.A, with 81% of the students having already made at least one purchase on the Internet (Pastore 2000) - despite the small amount of money spent, since students essentially buy CDs, books, clothes and concert tickets (Phau 2000). Computer knowledge and Internet expertise, as well as disposable income, are also identified as key factors for online shopping acceptance (Case et al. 2000), even within students. Paulins et al. (2003) concluded that college location is not a key factor for the
incidence of online shopping. However, results show that students who do not have access to a car are more likely to shop online than those who do.
Regarding the country where the data for this paper was collected, Portugal, Vector21.com (2000) realized that, in spite of being one of the most active classes in what regards to online shopping, students are not adopting it massively.
Addressing User - Acceptance Issues
Even thought e-commerce is affirming its relevance, some Internet users are not adhering to it. In order to ascertain why some Internet users adhere to e-commerce while others do not, we reviewed a variety of user-acceptance models. One of the most widely used models to study IT acceptance has been TAM - Technology Acceptance Model (Davis and Venkatesh 1996; Davis et al. 1989; Davis 1989) which derives from the Fishbein and Ajzen’s theory of reasoned action Fishbein et al. 1975). According to TAM, there are two primary drivers for technology acceptance: perceived usefulness, standing for “the degree to which a person believes that using a particular system would enhance his or her job performance” and perceived ease-of-use, corresponding to “the degree to which a person believes that using a particular system would be free from effort” (Davis 1989). Together, these two beliefs should lead the user to develop an attitude that results on a behavioural intention and, ultimately, on a usage behaviour. Davis also points out that perceived ease of use can influence the perceived usefulness and that perceived usefulness can lead directly to some behavioural intention (Davis 1989). These perceptions may change with time as users gain first-hand experience with IT usage, which, in turn, may change their subsequent IT usage behaviour (Bhattacherjee et al. 2004).
Based on TAM, many other models or extensions have been created. TAM 2 (Venkatesh et al. 2000), for instance, extended TAM incorporating two additional constructs: four cognitive factors (job relevance, output quality, result demonstrability and experience), and three social forces (subjective norm, image and voluntariness). In its essence, this model presents two main contributions: it presents some components of the perceived usefulness factor, pointing out the relevance the technology has for the job and the results obtained through it; and it claims that since users are not alone but within society, the
status a user gets for using a specific technology makes a difference, as well as the opinion the user thinks the other group members have about using that technology.
Another extension of TAM, the Motivational Model (Davis et al. 1992), considers the factor motivation in the form of extrinsic motivation (an individual’s personal gain from using a specific technology) and in the form of intrinsic motivation (the perceived enjoyment of the use of that specific technology). The integrated TAM (Venkatesh et al. 2003) was created based on TAM and on the motivational model, integrating on it the motivational factors described above.
In a study on consumer acceptance of mobile payment solutions, trust emerged as a new factor for TAM Integrated Model, including security, trust attitudes and concerns related to security and trust. This originated the Trust Enhanced Technology Acceptance Model (Dahlberg et al. 2003). In this model, trust is conceptualized using two new aspects – disposition to trust and perceived trust. While disposition to trust describes “whether a person is attitudinally willing to trust other or not” (Dahlberg et al. 2003), perceived trust “indicates whether a person perceives that a particular technological solution is secure and trustworthy or not” (Dahlberg et al. 2003). Both will affect the perceived ease of use (through intrinsic motivation) and the perceived usefulness of the technology under analysis.
Even though TAM was developed to explain computer usage behaviour, many authors have extended its application to the Internet context, analyzing, for instance, whether intrinsic motivations could be used to explain consumer’s acceptance of online shopping (Shang et al. 2003). While extrinsic motivations such as convenience, broader selections, competitive pricing and grater access to information had been considered in online shopping (Chen et al. 2002), intrinsic motivations such as perceived playfulness and social influence, already tested in other contexts, have been neglected in online shopping (Teo et al. 1999). Out of this reasoning, the “complemented” TAM, combined it with the flow theory (Csikszentmihalyi 1990) and the theory of fashion (Miller et al. 1993; Reynold 1968; Sproles 1979). The former is conceptualized using cognitive absorption, as a state of perceived playfulness, that is positively related to the online shopping behaviour and to the perceived ease of use and the perceived usefulness of online shopping. The latter refers to “the extent to which one’s behaviour is affected by the fashion trend” (Shang et al. 2003) and studies the impact social influence has over the online shopping behaviour.
The TAM model was also extended by the Task-Technology Fit (TTF) model (Goodhue et al. 1995; Klopping et al. 2004) in order to study consumer e-commerce adoption. The original idea behind the TTF model is that technology adoption depends in some extend on how well the particular technology fits the requirements of a particular task. Viewing online shopping as a task that combines both the purchase and the product information activities (Chen et al. 2002), the TTF model adds to TAM, as it affects the perceived usefulness and the perceived ease of use, as well as the behavioural intention to use the technology.
Independently from the context and the value of all these extensions to TAM, there is something common to all of them: the process that leads to the technology usage. However, Limayem realised that sometimes a non intentional, automatic response, known as habit (Limayem et al. 2001, Triandis 1980) may affect not only the influence of intention on usage, but also the usage directly. The idea is that “as a particular behaviour becomes more routinized, habit becomes more dominant and intention should no longer have as much effect” (Limayem et al. 2001). The result of this reasoning is the Intentional-Habit model.
Another well known model is the perceived characteristics of innovation (PCI) (Moore et al. 1991). According to this model, there are eight PCI factors able to influence the diffusion of an innovation or, in the context of technology adoption, the user adoption of technological innovations in a positive relationship, since higher levels of each factor will be positively related to higher levels of intention to use a specific technology. The factors considered by PCI are: image, compatibility, ease of use, relative advantage, result demonstrability, visibility, trialability and voluntariness.
In the study on the “determinants of Application Service Provider adoption among Norwegian companies”, four additional factors were proposed to the PCI model (Gherman 2002): flexibility, uncertainty, cost effectiveness and self sufficiency. As the original factors, these factors influence the user’s intention to adopt a technology. However, only flexibility and cost effectiveness were positively related with intention to adopt.
PCI factors play a role in user acceptance of electronic commerce in the private sector (Gefen et al. 2003; Van Slyke et al. 2004), as well as in the public sector, in what concerns to citizen adoption of
e-Government (Warkentin et al. 2002). However, the significance of each PCI factor will always depend on some variables, such as the context in which the study is developed and the subjects involved.
An extension of the Social Cognitive Theory (SCT) to the context of computer utilization (Compeau et al. 1995) proposed four core constructs: the performance, as an outcome expectation of the behaviour; the personal consequences of the behavior; self-efficacy, as one's personal beliefs about his or her ability to perform certain tasks; affect, as an individual’s preference for a particular behavior; and anxiety when performing a behavior.
The Unified Theory of Acceptance and Use of Technology (Venkatesh et al. 2003) provides some additional information on most of the models and factors mentioned above while Vasconcelos-de-Oliveira and Palma-dos-Reis (2005) proposed a set of relationships between the variables of the various technology acceptance models.
Research model and research hypothesis
Out of the literature reviewed, the users’ perceptions regarding e-commerce features are likely to have a major impact on the likelihood of adhering to e-commerce, what would be associated with different perceptions e-commerce adopters are supposed to hold from e-commerce non-adopters. So, this paper raises three research questions: (i) Are commerce adopters and non-adopters perceptions regarding e-commerce qualities homogeneous?; (ii) If not, is it possible to identify a pattern on the relationship between the perceptions regarding the relative relevance of each the e-commerce qualities and the likelihood to be an e-commerce adopter?, and; Do the preferences of the e-commerce non-adopters regarding the ranking of the qualities of e-commerce provide any hint on how to improve e-commerce adoption?
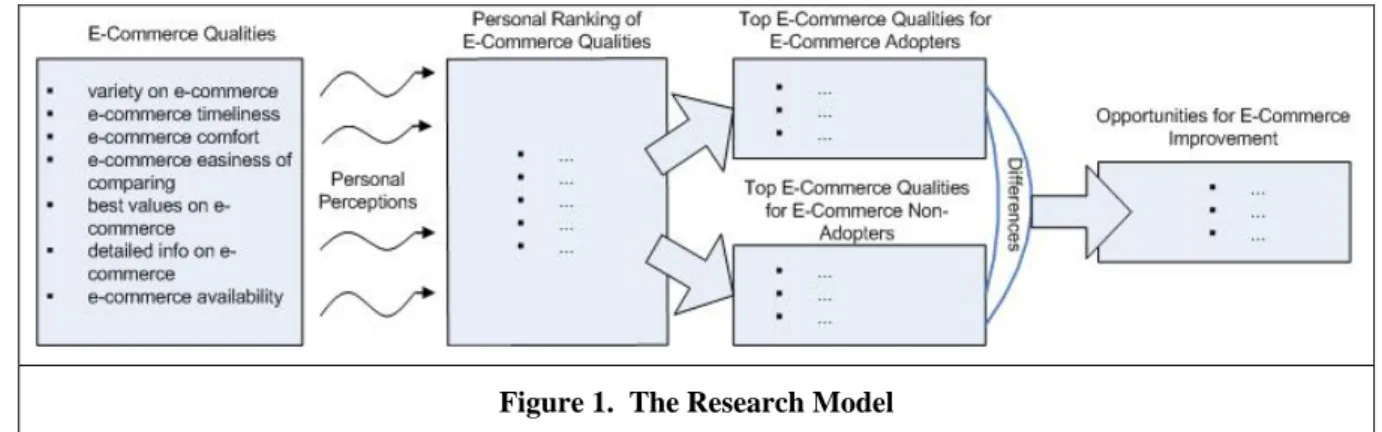
The reasoning under these research questions is graphed on the research model, on Figure 1, that lists a set of qualities often associated with e-commerce and records each Internet user’s perceptions regarding the rank of each of these qualities. If the patterns of the ranking of e-commerce qualities are different across e-commerce adopters and non-adopters, then it is possible to identify which e-commerce qualities
are ranked as more important by adopters and which qualities are ranked best by non-adopters. These differences across rankings may provide some hint on how to improve e-commerce adoption.
Figure 1. The Research Model
The research model on figure 1 assumes that the qualities in table 1, which are typically associated with e-commerce and classified within the variables of the models described in the literature review, are perceived differently by e-commerce adopters and non-adopters, what leads to hypothesis 1:
- E-commerce adopters rate e-commerce qualities differently form e-commerce non-adopters. Due to the exploratory nature of questions 2 and 3 the methodology to address these questions is explained and the data analyzed without formally expressing research hypotheses regarding these questions.
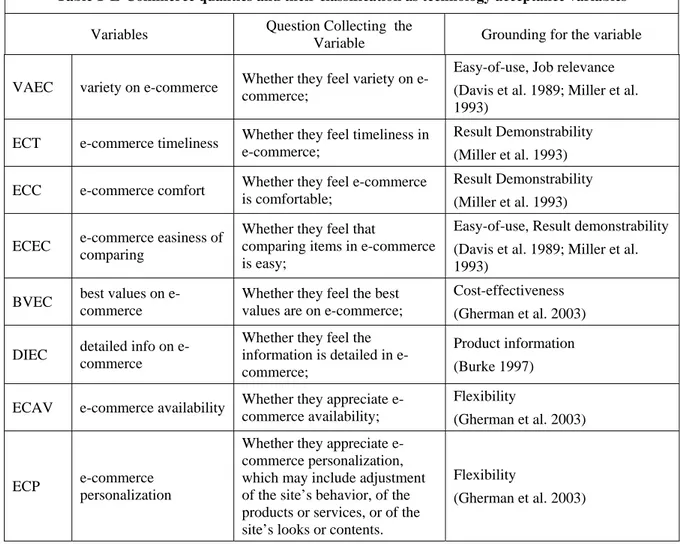
Since the variables on Table 1 are widely recognized as e-commerce qualities and the focus of the paper is on the different perceptions regarding commerce qualities commerce adopters hold from e-commerce non-adopters, instead of using the most common scale selection, the Likert scales, the survey used a rank scale, where the subjects had to rank the most important qualities. Even though this scale does not guarantee homogenous distance between rankings, it makes ties impossible, what fosters a superior discriminating power.
Table 1 E-Commerce qualities and their classification as technology acceptance variables
Variables Question Collecting the
Variable Grounding for the variable VAEC variety on e-commerce Whether they feel variety on
e-commerce;
Easy-of-use, Job relevance (Davis et al. 1989; Miller et al. 1993)
ECT e-commerce timeliness Whether they feel timeliness in e-commerce;
Result Demonstrability (Miller et al. 1993) ECC e-commerce comfort Whether they feel e-commerce
is comfortable;
Result Demonstrability (Miller et al. 1993) ECEC e-commerce easiness of
comparing
Whether they feel that
comparing items in e-commerce is easy;
Easy-of-use, Result demonstrability (Davis et al. 1989; Miller et al. 1993)
BVEC best values on e-commerce
Whether they feel the best values are on e-commerce;
Cost-effectiveness (Gherman et al. 2003) DIEC detailed info on
e-commerce
Whether they feel the information is detailed in e-commerce;
Product information (Burke 1997) ECAV e-commerce availability Whether they appreciate
e-commerce availability;
Flexibility
(Gherman et al. 2003)
ECP e-commerce personalization
Whether they appreciate e-commerce personalization, which may include adjustment of the site’s behavior, of the products or services, or of the site’s looks or contents.
Flexibility
(Gherman et al. 2003)
Methodology
In order to perform a survey-based evaluation of the model proposed in what regards to the effects of the perceived qualities of e-commerce on its acceptance, we prepared a set of questions for a survey to collect data on each of the research model’s variables. The questions were prepared taking into account that users must answer them easily and the relevance of parsimony, which helps the response rate, while collecting enough information to support the research model.
The survey was developed and distributed to college students throughout mainland Portugal, during the academic year of 2004. The college students were selected as subjects since this class adheres to e-commerce in a regular basis and is expected to increase their online shopping activities (CSRE Campus Market Research Series, 2001). This level of adherence made college students one of the most active
online shopping groups (PR Newswire, 2000). Indeed many studies focus theirs studies in college students (Chang and Cheung, 2001; Lee et al., 2001; Lin and Lu, 2000; Magal and Mirchandani, 2001). The questions asked collected Internet user’s frequency of online buying and perceptions regarding e-commerce. These variables are organized in two groups: (1) dependent variables and; (2) independent variables collecting information on the subject’s perceptions regarding e-commerce qualities. The variables collected, their abbreviations, and their grounding, are shown in Table 1.
A stratified approach with the following steps was adopted for the distribution of the questionnaires: 1. The country was divided into regions, which correspond to the university centers. The criteria for this
division was the number of students, avoiding the influence of factors such as location and disposable income, often indicated as possible motivating factors for on-line buying (Paulins et al. 2003). 2. Each university center was divided in fields of study, based on the eleven fields of study defined by
the Ministry of Education.
3. For each field of study in each university center, the target universities and courses were selected based on the number of students enrolled in the previous year.
Simultaneously, an electronic form of the questionnaire was created and published on the Internet. This instrument was relevant for the data entry process, as it contained client script validating code that excluded questionnaires without answers to critical questions. A total of 1200 printed questionnaires was distributed, 30 questionnaires for each course in each field of study in each university. Out of them, a total of 733 answers were received, 102 of which were excluded due to missing answers to crucial questions. Globally, we were able to collect 631 valid survey answers.
Discussion
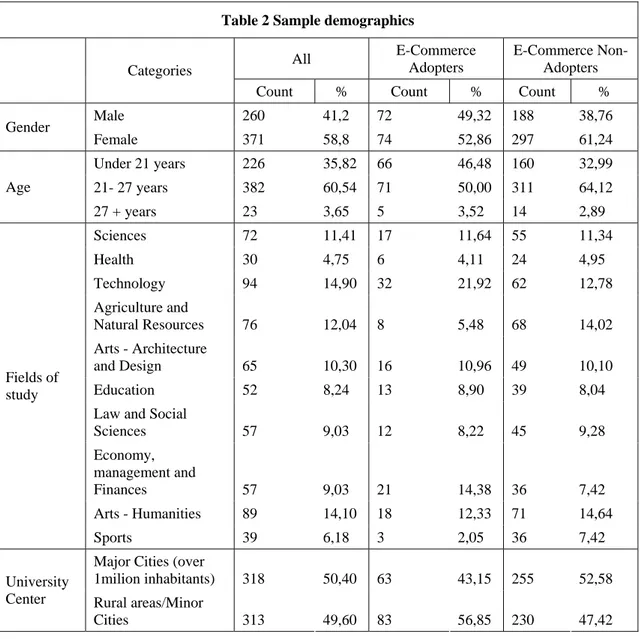
Out of the 631 answers collected, 41.2% was from male students while 58.8% was from female students. Most of the subjects (60.5%) were between 21 and 27 years old, and were somewhat homogenously distributed across fields of study and across rural versus urban campuses. Further details regarding the demographics of the sample are shown in Table 2.
Table 2 Sample demographics All E-Commerce Adopters E-Commerce Non-Adopters Categories
Count % Count % Count %
Male 260 41,2 72 49,32 188 38,76 Gender Female 371 58,8 74 52,86 297 61,24 Under 21 years 226 35,82 66 46,48 160 32,99 21- 27 years 382 60,54 71 50,00 311 64,12 Age 27 + years 23 3,65 5 3,52 14 2,89 Sciences 72 11,41 17 11,64 55 11,34 Health 30 4,75 6 4,11 24 4,95 Technology 94 14,90 32 21,92 62 12,78 Agriculture and Natural Resources 76 12,04 8 5,48 68 14,02 Arts - Architecture and Design 65 10,30 16 10,96 49 10,10 Education 52 8,24 13 8,90 39 8,04
Law and Social
Sciences 57 9,03 12 8,22 45 9,28 Economy, management and Finances 57 9,03 21 14,38 36 7,42 Arts - Humanities 89 14,10 18 12,33 71 14,64 Fields of study Sports 39 6,18 3 2,05 36 7,42
Major Cities (over
1milion inhabitants) 318 50,40 63 43,15 255 52,58
University
Center Rural areas/Minor
Cities 313 49,60 83 56,85 230 47,42
Almost all the respondents (93.3 %) were Internet users, demonstrating that the lack of Internet access is not a resistance factor to online purchasing in Portugal. 60% of those that were not Internet users expressed the intention to start using the Internet during the year 2004. This means that, by the end of 2004, almost all Portuguese college students should be Internet users.
In order to evaluate how college students (including those that buy and those that do not) perceive online shopping in terms of advantages, the subjects were asked about the three main advantages of online shopping. Results showed that 40% of students who bought online considered the variety of products and services the most relevant advantage, followed by comfort (20%), ease of operation (12%) and ability to compare products and services (11%).
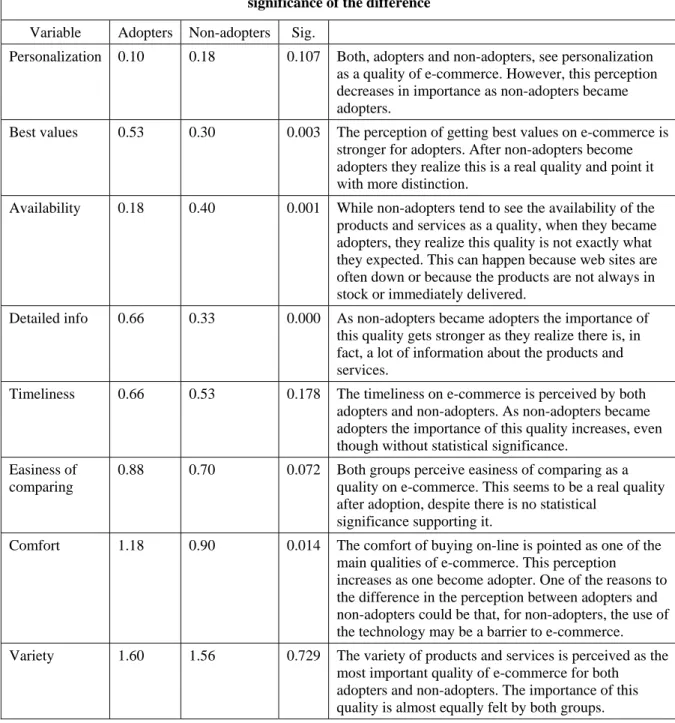
The differences of perceptions among adopters and non-adopters, as well as their level of significance, are presented in Table 3.
Table 3 Average ranking of e-commerce qualities from adopters, non-adopters and Snedcor´s F significance of the difference
Variable Adopters Non-adopters Sig.
Personalization 0.10 0.18 0.107 Both, adopters and non-adopters, see personalization as a quality of e-commerce. However, this perception decreases in importance as non-adopters became adopters.
Best values 0.53 0.30 0.003 The perception of getting best values on e-commerce is stronger for adopters. After non-adopters become adopters they realize this is a real quality and point it with more distinction.
Availability 0.18 0.40 0.001 While non-adopters tend to see the availability of the products and services as a quality, when they became adopters, they realize this quality is not exactly what they expected. This can happen because web sites are often down or because the products are not always in stock or immediately delivered.
Detailed info 0.66 0.33 0.000 As non-adopters became adopters the importance of this quality gets stronger as they realize there is, in fact, a lot of information about the products and services.
Timeliness 0.66 0.53 0.178 The timeliness on e-commerce is perceived by both adopters and non-adopters. As non-adopters became adopters the importance of this quality increases, even though without statistical significance.
Easiness of comparing
0.88 0.70 0.072 Both groups perceive easiness of comparing as a quality on e-commerce. This seems to be a real quality after adoption, despite there is no statistical
significance supporting it.
Comfort 1.18 0.90 0.014 The comfort of buying on-line is pointed as one of the main qualities of e-commerce. This perception
increases as one become adopter. One of the reasons to the difference in the perception between adopters and non-adopters could be that, for non-adopters, the use of the technology may be a barrier to e-commerce. Variety 1.60 1.56 0.729 The variety of products and services is perceived as the
most important quality of e-commerce for both adopters and non-adopters. The importance of this quality is almost equally felt by both groups.
In order to address question 1 and to validate hypothesis 1, a GLM Univariate analysis of variance was computed considering as dependent variable the status of being an e-commerce adopter or not and as independent variables the variables on Table 3. GLM´s Univariate analyses of variance for the global model held a Snedcor´s F of 9.678 with 8 degrees of freedom, which resulted in a significance level of
commerce adopters and non-adopters, rejecting the null hypothesis for hypothesis 1, and, therefore, accepting that perceptions regarding e-commerce from e-commerce adopters and from e-commerce non-adopters are not homogeneous, what corresponds to validating hypothesis 1.
Since hypothesis 1 is validated, we proceed to identifying in which e-commerce qualities do e-commerce adopters and non-adopters ranks of relevance differ significantly. E-Commerce adopters rank best values in e-commerce, detailed information on e-commerce and comfort on e-commerce significantly higher than non-adopters do, while non-adopters rank availability in e-commerce significantly higher than adopters do and personalization higher, even though not significantly, than adopters do. The superior rating ecommerce non-adopters attribute to personalization, as compared to adopters, suggests that the sites e-commerce adopters are using have a long way to go, even though web site design issues and alignment of web sites according to cultural and individual factors are already addressed in works such as Song and Zahedi (2005) and Zahedi et al. (2001).
The differences on the perceptions regarding e-commerce qualities between e-commerce adopters and adopters are graphed in Figure 2. The qualities ranked higher by e-commerce adopters then by non-adopters stand above the diagonal, while the qualities ranked higher by non-non-adopters stand below the diagonal. The closer a quality stands to the diagonal, the more similar it is ranked by e-commerce adopters and non-adopters.
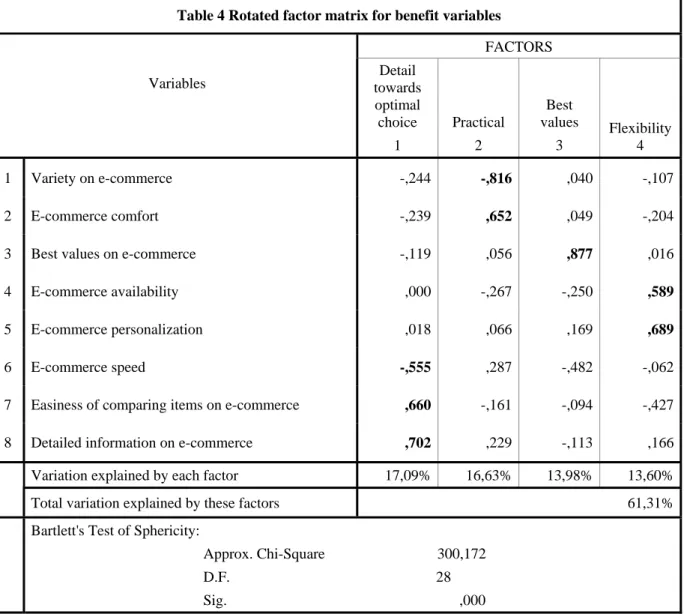
Towards a more complete understanding of the differences between e-commerce adopters and non-adopters ranks of perceptions, a exploratory factor analysis was performed to identify the loading of the answers on the quality variables into latent variables grouping correlated variables (Tabachnik and Fidell 2001), followed by a structural equation model to test the validity of the factors identified and the relationship between the latent variables and the adoption of e-commerce. The factor loadings, which are described in Table 4, result in four factors.
Figure 2. Comparing perceptions regarding e-commerce from its adopters and non-adopters.
Retaining the factor loadings with absolute values on or above 0.5, which is above the minimum of 0.4 suggested by Hair et al. (1995), we get each of the variables loading in a single factor and all factors, except for Best Values in e-commerce, holding two or more variables so, the factor analysis resulted in the following factors and factor loadings:
• Detail towards optimal choice, which corresponds to column 1 and is composed by the following variables:
- E-commerce speed (-)
- Easiness of comparing items on e-commerce (+) - Detailed information on e-commerce (+)
• Practical, which corresponds to column 2 and is composed by the following variables: - Variety on e-commerce (-)
- E-commerce comfort (+)
• Best values on E-Commerce, which corresponds to column 3 and is composed by the following variable:
• Flexibility, which corresponds to column 4 and is composed by the following variables: - E-commerce availability (+)
- E-commerce personalization (+)
The first factor, detail towards optimal choice, reflects the attitude of the internet users that like to evaluate lots of information regarding their various options, no matter how long it takes to finalize the choice; the second factor, practical, refers to the attitude of valuing an easy acquisition process where, with minimal effort, the internet user selects the product or service comfortably, without messing with to many choices; the third factor, best values, refers to the attitude of feeling that value for money is what matters the most, and, finally, the fourth factor, flexibility, refers to the attitude of valuing the possibility of accessing the products and services sold over the internet anytime, anywhere and in any way, style or configuration.
In the present set of vectors, the best values in e-commerce variable ended up as a single-variable vector, what is understandable, since Best Values is likely to have an identity of its own, even though Hair et al. (1995) recommends that each factor should include at least two items.
The results of Bartlett`s test of sphericity, testing the null hypothesis that our sample was randomly drawn from a population in which the correlation matrix would be an identity matrix, indicate that it is appropriate to apply the exploratory factor analysis techniques to this data set. With principal components analysis and a eigenvalue of 1.00 as the deciding criterion, Varimax rotation yielded four factors that explained 61,31% of the matrix variance. According to Hair et al. (1995) practical significance criteria, individual item factor loadings have to exceed 0.4.
With the factors identified by the factor analysis, we proceed to estimate the relationships between these factors and the adoption of e-commerce, while comparing the factors, using the structural equation modeling (SEM). The output variable, the user behavior, is defined as the difference between the behavior of the specific user from its group, since the group the individual belongs to may affect an individual’s likelihood to adhere to ecommerce. We identified the geographic area where the student is attending school as a group affiliation that may affect as individual’s likelihood to adhere to e-commerce.
Since this factor can influence the students’ likelihood to adhere to ecommerce, we had, either to include it in the model, or to exclude the factors’ influence from the data. Since our purpose is to identify the impact of the users’ perceptions regarding ecommerce qualities on ecommerce adoption, we decided to exclude the impact of geographical issues from the data.
Table 4 Rotated factor matrix for benefit variables
FACTORS
Variables towards Detail
optimal choice 1 Practical 2 Best values 3 Flexibility 4 1 Variety on e-commerce -,244 -,816 ,040 -,107 2 E-commerce comfort -,239 ,652 ,049 -,204
3 Best values on e-commerce -,119 ,056 ,877 ,016
4 E-commerce availability ,000 -,267 -,250 ,589
5 E-commerce personalization ,018 ,066 ,169 ,689
6 E-commerce speed -,555 ,287 -,482 -,062
7 Easiness of comparing items on e-commerce ,660 -,161 -,094 -,427
8 Detailed information on e-commerce ,702 ,229 -,113 ,166
Variation explained by each factor 17,09% 16,63% 13,98% 13,60%
Total variation explained by these factors 61,31%
Bartlett's Test of Sphericity:
Approx. Chi-Square 300,172 D.F. 28 Sig. ,000 Extraction Method: Principal Component Analysis.
Rotation Method: Varimax with Kaiser Normalization.
Therefore, our dependent variables are the difference each individual holds from the average individual attending school in the same geographical area. So, the dependent variables that construct the user behavior latent variable are:
- Additive difference between the frequency of each subject’s online buying and the average frequency of online buying of the subjects attending college in the same geographical area, that
is: [Frequency of Online Buying] - average of subjects attending college in the same region ([Frequency of Online Buying]), (DFOBA);
- Multiplicative difference between the frequency of each subject’s online buying and the average frequency of online buying of the subjects attending college in the same geographical area, that is: [Frequency of Online Buying] / average of subjects attending college in the same region ([Frequency of Online Buying]), (DFOBM);
The reliability of the convergence of these two measurements for user behavior was tested using the Cronbach Alpha, which assumed the value of 0.993, well above the recommended minimum of 0,7 (Straub 1989).
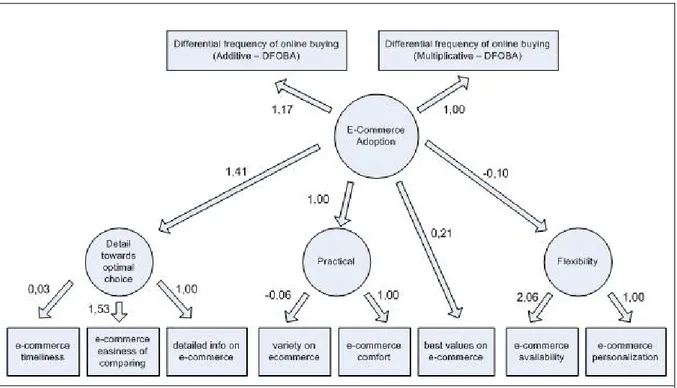
The SEM converged properly and provided positive information regarding the fit of the model, as well as coefficients consistent with what we would expect (see figure 3).
Figure 3. Structured Equation Model associating the e-commerce qualities perceived by e-commerce adopters and non-adopters with their e-commerce adoption behavior
Using Amos’s maximum likelihood estimation, the likelihood ratio chi-square statistic is 12.436, with 14 degrees of freedom, resulting in a p-value of 0,571. Since this p-value refers to how significant is the
departure of the data from the model, we may not reject the null hypothesis that the model fits the data, because the data does not depart significantly from the model at any conventional significance level. The model tested, which is presented in Figure 3, also outperformed the recommendations of RMSEA values below 0,06 (Hu et al. 1999) and Tucker-Lewis Index values of 0,95 or higher (Hu et al. 1999), since it provided a RMSEA of 0,000 and a Tucker-Lewis Index value of 1,001. These results provide evidence showing that the proposed model actually fits the data collected. For further information regarding the fit of the model, please see Tables 5 through 7.
Table 5 CMIN
Model NPAR CMIN DF P CMIN/DF
Default model 41 12.436 14 .571 .888
Saturated model 55 .000 0
Independence model 10 3638.165 45 .000 80.848
Table 6 RMR, GFI
Model RMR GFI AGFI PGFI
Default model .011 .996 .985 .254 Saturated model .000 1.000
Independence model .098 .768 .716 .628
Table 7 Baseline Comparisons
Model NFI Delta1 RFI rho1 IFI Delta2 TLI rho2 CFI Default model .997 .989 1.000 1.001 1.000 Saturated model 1.000 1.000 1.000 Independence model .000 .000 .000 .000 .000
Conclusions, Managerial Implications and Research Directions
This paper surveyed 631 college students from a variety of campuses and fields of study on whether they adopt e-commerce and the qualities they perceive on it. Indeed, the perceptions regarding ecommerce
detailed information in ecommerce, more timeliness in ecommerce, more easiness of comparing, more comfort and more variety on ecommerce, while non-adopters perceive more personalization and more availability on ecommerce than ecommerce adopters. Such results question how much personalization and how much availability is ecommerce really providing to its adopters.
The higher ranking non-adopters attribute to availability and personalization may suggest that those may be avenues for e-commerce improvements since non-adopters expect these qualities to be more relevant than adopters recognize them to be.
A side issue for this paper that is under current investigation refers to the reasons for these differences in perceptions. This paper assumes that adopters and non-adopters are homogeneous since they belong to a homogeneous population, and that it is the commerce experience that changes the subject’s e-commerce perception. However, a longitudinal study may establish the change incurred on an individual’s perception over time, namely, before and after e-commerce adoption.
References
Asociación Española de Comercio Electrónico, “Estudio sobre Comercio Electrónico B2C 2004”, 2003, www.aece.org.
Bhattacherjee, Anol, Premkumar, G., “Understanding changes in belief and attitude toward information technology usage: A theoretical model and longitudinal test”, MIS Quarterly (28:2), 2004, pp. 229-254
Burke, R.R., “Do You See What I See? The Future of Virtual Shopping.” Journal of the Academy of Marketing Science (25:4), 1997, pp. 352-360.
Case, T., Burns, O.M. and Dick, Geoffrey N., “Drivers of On-Line Purchasing Among U.S. university Students”, Seventh Americas Conference on Information Systems, 2000, pp. 91-95.
Chen, L., Gillenson, M., & Sherrell, D., “Enticing online consumers: An extended technology acceptance perspective”, Information & Management (39:8), 2002, 705-719.
Chang, M. K., & Cheung, W., Determinants of the intention to use Internet/WWW at work: A confirmatory study. Information & Management (39:1), 2001, pp. 1-14.
Csikszentmihalyi, Mihaly, Flow, The Psychology of Optimal Experience, Harper Collins, 1990.
CSRE Campus Market Research Series. “College students more inclined to shop online, survey finds”, Westchester County Business Journal (40:11), 2001, pp. 21.
CyberAtlas, “Increase Seen in Internet Shopping”, 2000, http://cyberatlas.internet.com/big_picture/demographics/article/0,1323,5901_238221,00.html, revised at 8/04/2006.
Compeau, D. R., and Higgins, C. A. “Computer Self-Efficacy: Development of a Measure and Initial Test,” MIS Quarterly (19:2), 1995b, pp.189-211.
Davis, F.D., Bagozzi, R.P. and Warshaw, P.R., “User Acceptance of Computer Technology: A Comparison of Two Theoretical Models”, Management Science (35:8), August 1989, pp. 982-1003.
Davis, FD. “Perceived usefulness, perceived ease of use and user acceptance of information technology”, MIS Quarterly 1989, (13;3), pp. 319-340.
Davis, F. D., Bagozzi, R. P. and Warshaw, P. R., “Extrinsic and intrinsic motivation to use computers in the workplace”, Journal of Applied Social Psychology (22:14), 1992, pp. 1111- 1132.
Davis, F. D., Venkatesh, V., “A critical assessment of potential measurement biases in the technology acceptance model: Three experiments”, International Journal of Human-Computer Studies (45:1), 1996, pp. 19-45.
Dahlberg, Tomi; Mallat, Niina; and Öörni, Anssi, “Trust enhanced technology acceptance model - Consumer
Acceptance of mobile payment solutions”, 2003, http://web.hhs.se/cic/roundtable2003/papers/D31_Dahlberg_et_al.pd, verified at April 7, 2006.
Dietz, Janis, “When Gen X Meets Aging Baby Boomers”, Marketing News (33:10), 1999, pp. 17-18.
Fishbein, M., and Ajzen, I., Belief, Attitude, Intention and Behavior: An Introduction to Theory and Research, Addison-Wesley, Reading, MA, 1975.
Gherman, Ariel, “Wahid Fathul, Empirical Test of An Application Service Provider Adoption Model”, International Arab Conference on Information Technology (ACIT’ 2002), December 16th - 19th, 2002, University of Qatar, Qatar.
Gherman, A., Wahid, F., Maung, K. S. and Dertz, W., “Determinants of Application Service Provider Adoption among Norwegian Companies”. NOKOBIT 2003, Oslo, 24. - 26. November 2003, pp. 304-329.
Gefen, D, E Karahanna and D Straub, (2003), “Trust and TAM in Online Shopping: An Integrated Model”, MIS Quarterly (27:1), March 2003, pp 51-90.
Goodhue, D. L., Thompson, R. L., “Task-technology fit and individual performance”, MIS Quarterly (19:2), 1995, pp. 213-236.
Hair, J.F., Anderson, R.E., Tatham, R.L. and Black, W.C., Multivariate Data Analysis (4th Edition). New Jersey: Prentice Hall, 1995.
Hu, L., and Bentler, P. M., “Cutoff criteria for fit indexes in covariance structure analysis: Conventional criteria versus new alternatives”, Structural Equation Modeling (6:1), 1999, pp. 1-55.
IDC (2002a), eBusiness: Análise do Mercado e Tendências de Investimento, 2001-2005, IDC Portugal, Lisboa, Maio de 2002.
Jones, J.M., e L.R. Vijayasarathy, “Internet Consumer Catalog Shopping: Findings from an Exploratory Study and Directions for Future Research”, Internet Research-Electronic Networking Applications and Policy (8:4), 1998, 322ff.
Kambil, A., Nunes , P., Wilson, D. “The all-in-one market”, Harvard Business Review (78:3), 2000, pp. 19.
Kannan, P.K., Rust, R.T., “E-service: A new paradigm for business in the electronic environment”, Communications of the ACM (46:6), 2003, pp. 37.
Kopytoff, Verne, “Internet sales way up over '03 Consumers spent $23.2 billion during holidays”, Tuesday, January 4, 2005 SFGate.com,http://www.sfgate.com/, verified at April 7, 2005.
Klopping, M. Inge; McKinney, Earl, “Extending the Technology Acceptance Model and the Task-Technology Fit Model to Consumer E-Commerce”, Information Technology, Learning and Performance Journal (22:1), spring 2004, pp 35-48.
LaRoche, Gunilla, E-commerce in Sweden, 2003, http://strategis.ic.gc.ca/epic/internet/inimr-ri.nsf/fr/gr115456f.html, verified at November 14th, 2005..
Liang, Ting-Peng, Huang, Jin-Shiang, “An empirical study on consumer acceptance of products in electronic markets: A transaction cost model” Decision Support Systems (24:1), 1998, pp. 29..
Lee, D., Park, J. & Ahn, J., “On the explanation of factors affecting e-commerce adoption”, Proceedings of the Twenty-Second International Conference in Information Systems, 2001, pp. 109-120.
Lin, J. C. C., & Lu, H.,. “Towards an understanding of the behavioural intention to use a web site”, International Journal of Information Management, (20:3), 2000, pp. 197-208.
Limayem, Moez; Hirt, Sabine Gabriele; Chin, Wynne W., “Intention does not always matter: the contingent role of habit on IT usage behavior”, The 9th European Conference on Information Systems, Bled, Slovenia, June 27-29, 2001.
Magal, S. R., & Mirchandani, D. A., “Validation of the technology acceptance model for Internet tools”, Proceedings of the Americas Conference on Information Systems, 2001, pp. 1-16.
Mintel International Group,. http://www.marketresearch.com/map/prod/952665.html, 2003, verified at November 14th, 2005.
Miller, C. M., McIntyre, S. H. & Mantrala, M. K., “Toward Formalizing Fashion Theory", Journal of Marketing Research (30), May 1993, 142-157.
Moore, G. C., I. Benbasat, “Development of an instrument to measure the perceptions of adopting an information technology innovation”, Information Systems Research, (2:3), 1991, pp. 173-191.
NTIA - National Telecommunication and Information Administration, “A nation online: How Americans are expanding their use of the Internet”, U.S. Department of Commerce, Washington, DC., 2002, Retrived June 13, 2005, from www.ntia.doc.gov/ntiahome/dn/index.html.
NRF/FORRESTER ONLINE RETAIL INDEX, “Online spending exceeds $6 billion in November”, http://www.nrf.com/, verified at April 7, 2005.
Pastore, Michael, “US College Students Use Net for Shopping” ClickZ Network, http://www.clickz.com/stats, 2000, verified at April 7, 2005.
Paulins, Ann e Xu, Yingjiao, “College students attitudes toward online shopping for apparel products”, Proceedings of International Conference on e-Business, http://www.ohiou.edu/researchnews/research/online_shopping.html, 2003, verified at April 7, 2005.
Phau, I. e Poon, S.M. (2000) “Factors Influencing the Types of Products and Services Purchased Over the Internet”, Internet Research. Electronic networking Applications and Policy (10:2), 2000, pp.102-113.
Pflughoeft, K.A., Ramamurthy, K., Soofi, E.S., Yasai-Ardekani, M. & Zahedi, F.M., “”, Decision Sciences (34:3), 2003, pp. 467-512.
PR Newswire,. “Online survey by edu.com reveals college students plan to spend $2.2 billion online this holiday season”, PR Newswire Association, Inc., 2002, November 21, p. 2987.
Reynold, W. H., “Cars and Clothing: Understanding Fashion Trends”, Journal of Marketing (32), July 1968, pp 44-49.
Richardson, Tim, “UK online sales rocket”,. http://www.theregister.co.uk/2005/11/04/ online_sales, 2005. verified at November 14th.
Schumacher, P. & Morahan-Martin, J., “Gender, Internet and Computer Attitudes and Experiences”, Computers in Human Behavior, (17), 20001, pp. 95-110.
Shang, R.A., Chen, Y.C. & Lysander, S., “Consumer´s Acceptance of Internet Shopping: Intrinsic versus Extrinsic Motivations”, Hawaii International Conference on Business, Honolulu, Hawaii, 2003, June 18 -21.
Song, J. & Zahedi, F.M., “Internet marketing strategies: Antecedents and implications”, Information & Management. (42:2), 2006, pp 222-238.
Song, J. & Zahedi, F.M.,”A Theoretical Approach to Web Design in E-Commerce: A Belief Reinforcement Model”, Management Science, (51:8), 2005, pp. 1219-1225.
Sproles, G. B., Fashion: Consumer Behavior toward Dress, Minneapolis: Burgess, 1979.
Straub, D.W., “Validating Instruments in MIS Research”, MIS Quarterly (13:2), 1989, pp.147-169.
Tabachnik, B. G., & Fidell, L. S., Using Multivariate Statistics (4th ed.). Needham Heights, MA: Allyn and Bacon, 2001.
Teo, T. S. H., Lim, V. K. G., & Lai, R. Y. C., “Intrinsic and extrinsic motivation in Internet usage”, Omega (27:1), 1999, pp. 25-37.
Triandis, H.C., “Values, attitudes, and interpersonal behavior,” In H.E. Howe (Ed.), Nebraska Symposium on Motivation, 1979: Beliefs, Attitudes and Values, Lincoln: University of Nebraska Press, 1980, pp. 195-259. Tweney, Dylan, “Men and Women: Online, We Should Be More Than Markets.” InfoWorld (21:39), 1999, pp. 76. UMIC, “Inquérito à Utilização das Tecnologias da Informação e da Comunicação pela População Portuguesa”,
2003, www.umic.gov.pt, , verified at April 7, 2006.
UAL – Universidade Autónoma de Lisboa, “Panorama Geral do comércio electrónico em Portugal”, Seminário de E-Strategy - Estratégias de comércio electrónico para as PME, Lisboa, 30 de Junho de 2004.
Vasconcelos-de-Oliveira, S. & Palma-dos-Reis, A., “Integrating technology acceptance models towards explaining e-commerce diffusion”, Proceedings of the Annual Meeting of the Decision Sciences Institute,. 2005, pp. 18481-18486.
Van Slyke C, F Bélanger and C L Comunale, “Factors Influencing the Adoption of Web-Based Shopping: The Impact of Trust”, The Data Base for Advances in Information Systems, (35:2), 2004.
Vector21.com, “A Comunidade Escolar e As Compras na Net”, 2000, www.vector21.com.
Venkatesh, V, Davis F.D., “A theoretical extension of the technology acceptance model: four longitudinal field studies”, Management Science, (46:2), 2000, pp. 186-204.
Venkatesh, V., Morris, M. G., Davis, G.B., & Davis, F. D., “User acceptance of information technology: Toward a unified view”, MIS Quarterly, (27:3), 2003, pp. 425-478.
Warkentin, M, D Gefen, P Pavlou and G Rose, “Encouraging Citizen Adoption of e-Government by Building Trust”, Electronic Markets. (12:3), 2002, pp 157-162.
Zahedi, F.M., Pelt, V.V. & Song, J., “A conceptual framework for international web design”, IEEE Transactions on Professional Communication (44:2), 2001. pp. 83-103.